Article
J. Braz. Chem. Soc., Vol. 24, No. 4, 645-650, 2013. Printed in Brazil - ©2013 Sociedade Brasileira de Química 0103 - 5053 $6.00+0.00
A
*e-mail: [email protected]
Determination of Fuel Origin by Comprehensive 2D GC-FID and
Parallel Factor Analysis
Luiz A. F. de Godoy,a,b Marcio P. Pedroso,c Leandro W. Hantao,a,b Fabio Augustoa,b and Ronei J. Poppi*,a,b
aInstitute of Chemistry, University of Campinas (Unicamp), CP 6154, 13083-970 Campinas-SP, Brazil
bInstituto Nacional de Ciência e Tecnologia em Bioanalítica (INCTBio), University of Campinas, CP 6154, 13083-970 Campinas-SP, Brazil
cDepartment of Chemistry, Federal University of Lavras (UFLA), 37200-000 Lavras-MG, Brazil
Neste trabalho, um método para a diferenciação de gasolinas de acordo com a sua origem geográfica é proposto. Cromatografia gasosa bidimensional abrangente com detecção por ionização em chama (GC×GC-FID) em conjunto com a análise multivariada foi utilizada para diferenciar amostras de gasolina brasileira de amostras oriundas da Venezuela. A análise de fatores paralelos (PARAFAC) foi utilizada no reconhecimento de padrões dos cromatogramas GC×GC-FID e foi aplicada com êxito na diferenciação das amostras de gasolina. Através da análise dos gráficos de escores e pesos gerados pela análise PARAFAC, foi possível determinar que eluatos de média a alta volatilidade, tanto alifáticos quanto aromáticos, foram responsáveis por essa diferenciação.
In this work, a method for differentiation of gasoline according to its geographical origin is presented. Comprehensive two-dimensional gas chromatography-flame ionization detection (GC×GC-FID) combined with multivariate analysis was used to differentiate Brazilian and Venezuelan gasoline samples. Pattern recognition of the GC×GC-FID chromatograms was performed by parallel factor analysis (PARAFAC) and it was successfully applied for the differentiation of these gasoline samples. Eluates with medium to high volatility, both aliphatic and aromatic, were responsible for this differentiation, based on the inspection of the score and loading graphs generated by PARAFAC.
Keywords:comprehensive two-dimensional gas chromatography, gasoline, multivariate analysis, parallel factor analysis, pattern recognition
Introduction
Petroleum and its derivatives are some of the most complex samples known to the analytical chemists. Fuels, derived from this source, are usually composed of several hundreds of individual analytes, such as alkanes, isoalkanes, alkenes, naphtenes, etc.1 Specifically, gasoline
is a petroleum-derived fuel constituted by mainly a mix of hydrocarbons from C4 to C12, with distillation range from
30 to 225 °C, which also contains traces of oxygenates and other minor compounds. In Brazil, the commercially available gasoline (type C) consists of “raw” gasoline (type A, obtained after refining and not available for the consumer) with 25 ± 1% (v/v) of anhydrous ethanol. Fuel adulteration is a widespread practice in several countries. In Brazil, it is a major source of public concern and it is a
felony.2 Since 1999, the Brazilian National Agency for Oil,
Natural Gas and Biofuels (Agência Nacional do Petróleo, Gás Natural e Biocombustíveis, ANP) runs a nationwide
fuel quality program.3 The official ANP procedure
consists of pre-screening of samples by the American Society for Testing and Materials (ASTM) tests and gas chromatographic (GC) analyses of all suspect samples. Another illegal operation practiced in Brazil is the gasoline
smuggling.3 This felony is mostly concentrated at the
Brazilian territorial border with Venezuela because of the substantially lower price of the gasoline produced in the latter. However, as opposed to gasoline adulteration, no standard method is available for the differentiation of national gasoline from foreign gasoline samples. Potentially, one way to distinguish between these samples could be through a detailed comparison of its composition.
analysis of complex mixtures, such as gasoline samples. Hence, GC is currently one of the most important benchmark tools for this purpose. However, due to the complexity of gasoline, an analysis of gasoline by GC can take up to 3 h and, possibly, some co-elution may still be found. Therefore, a more powerful technique should be used and the comprehensive two-dimensional gas
chromatography (GC×GC)4 has been recognized as the
most promising innovation since the introduction of the
capillary columns.5 GC×GC offers both increased peak
capacity and enhanced detectability, without extending
analysis time.6 Thus, GC×GC has been extensively used
to solve analytical problems related to petrochemical derivatives.3,7-21 In addition, some methods for fuel quality
control are based on qualitative information regarding the analytes, such as the ASTM D2425 method, which is used for hydrocarbon type analysis of middle distillates.22
Although GC×GC-FID (flame ionization detection) uses a non-selective detector, it still offers qualitative information due to the presence of ordered structures in the two-dimensional chromatograms (the chromatographic structure) that allows unequivocal identification by simple visual inspection of these chromatograms if one or more compounds in a cluster have been identified previously.23,24
S o m e r e p o r t e d a p p l i c a t i o n s o f G C × G C f o r petrochemical samples included the characterization of fuels12 and quantification of specific group of analytes11,13,14
in oil products, as well as environmental studies related to identification and monitoring of degradation of
spilled oil.15,16 Compared to conventional GC-FID (or
even GC-MS), the amount of information contained on a GC×GC-FID chromatogram is considerably larger. Consequently, the adoption of chemometric strategies for processing and interpretation of GC×GC data is often desirable. Augusto and co-workers3 successfully reported
the use of multi-way partial least squares regression (N-PLS) for the identification of gasoline adulteration
by GC×GC, while Poppi et al.17 assessed several N-way
multivariate methods for the quantitation of kerosene
in gasoline. In addition, Synovec and co-workers18,19
showed that tri-linear generalized rank annihilation method (GRAM) or parallel factor analysis (PARAFAC) deconvolution techniques were adequate for quantitation of target analytes from GC×GC-FID chromatograms. Apart from target identification and quantification, grout-type analysis can be advantageously performed
by chemometric analysis of GC×GC data.20,21 However,
identification and classification of complex samples through pattern recognition are both a promising and still incipient field for petrochemical samples.25,26 In this
sense, the current study proposes the differentiation of
Brazilian gasoline samples from Venezuelan samples by analyzing their respective GC×GC data with multivariate analysis, PARAFAC. The use of PARAFAC in GC×GC has been limited to the deconvolution of partially overlapped chromatographic peaks and its use for quantification purposes. However, its use for pattern recognition of two-dimensional chromatographic data still has not been reported. In this work, the use of PARAFAC in GC×GC for pattern recognition purposes is presented.
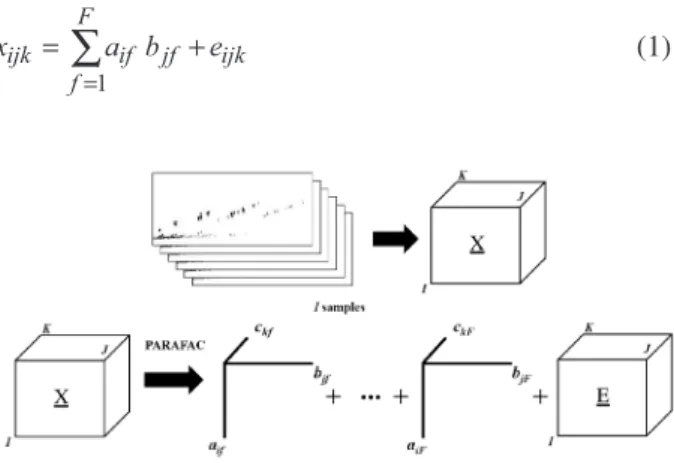
PARAFAC is a natural expansion for the principal component analysis (PCA) for multi-way data and can be used as a pattern recognition method.27 For three-way data,
such as those originating from GC×GC, the PARAFAC model decomposes the X array (i, j, k) in one score matrix A and two loading matrices B and C containing the elements aif, bjf, ckf, respectively, as illustrated in Figure 1.28
Additionally, each matrix is related to each dimension of
X: the sample mode (mode i), and the first and second
dimension retention time (mode j and k, respectively). The tri-linear model is found to minimize the sum of squares of the residuals (eijk) in the model:
(1)
One of the main advantages of PARAFAC is its ability to provide a unique solution that is independent on rotation.28
Additionally, an important step in PARAFAC analysis is the choice of the number of factors. The number of factors can be estimated by a number of procedures such as the estimation based on the prior knowledge of the system, or with respect to the explained variance by the model or through cross-validation.29 For the pattern recognition, the
core consistency diagnostic (CORCONDIA) was used to aid in the determination of the number of factors to be chosen for the PARAFAC model. CORCONDIA indicates how well the model is concerted with the distribution of the superdiagonal and off-superdiagonal elements of the Tucker3 core. If the PARAFAC model is correct, it is
expected that the superdiagonal elements will be close to
one and the off-superdiagonal elements close to zero.30
CORCONDIA is defined as:
(2)
where gijk is the calculated element of the core using
PARAFAC model, tijk the element of a binary array with
zeros in all elements and ones in the superdiagonal (the expected Tucker3 core) and F is the number of factors in the model. An ideal PARAFAC model is obtained if gijk is equal to tijk with a corresponding CORCONDIA value of 100%.30
Experimental
Samples
All gasoline samples were type A. A total of 51 samples (25 Brazilian and 26 Venezuelan) was individually transferred to flasks and kept refrigerated at −13 ºC to avoid loss of the volatile analytes.
Chromatographic conditions
The type A gasoline samples were analyzed in a laboratory designed and assembled GC×GC-FID instrument. This equipment consisted of a commercial Agilent HP6890N GC-FID (Agilent technologies, Wilmington, DE, USA), with a split/splitless injector, fitted with a two-staged jet cryogenic modulator, previously reported elsewhere.10,24 The employed column set consisted
of a primary 30 m × 0.25 mm, 0.25 µm film thickness
HP-5MS (Agilent, Avondale, PA, USA) capillary column serially connected to a secondary 1.0 m × 0.10 mm, 0.10 µm film thickness SupelcoWax 10 (Sulpeco, Bellefonte, PA, USA) capillary column. The injector and detector were operated both at 250 °C. The injected volume was 1 µL at a split ratio of 1:300. Hydrogen at 0.6 mL min-1 was used
as carrier gas. The chromatographic oven temperature programming was set from 60 to 226 °C at 3 °C min-1. The
modulation period was set to 6 s. Sample digitalization was performed at 100 Hz by the Chemstation commercial software (Agilent, Avondale, PA, USA).
Data processing
The two-dimensional chromatograms were unfolded and the corresponding vectors aligned with the Correlation
Optimized Warping (COW) algorithm.31 The multi-way
analysis was performed on a MatLab 6.5 program (Mathworks, Natick, MA, USA). The PARAFAC algorithm was obtained from the N-way Toolbox 2.11. Singular value decomposition was used for the initialization of the PARAFAC model. No pre-processing was performed during calculation of the model, while non-negativity was used as constraint.
Results and Discussion
As already mentioned, there is no official method for the detection/differentiation of gasoline samples from different sources, such as in the case of Brazilian and Venezuelan gasolines. The differentiation of mixtures, ideally, should be a rather simple task if there were unique analytes present in one sample and not in the other. However, a sample with increased number of analytes and with high structural diversity makes this task rather difficult such as the case of gasoline samples. Hence, GC×GC-FID, which provides enhanced resolution, and PARAFAC, which allows the analyst to perform pattern recognition, should be an extremely valuable combination for this purpose.
In Figure 2, both chromatographic profiles of the Brazilian and Venezuelan gasoline samples are illustrated. Furthermore, an initial visual inspection shows no readily perceivable differences between these samples in terms of composition and specific markers. Therefore, differentiation of these samples by visual inspection or by conventional manual processing would have been both a difficult and time-consuming task. Consequently, a multivariate analysis is often recommended because of the high amount of information contained in the GC×GC-FID
chromatograms. An adequate N-way chemometric tool recommended for pattern recognition was used, PARAFAC. This method is recommended for the analysis of three-way data such as those from GC×GC-FID systems although its use for exploratory analysis is still incipient.
Firstly, the two-dimensional chromatograms were unfolded into vectors for retention time alignment using the COW algorithm. Hence, prior to alignments, the initial and final regions of the chromatograms were discarded because they did not contain any information relevant for the discrimination of the gasoline samples and in order to reduce the amount of time spent for the processing of data. Even more, the alignment was necessary because the chemometric model was built with PARAFAC for the differentiation of the gasoline samples and, thus, one of the pre-requisites for this algorithm is the tri-linearity of the data.
Secondly, for PARAFAC analysis, the choice of the number of factors is of utmost importance. The CORCONDIA test indicated that the ideal number of factors was three, because when only two factors were chosen, the differentiation between Brazilian and Venezuelan gasoline samples was not perceivable. However, a choice of four factors resulted in a lowering of 50% on the CORCONDIA test. Consequently, 3 factors were chosen and a non-negative constraint was applied in order to obtain chemically meaningful results.
The score graph obtained from the sample modes from the three factors used in the PARAFAC model is illustrated in Figure 3. It can be readily seen a clustering of the Brazilian gasoline samples away from the Venezuelan samples. Thus, the proposed combination of GC×GC with PARAFAC could successfully differentiate the national gasoline samples from foreign samples.
In order to evaluate the analytes or group of analytes responsible for the differentiation of the Brazilian gasoline samples from the Venezuelan samples, the loading matrices of the three factors were analyzed. The contour plots
illustrated in Figure 4 represent the regions of the actual two-dimensional chromatogram that contributed to the observed pattern by PARAFAC. Consequently, through visual inspection of these regions, it could be seen that the differentiation of the gasoline samples was possible because it relied on the chromatographic profile rather than in a single marker. This fact shows the absence of individual markers that could be used to correlate the sample to its geographical origin and, most likely, that manual processing of the chromatographic data would have been an extensively time-consuming task.
In Figure 4, the loading graph of the three factors used in PARAFAC is shown. An inspection of these individual contour plots shows the analytes with the highest contribution to their respective factor. It was noticed that the analytes that contributed to the first and second factor loadings belonged essentially to the classes of alkanes, alkenes and cyclic alkanes. The main difference was that
Figure 3. Score graph of the three factors used for the exploratory analysis by PARAFAC. It can be readily seen the clustering of the Brazilian () and the Venezuelan gasoline samples ().
the first factor had major contributions from the more volatile analytes, while the third factor is comprised of less volatile compounds. As for the second factor, the analytes that played an important role had intermediate volatility between the first and third factors. Additionally, a more detailed inspection of the score graph shows that the clustering of the gasoline samples was performed essentially by the second factor. Hence, since the second factor comprised of analytes with medium to high volatility, it can be stated that the differentiation was based, mostly, on these analytes. Thus, it can be inferred that the Venezuelan gasoline samples had higher amounts of more volatile analytes while the Brazilian analytes had higher quantities of less volatile analytes because the Venezuelan samples had the highest score values for the second factor when compared to the Brazilian samples.
Conclusions
T h e r e s u l t s s h ow t h a t t h e c o m b i n a t i o n o f GC×GC-FID and multivariate analysis can be employed as a general tool for the differentiation of contraband of gasoline, using the raw chromatograms as input data. This procedure was successfully tested with Brazilian and Venezuelan gasoline samples. Also, all gasoline samples were properly differentiated through pattern recognition by PARAFAC. These results show that GC×GC-FID and PARAFAC can be a powerful tool to solve similar analytical problems in which complex mixtures comprised of several hundreds of compounds need to be differentiated through pattern recognition. In addition, a detailed inspection of the score graph and the loading graph allowed the identification of the group of compounds responsible for the distinction of these complex samples.
Acknowledgments
The authors thank licensed Noroska Gabriela Salazar Mogollón, Central University of Venezuela, Caracas, for kindly supplying Venezuelan gasoline samples, Petrobras for supplying the Brazilian gasoline samples, FAPESP (São Paulo Research Foundation), FAPEMIG (Minas Gerais Research Foundation) and CNPq (National Council for Scientific and Technological Development) for financial support and fellowships.
References
1. Vorob’eva, N. S.; Petrov, A. A.; Pet. Chem. 2003, 43, 1. 2. Skrobot, V. L.; Castro, E. V. R.; Pereira, R. C. C.; Pasa, V. W. D.;
Fortes, I. C. P.; Energy Fuels 2005, 19, 2350.
3. Pedroso, M. P.; de Godoy, L. A. F.; Ferreira, E. C.; Poppi, R. J.; Augusto, F.; J. Chromatogr., A 2008, 1201, 176.
4. Phillips, J. B.; Liu, Z.; J. Chromatogr. Sci. 1991, 29, 227. 5. Edwards, M.; Mostafa, A.; Górecki, T.; Anal. Bioanal. Chem.
2011, 401, 2335.
6. Dallüge, J.; Beens, J.; Brinkman, U. A. T.; J. Chromatogr., A
2003, 69, 1000.
7. Seeley, J. V.; Bates, C. T.; McCurry, J. D.; Seeley, S. K.;
J. Chromatogr., A 2012, 1226, 103.
8. Parastar, H.; Radović, J. R.; Jalali-Heravi, M.; Diez, S.; Bayona, J. M.; Tauler, R.; Anal. Chem. 2011, 83, 9289.
9. van der Westthuizen, R.; Ajam, M. de Coning, P.; Beens, J.; de Villiers, A.; Sandra, P.; J. Chromatogr., A 2011, 1218, 4478. 10. de Godoy, L. A. F.; Pedroso, M. P.; Ferreira, E. C.; Augusto, F.;
Poppi, R. J.; J. Chromatogr., A 2011, 1218, 1663.
11. Frysinger, G. S.; Gaines, R. B.; HRC J. High Resolut. Chromatogr. 2000, 23, 197.
12. Blomberg, J.; Schoenmakers, P. J.; Brinkman, U. A. Th.;
J. Chromatogr., A 2002, 972, 39.
13. Frysinger, G. S.; Gaines, R. B.; Ledford, E. B.; J. High Resolut. Chromatogr. 1999, 22, 195.
14. van Stee, L. L. P.; Beens, J.; Vreuls, R. J. J.; Brinkman, U. A. Th.; J. Chromatogr., A 2003, 1019, 89.
15. Gaines, R. B.; Frysinger, F. S; Environ. Sci. Technol. 1999, 33, 2106.
16. Gaines, R. B.; Ledford Jr., E. B.; Stuart, J. D.; J. Microcolumn. Sep. 1998, 10, 597.
17. de Godoy, L. A. F.; Ferreira, E. C.; Pedroso, M. P.; Fidélis, C. H. V.; Augusto, F.; Poppi, R. J.; Anal. Lett. 2008, 41, 1603. 18. Brukner, C. A.; Prazen, B. J.; Synovec, R. E.; Anal. Chem. 1998,
70, 2796.
19. Braga, C. G.; Prazen, B. J.; Synovec, R. E.; Anal. Chem. 2000,
72, 4154.
20. van de Weghe, H.; Vanermen, G.; Gemoets, J.; Lookman, R.; Bertels, D.; J. Chromatogr., A 2006, 1137, 91.
21. Nelson, P. K.; Kile, B. M.; Plata, D. L.; Sylva, S. P.; Reddy, C. M.; Gaines, R. B.; Frysinger, F. S.; Reichenbach, S. E.;
Environ. Forensics 2006, 7, 33.
22. ASTM D2425-04: Standard Test Method for Hydrocarbon Types in Middle Distillates by Mass Spectrometry, USA, 2009. 23. von Muhlen, C.; Zini, C. A.; Camarão, E. B.; Marriott, P. J.;
J. Chromatogr., A 2006, 1105, 39.
24. Pedroso, M. P.; Ferreira, E. C.; Hantao, L. W.; Bogusz Jr., S.; Augusto, F.; J. Sep. Sci. 2011, 34, 1547.
25. van Mispelaar, V. G.; Janssen, H. G.; Tas, A. C.; Schoenmakers, P. J.; J. Chromatogr., A 2005, 1071, 229.
26. Johnson, K. J.; Synovec, R. E.; Chemom. Intell. Lab. Syst. 2002,
60, 225.
28. Bro, R.; Chemom. Intell. Lab. Syst. 1997, 38, 149.
29. Sena, M. M.; Trevisan, M. G.; Poppi, R. J.; Quim. Nova 2005,
28, 910.
30. Trevisan, M. G.; Poppi, R. J.; Anal. Chim. Acta 2003, 493, 69.
31. de Godoy, L. A. F.; Hantao, L. W.; Pedroso, M. P.; Poppi, R. J.; Augusto, F.; Anal. Chim. Acta 2011, 699, 120.
Submitted: September 12, 2012 Published online: April 3, 2013