Algae in Fish Feed: Performances and Fatty
Acid Metabolism in Juvenile Atlantic Salmon
Fernando Norambuena1*, Karen Hermon1, Vanessa Skrzypczyk1, James A. Emery1, Yoni Sharon2, Alastair Beard2, Giovanni M. Turchini1
1School of Life and Environmental Sciences, Deakin University, Warrnambool, Victoria, Australia,2MBD Energy ltd. Melbroune, Victoria, Australia
Abstract
Algae are at the base of the aquatic food chain, producing the food resources that fish are adapted to consume. Previous studies have proven that the inclusion of small amounts (<10% of the diet) of algae in fish feed (aquafeed) resulted in positive effects in growth per-formance and feed utilisation efficiency. Marine algae have also been shown to possess functional activities, helping in the mediation of lipid metabolism, and therefore are increas-ingly studied in human and animal nutrition. The aim of this study was to assess the poten-tials of two commercially available algae derived products (dry algae meal), Verdemin (derived fromUlva ohnoi) and Rosamin (derived from diatomEntomoneisspp.) for their
pos-sible inclusion into diet of Atlantic Salmon (Salmo salar). Fish performances, feed efficiency,
lipid metabolism and final product quality were assessed to investigated the potential of the two algae products (in isolation at two inclusion levels, 2.5% and 5%, or in combination), in experimental diets specifically formulated with low fish meal and fish oil content. The results indicate that inclusion of algae product Verdemin and Rosamin at level of 2.5 and 5.0% did not cause any major positive, nor negative, effect in Atlantic Salmon growth and feed effi-ciency. An increase in the omega-3 long-chain polyunsaturated fatty acid (n-3 LC-PUFA) content in whole body of fish fed 5% Rosamin was observed.
Introduction
Fish meal and fish oil are abundantly used in fish feed (aquafeed) largely due to their respective content of high-quality proteins and beneficial omega-3 long chain polyunsaturated fatty acid (n-3 LC-PUFA). A global survey estimated aquaculture consumption of fish meal and fish oil at above 4,000 and 800 thousand tonnes/year, equating to 68.2% and 88.5% of the yearly global supply, respectively [1]. However, because of their limited supply and raising prices, alternative raw materials are increasingly being used in aquafeed formulation. A critical shortcoming of the crop-plant derived protein sources commonly used in aquafeed is that they have low digest-ibility and are deficient in certain essential amino acids such as lysine, methionine, threonine and tryptophan [2]; whereas for terrestrial oils the major limit is their lack of omega-3 long chain polyunsaturated fatty acid (n-3 LC-PUFA) [3]. Therefore it is important to find OPEN ACCESS
Citation:Norambuena F, Hermon K, Skrzypczyk V, Emery JA, Sharon Y, Beard A, et al. (2015) Algae in Fish Feed: Performances and Fatty Acid Metabolism in Juvenile Atlantic Salmon. PLoS ONE 10(4): e0124042. doi:10.1371/journal.pone.0124042
Academic Editor:David William Pond, Scottish Association for Marine Science, UNITED KINGDOM
Received:October 30, 2014
Accepted:March 10, 2015
Published:April 15, 2015
Copyright:© 2015 Norambuena et al. This is an open access article distributed under the terms of the
Creative Commons Attribution License, which permits unrestricted use, distribution, and reproduction in any medium, provided the original author and source are credited.
Data Availability Statement:All relevant data are within the paper.
economical and sustainable alternative sources of proteins and lipids [4], and algae-derived products may be one possible alternative feedstuff, because of their nutritional quality and potential availability.
Analysis of amino acid content of numerous algae have found that although there is signifi-cant variation in total protein content (8–50% dry weight) [5], they generally contain all the es-sential amino acids [5–8]; and studied algae have also been found to be rich in n-3 LC-PUFA; essentially algae derived products seem to be a very suitable raw material for use in aquafeed [9]. Algae are at the base of the aquatic food chain that produce the food resources that fish are adapted to consume. Accordingly, since the‘70s, the first pioneering studies focusing on the potential use of algae in aquafeed were published [10]. However, more recently, increasingly more studies have been carried out on the use of algae as a possible ingredient for aquafeed for different fish species [11–20].
Several studies have proven that small amounts (2.5–10% of the diet) of algae in fish diets resulted in positive effects, including: increase in growth performance, feed utilisation efficien-cy, carcass quality, physiological activity, intestinal micro biota (Valente et al 2006, Mustafa and Nakagawa, 1995), disease resistance [21], improved stress response [22], modulation of the lipid metabolism [12,23], and improved protein retention during the winter period of reduced feed intake [24], and increase palatability in sea urchin formulated feed [25]. Algae meal has been also recommended as a good feed complement for counteracting intestinal inflammation produced by soybean meal [20], and as a useful binding agent for aquafeed pelletisation [19].
Nonetheless, it has also been noted that the use of algae in aquafeed at a high inclusion level might have a negative effect on fish growth and feed efficiency. Previous studies in rainbow trout (Oncorhynchus mykiss) showed a reduction in growth and feed utilisation in fish feed with 10% ofUlvaspp. and similar results were found in black sea bream (Acanthopagrus schle-geli) [12] and gilthead sea bream (Sparus aurata) [22] fed diets containing 15% ulva meal, and in common carp (Cyprinus carpio) [15] and Nile tilapia (Oreochromis niloticus) fed with diets containing 20% algae meal (Ulva rigida) [26]. These results could be due to certain substances with anti-nutritional activity which may be present in algae, like lectins, tannins, phytic acid, and protease and amylase inhibitors [27].
From the literature available, it can be deduced that the response to algae inclusion into feed is dose-dependent and species-specific [16]. In mammals, it has been shown that marine algae, and particularlyUlvaspp. [28], have potential beneficial effects as dietary antioxidants [29,30], and because of their bioactive properties. Specifically, functional properties of algae polysac-charides [5] and fucoxanthin (a marine carotenoid present in brown algae and diatoms) [31,32] have been shown to be important mediators in lipid metabolism [32–34], and are in-creasingly studied in human and animal nutrition. Thus, because of this series of potential highly bioactive compounds, algae derived products could be considered as a very valuable/ useful“micro-ingredient”for aquafeed fortification, when used at a low inclusion level.
The aim of this study was to assess the potentials of two commercially available algae de-rived products, and specifically a green algae (Verdemin, dede-rived from macro algaeUlva ohnoi) and a diatom, (Rosamin, derived from diatomEntomoneisspp.) for their possible inclu-sion into diet of Atlantic Salmon (Salmo salar). Fish performances, feed efficiency, lipid metab-olism and final product quality were assessed to investigate the potential of the two algae products, which were tested in solely at two inclusion levels (2.5% and 5%), or in combination, in experimental diets specifically formulated (with low fish meal content) for juvenile Salmon.
Materials and Methods
Fish husbandry and experimental diets
All procedures implemented during this experiment were approved by the Deakin University Animal Ethics Committee (AEC ref B16-2013). Atlantic Salmon (Salmo salar) were sourced from a private aquaculture farm (Mountain Fresh Trout and Salmon Farm, Harrietville, VIC, Australia). After transport, fish were acclimatised to experimental conditions at Deakin Uni-versity (Warrnambool, VIC, Australia) and fed on a commercial diet (Ridley Aquafeed, Aus-tralia) for two weeks. At the start of the experiment, 10 fish were euthanized with an overdose of anaesthetic (AQUI-S, New Zealand), weighed and stored at -20°C, until analysis.
Five hundred and forty fish (body weight ~33.7 g) were anaesthetised, weighed and then randomly distributed into 18 tanks (30 fish per tank) of 1000 L fresh water capacity, within a fully controlled multi-tank recirculation system (RAS), and three tanks were randomly as-signed to each of the six dietary treatments. Fish were held at 12°C, under 12:12 light: dark cycle, and total ammonia and nitrite levels were regularly monitored using Aquamerck test kits (Merck, Germany) and were maintained within optimal levels. Fish were fed the respective ex-perimental diet twice daily to apparent satiation for 84 days. Then, after a 24 h gut evacuation period, all fish were anaesthetised and weighed. A final sample of 6 fish per tank (18 per treat-ment) was randomly collected and euthanised, and samples of fillet and liver (3 fish per tank) or the whole body (3 fish per tank) were collected and stored at -20°C, until proximate and fatty acid analysis.
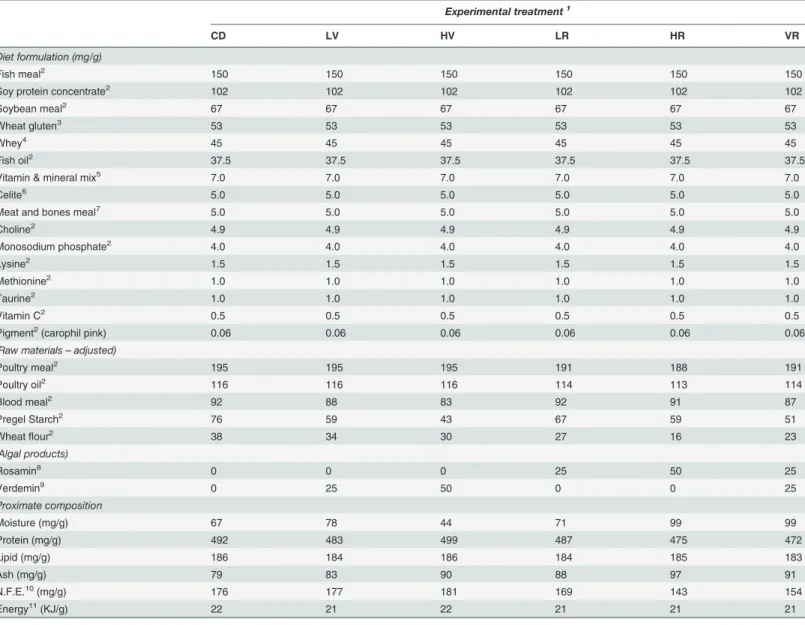
Six iso-proteic, iso-lipidic and iso-energetic experimental diets were formulated to contain 180 mg/g of lipid and 490 mg/g of protein, varying only in in the inclusion of two algal prod-ucts Verdemin (derived fromUlva ohnoi) and Rosamin (derived from diatomEntomoneis spp.) (Table 1). All diets contained the same blend of fish oil (25%) and poultry oil (75%) as the added lipid source, and the same blend of protein sources, including fish meal (15%), soy pro-tein concentrate, gluten, poultry meal, whey and blood meal were used. The diet without any algal inclusion, and with a formulation similar to commercially available Salmon diets, was considered the control diet (CD). In the 5 remaining experimental diets Verdemin and Rosa-min were included solely at two different levels (2.5% or 5%) or in combination, both at 2.5%. Accordingly, the experimental diets were named: LV (Low Verdemin; at 2.5%); HV (High Ver-demin; at 5%); LR (Low Rosamin; at 2.5%); HR (High Rosamin; at 5%); and VR (Verdemein at 2.5% and Rosamin at 2.5%). To compensate for the resulting modification of the overall nutri-tional value of the experimental diets due to algal addition, small and balanced amounts of poultry meal, poultry oil, blood meal, pregelatinised starch and wheat flour were used (Table 1), so that final diets would have been iso-proteic, iso-lipidic and iso-energetic; but the total inclusion of fish meal and fish oil was not modified.
Table 1. Formulation and proximate composition of the diets.
Experimental treatment1
CD LV HV LR HR VR
Diet formulation (mg/g)
Fish meal2 150 150 150 150 150 150
Soy protein concentrate2 102 102 102 102 102 102
Soybean meal2 67 67 67 67 67 67
Wheat gluten3 53 53 53 53 53 53
Whey4 45 45 45 45 45 45
Fish oil2 37.5 37.5 37.5 37.5 37.5 37.5
Vitamin & mineral mix5 7.0 7.0 7.0 7.0 7.0 7.0
Celite6 5.0 5.0 5.0 5.0 5.0 5.0
Meat and bones meal7 5.0 5.0 5.0 5.0 5.0 5.0
Choline2 4.9 4.9 4.9 4.9 4.9 4.9
Monosodium phosphate2 4.0 4.0 4.0 4.0 4.0 4.0
Lysine2 1.5 1.5 1.5 1.5 1.5 1.5
Methionine2 1.0 1.0 1.0 1.0 1.0 1.0
Taurine2 1.0 1.0 1.0 1.0 1.0 1.0
Vitamin C2 0.5 0.5 0.5 0.5 0.5 0.5
Pigment2(carophil pink) 0.06 0.06 0.06 0.06 0.06 0.06
(Raw materials–adjusted)
Poultry meal2 195 195 195 191 188 191
Poultry oil2 116 116 116 114 113 114
Blood meal2 92 88 83 92 91 87
Pregel Starch2 76 59 43 67 59 51
Wheatflour2 38 34 30 27 16 23
(Algal products)
Rosamin8 0 0 0 25 50 25
Verdemin9 0 25 50 0 0 25
Proximate composition
Moisture (mg/g) 67 78 44 71 99 99
Protein (mg/g) 492 483 499 487 475 472
Lipid (mg/g) 186 184 186 184 185 183
Ash (mg/g) 79 83 90 88 97 91
N.F.E.10(mg/g) 176 177 181 169 143 154
Energy11(KJ/g) 22 21 22 21 21 21
1Experimental diet abbreviations: CD (Control Diet), LV (2.5% Verdemin), HV (5.0% Verdemin), LR (2.5% Rosamin), HR (5.0% Rosamin) and VR (2.5%
Verdemin and 2.5% Rosamin).
2Ridley Agriproducts, Narangba, Queensland, Australia. 3Agrifood Ingredients, Kew East, Victoria Australia. 4Warrnambool Cheese and Butter, Victoria, Australia.
5DSM Nutritional Products,WaggaWagga, New SouthWales, Australia. 6Merck KGaA, Darmstadt, Germany.
7The Mid
field Group,Warrnambool, Victoria, Australia.
8Rosamin:Entomoneisspp. dry meal (MBD Energy ltd. Melbroune, Victoria, Australia): Moisture 88.1 mg/g; Protein 190.1 mg/g; Lipid 4.4 mg/g; Ash
221.6 mg/g.
9Verdemin:Ulva ohnoidry meal (MBD Energy ltd. Melbroune, Victoria, Australia): Moisture 22.8 mg/g; Protein 192.3 mg/g; Lipid 93.3 mg/g; Ash 483.0
mg/g.
10N.F.E. = Nitrogen free extract, calculated by difference.
11Calculated on the basis of 23.6, 39.5 and 17.2 kJ/g of protein, fat and carbohydrate, respectively.
Performance parameters and chemical analyses
Standard formulae were used to assess growth and feed utilisation parameters over the experi-mental period, and were computed as previously described [35]; these included initial and final average weight (g), average feed consumption (g fish-1), gain in weight (g and %), food conver-sion ratio (FCR), specific growth rate (SGR, % day-1), feed ratio (% of body weight), dress-out percentage (DP%), fillet yield percentage (FY%), hepatosomatic index (HSI%) and condition factor (K).
The chemical composition of the experimental diets, faeces and fish samples was deter-mined via proximate composition analysis according to standard methods [36]. Lipid was de-termined by dichloromethane:methanol extraction (2:1) technique [37], with the substitution of chloroform with dichloromethane for safety reasons and the addition of butylated hydroxy-toluene (BHT) (50 mg L-1) to reduce lipid oxidation during processing. After lipid extraction, an aliquot was used for fatty acid analysis, which was implemented via trans-methylation and gas chromatography, following the procedures previously described in detail [38].
Nutrient Digestibility and fatty acid metabolism evaluation
During days 53 to 84, faeces were collected from each individual tank using a previously de-scribed method [39]. Nutrients apparent digestibility coefficients were determined by assessing acid insoluble ash (AIA), as specifically adapted to rainbow trout [40], and following standard formulae for digestibility evaluation.
The evaluation of thein vivofatty acid metabolism (fatty acid apparent in vivoβ-oxidation, bioconversion and deposition) was performed using the whole-body fatty acid balance method, as initially proposed and described [41], with further development [42].
Statistical analysis
All data were reported as mean ± standard error (n= 3,N= 18). After confirmation of normal-ity and homogenenormal-ity of variance, data was first subjected to a one-way ANOVA, with signifi-cance accepted atP<0.05. Where significant differences were detected by ANOVA, data was subjected to a Student–Newman–Keuls Post-hoc test for homogenous subsets. All statistical analyses were performed using IBM SPSS Statistics v21.0 (SPSS Inc.,Chicago, IL, USA).
Results
Diets and fish performances
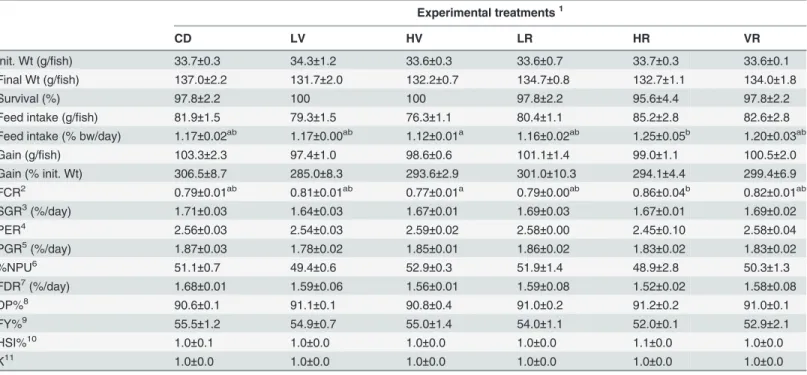
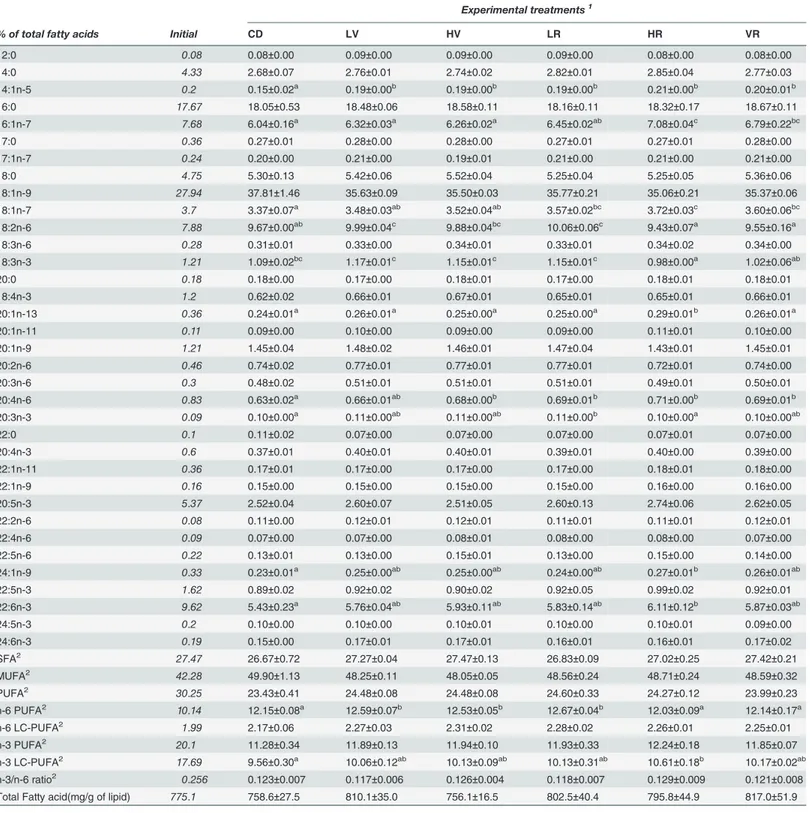
Experimental diets were iso-proteic, iso-lipidic and iso-energetic (Table 1), and their fatty acid composition was almost identical (Table 2). All experimental diets were readily accepted by fish, and overall fish showed optimal growth performances, minimal mortality and good feed conversion (low FCR; varying from 0.77 to 0.86) (Table 3). HR fed fish recorded a significantly higher feed intake compared to HV, but fish feed with HV showed a significantly lower (better) FCR compared to HR. The dietary treatment did not affect any biometrical parameter recorded on fish, including DP, FY, HSI and K (Table 3). With the exception of feed intake and FCR for HR and VR, none of the other performances, nutrient efficiency and biometrical parameters showed any statistically significant difference among dietary treatments.
Table 2. The fatty acid composition (% of total fatty acids) and total fatty acid content (mg/g of lipid) of the six experimental diets and the two tested algal products.
Experimental treatments1 Algal products
% of total fatty acids CD LV HV LR HR VR Verdemin Rosamin
12:00 0.14 0.13 0.07 0.13 0.08 0.08 - 0.33
14:00 2.91 2.9 2.9 3.01 3.18 3.01 - 22.7
14:1n-5 0.26 0.26 0.26 0.26 0.3 0.3 -
-16:00 23.74 23.72 23.76 23.66 25.03 25.15 49.94 17.51
16:1n-7 6.35 6.36 6.37 6.46 7.27 7.17 - 27.99
17:00 0.32 0.32 0.32 0.31 0.32 0.3 -
-17:1n-7 0.18 0.18 0.19 0.18 0.19 0.19 -
-18:00 6.61 6.42 6.4 6.43 6.56 6.56 - 0.47
18:1n-9 36.12 36.19 36.18 36.02 34.67 34.91 9.03 0.91
18:1n-7 2.7 2.69 2.71 2.71 2.81 2.81 10.9 1.25
18:2n-6 10.41 10.51 10.52 10.37 9.41 9.51 7.08 0.95
18:3n-6 0.18 0.18 0.18 0.18 0.18 0.18 - 0.77
18:3n-3 1.46 1.47 1.47 1.45 1.08 1.11 9.77 0.31
20:00 0.22 0.21 0.22 0.23 0.23 0.24 - 0.42
18:4n-3 0.6 0.6 0.61 0.62 0.6 0.59 11.13 0.42
20:1n-13 0.09 0.09 0.09 0.07 0.09 0.09 -
-20:1n-11 0.09 0.09 0.09 0.08 0.11 0.1 -
-20:1n-9 0.54 0.55 0.54 0.53 0.57 0.54 -
-20:2n-6 0.13 0.13 0.13 0.13 0.14 0.13 -
-20:3n-6 0.11 0.12 0.11 0.12 0.07 0.13 - 0.18
20:4n-6 0.38 0.38 0.38 0.4 0.42 0.41 0.43 6.49
20:3n-3 0.03 0.03 0.03 0.03 0.03 0.03 - 0.19
22:00 0.07 0.08 0.08 0.08 0.08 0.08 -
-20:4n-3 0.21 0.21 0.21 0.25 0.23 0.27 -
-22:1n-11 0.12 0.13 0.13 0.13 0.14 0.14 -
-22:1n-9 0.06 0.06 0.06 0.07 0.07 0.07 -
-20:5n-3 3.56 3.56 3.54 3.65 3.69 3.48 1.64 16.74
22:2n-6 -1 - - -
-22:4n-6 0.05 0.05 0.05 0.05 0.06 0.07 - 1.3
22:5n-6 0.06 0.06 0.06 0.06 0.06 0.06 -
-24:1n-9 0.12 0.12 0.12 0.13 0.13 0.12 -
-22:5n-3 0.43 0.44 0.45 0.45 0.45 0.45 -
-22:6n-3 1.73 1.74 1.74 1.75 1.76 1.71 0.07 1.06
24:5n-3 - - -
-24:6n-3 - - -
-SFA2 34.01 33.78 33.76 33.85 35.47 35.42 49.94 41.43
MUFA3 46.64 46.74 46.74 46.64 46.35 46.44 19.93 30.14
PUFA4 19.35 19.49 19.5 19.51 18.17 18.14 30.13 28.4
n-6 PUFA5 11.33 11.43 11.44 11.31 10.34 10.5 7.51 9.69
n-6 LC-PUFA6 0.73 0.74 0.74 0.77 0.75 0.8 0.43 7.97
n-3 PUFA7 8.03 8.06 8.06 8.19 7.84 7.65 22.62 18.7
n-3 LC-PUFA8 5.97 5.98 5.98 6.13 6.15 5.95 1.71 17.98
n-3/n-6 ratio9 0.094 0.094 0.097 0.10 0.10 0.73 3.01 1.93
Total Fatty acids10(mg/g) 755.8 746.2 728.8 727.6 740.6 721.6 801 817.5
1abbreviation as inTable 1. 2- = not detected.
3SFA = Saturated fatty acids.
4MUFA = monounsaturated fatty acids. 5PUFA = polyunsaturated fatty acids.
6n-6 PUFA = omega-6 polyunsaturated fatty acids.
7n-6 LC-PUFA = long chain omega-6 polyunsaturated fatty acids. 8n-3 PUFA = omega-3 polyunsaturated fatty acids.
9n-3 LC-PUFA = long chain omega-3 polyunsaturated fatty acids. 10n-3/n-6 ratio = ratio of n-3 PUFA/n-6 PUFA.
Nutrients digestibility
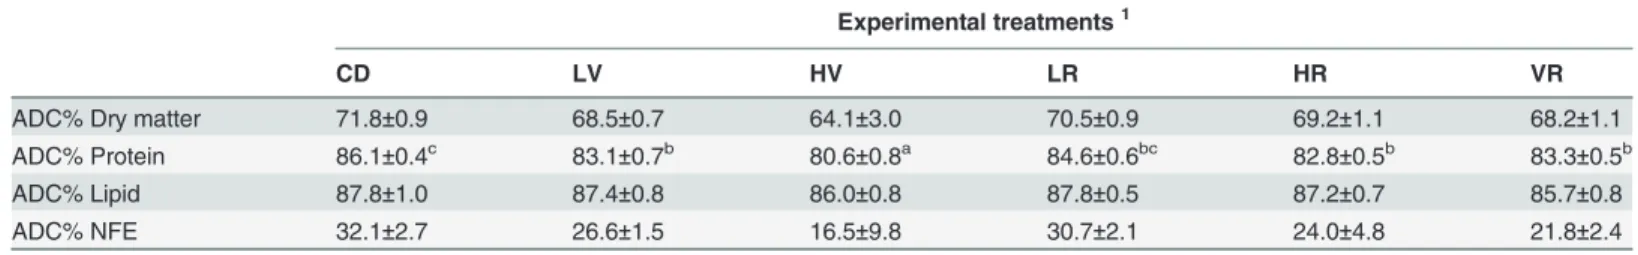
Nutrients apparent digestibility was significantly affected by dietary algal inclusion (Table 5). Specifically, the protein apparent digestibility coefficient (ADC%) was lower in high Verdemin inclusion (HV) compared to all other treatments. A similar trend was observed in dry matter digestibility with the lowest value recorded in HV, however this was not significant.
Several statistically significant differences were observed for digestibility of individual fatty acid (Table 6). Summarising the majority of the observed differences, it can be noted that the three treatments containing up to 5% of algal product (HV, HR and VR) resulted in lower fatty acid digestibility, compared to the other three treatments. CD, generally was responsible for the highest individual fatty acid digestibility, with the exception of n-6 LC-PUFA which were more efficiently digested in fish fed LR. The inclusion of 5% Verdemin (HV) resulted in re-duced digestibility of 20:5n-3 (EPA) and 22:6n-3 (DHA).
Table 3. Fish performances and feed efficiency in Atlantic Salmon fed the six experimental diets during the in vivo feeding trial.
Experimental treatments1
CD LV HV LR HR VR
Init. Wt (g/fish) 33.7±0.3 34.3±1.2 33.6±0.3 33.6±0.7 33.7±0.3 33.6±0.1
Final Wt (g/fish) 137.0±2.2 131.7±2.0 132.2±0.7 134.7±0.8 132.7±1.1 134.0±1.8
Survival (%) 97.8±2.2 100 100 97.8±2.2 95.6±4.4 97.8±2.2
Feed intake (g/fish) 81.9±1.5 79.3±1.5 76.3±1.1 80.4±1.1 85.2±2.8 82.6±2.8
Feed intake (% bw/day) 1.17±0.02ab 1.17±0.00ab 1.12±0.01a 1.16±0.02ab 1.25±0.05b 1.20±0.03ab
Gain (g/fish) 103.3±2.3 97.4±1.0 98.6±0.6 101.1±1.4 99.0±1.1 100.5±2.0
Gain (% init. Wt) 306.5±8.7 285.0±8.3 293.6±2.9 301.0±10.3 294.1±4.4 299.4±6.9 FCR2 0.79±0.01ab 0.81±0.01ab 0.77±0.01a 0.79±0.00ab 0.86±0.04b 0.82±0.01ab
SGR3(%/day) 1.71±0.03 1.64±0.03 1.67±0.01 1.69±0.03 1.67±0.01 1.69±0.02
PER4 2.56±0.03 2.54±0.03 2.59±0.02 2.58±0.00 2.45±0.10 2.58±0.04
PGR5(%/day) 1.87±0.03 1.78±0.02 1.85±0.01 1.86±0.02 1.83±0.02 1.83±0.02
%NPU6 51.1±0.7 49.4±0.6 52.9±0.3 51.9±1.4 48.9±2.8 50.3±1.3
FDR7(%/day) 1.68±0.01 1.59±0.06 1.56±0.01 1.59±0.08 1.52±0.02 1.58±0.08
DP%8 90.6±0.1 91.1±0.1 90.8±0.4 91.0±0.2 91.2±0.2 91.0±0.1
FY%9 55.5±1.2 54.9±0.7 55.0±1.4 54.0±1.1 52.0±0.1 52.9±2.1
HSI%10 1.0±0.1 1.0±0.0 1.0±0.0 1.0±0.0 1.1±0.0 1.0±0.0
K11 1.0±0.0 1.0±0.0 1.0±0.0 1.0±0.0 1.0±0.0 1.0±0.0
Data are expressed as mean±S.E.M., n = 3; N = 18. Values in the same row with different letters (a, b, c) are significantly different (P<0.05; ANOVA and Student–Newman–Keuls post hoc test).
1abbreviation as inTable 1. 2FCR = food conversion ratio. 3SGR = speci
fic growth rate.
4PER = protein ef
ficiency ratio.
5PGR = protein growth rate. 6%NPU = net protein utilisation. 7FRD = fat deposition rate. 8DP% = dress-out percentage. 9FY% = Fillet yield percentage. 10HSI% = Hepato-Somatic index. 11K = Fulton
’s condition factor.
Fatty acid composition
A series of statistically significant differences were recorded for fatty acid composition of fish tissues (whole body and fillet;Table 7andTable 8, respectively), and overall similar trends and/or differences relative to dietary treatments were observed in both tissues. Fish fed diets containing Rosamin (LR and HR) recorded a significantly lower level of 16:0, in respect to fish on CD. This also resulted in significantly lower total SFA content in the whole body. Some sig-nificant differences were also recorded for a few MUFA, such as 14:1n-5, 16:1n-7 and 18:1n-7, with fish receiving diets containing Rosamin, in isolation at both inclusion levels (LR and HR), and also in combination with Verdemin (VR), generally showing higher levels of these fatty acids, compared to other treatments. Linoleic acid (18:2n-6) and alpha-linolenic acid (18:3n-3) were also affected by dietary treatments, with lower levels of both being recorded in fish fed HR and VR, compared to other treatments. This resulted in lower n-6 PUFA content in the fillets of fish fed HR and VR.
Amongst n-3 LC-PUFA, significant differences among dietary algal level were also ob-served. The fatty acid 20:3n-3 was significantly affected by diets, with lower levels recorded in
Table 4. The proximate composition (mg/g) of fillets and whole bodies of Atlantic Salmon at commencement and the completion of the in vivo feeding trial.
Experimental treatments1
initial CD LV HV LR HR VR
Fillet
Moisture 750.7±6.3 729.4±2.5 726.6±5.0 729.4±1.5 723.6±4.2 729.3±1.6 730.7±4.4 Protein 201.8±5.2 216.5±2.6 214.1±3.4 216.4±0.9 220.5±2.8 217.6±1.0 212.3±3.2
Lipid 34.1±2.2 40.5±3.6 46.1±1.3 41.4±2.6 42.3±2.3 39.4±0.7 43.6±3.1
Ash 13.4±0.4 13.6±0.3 13.2±0.7 12.7±0.4 13.6±0.7 13.7±0.2 13.5±0.3
Whole body
Moisture 715.3±1.8 700.0±0.9 705.4±1.9 702.5±1.7 703.8±1.2 709.0±4.3 708.6±3.9 Protein 168.1±3.9 191.6±1.1 187.6±1.8 194.9±0.6 192.7±3.8 191.1±2.9 188.4±2.0
Lipid 93.1±2.1 90.9±1.8 89.6±3.2 85.3±1.4 86.0±3.9 82.4±1.2 85.4±5.2
Ash 23.4±0.5 17.4±0.5 17.5±0.6 17.3±0.3 17.5±0.7 17.6±0.2 17.6±0.6
Initialfish not included in statistical analysis. Data are expressed as mean±S.E.M., n = 3; N = 18, no statistically significant differences between treatments for any parameter were observed by ANOVA.
1abbreviation as inTable 1.
doi:10.1371/journal.pone.0124042.t004
Table 5. The nutrients apparent digestibility coefficients (ADC%) in fish fed the six experimental diets.
Experimental treatments1
CD LV HV LR HR VR
ADC% Dry matter 71.8±0.9 68.5±0.7 64.1±3.0 70.5±0.9 69.2±1.1 68.2±1.1
ADC% Protein 86.1±0.4c 83.1±0.7b 80.6±0.8a 84.6±0.6bc 82.8±0.5b 83.3±0.5b
ADC% Lipid 87.8±1.0 87.4±0.8 86.0±0.8 87.8±0.5 87.2±0.7 85.7±0.8
ADC% NFE 32.1±2.7 26.6±1.5 16.5±9.8 30.7±2.1 24.0±4.8 21.8±2.4
Data are expressed as mean±S.E.M., n = 3; N = 18. Values in the same row with different letters (a, b, c) are significantly different (P<0.05; ANOVA and Student–Newman–Keuls post hoc test).
1abbreviation as inTable 1.
Table 6. The individual fatty acid and fatty acid classes apparent digestibility coefficients (ADC%) in fish fed the six experimental diets.
Experimental treatments1
ADC (%) CD LV HV LR HR VR
12:0 90.2±2.9ab 91.1±3.6ab 74.5±7.6a 93.8±1.3b 90.2±0.8ab 90.0±0.3ab
14:0 86.7±1.4 84.4±0.9 85.3±2.2 84.3±0.8 85.9±0.7 83.2±1.1
14:1n-5 95.1±0.5 95.1±0.3 93.7±0.7 94.3±0.5 94.9±0.1 94.3±0.4
16:0 78.5±2.3 76.8±1.5 74.7±1.5 77.0±1.3 78.1±1.3 74.6±1.8
16:1n-7 96.6±0.2 96.8±0.1 95.9±0.3 96.8±0.1 96.3±0.1 96.0±0.1
17:0 77.3±2.1 74.4±1.1 71.1±1.8 72.3±2.0 77.1±2.0 70.5±2.3
17:1n-7 95.1±0.1 94.7±0.6 93.9±0.3 94.3±0.3 94.1±0.3 94.6±0.6
18:0 71.1±3.4 70.2±2.1 67.5±1.6 71.3±1.9 73.6±2.1 68.0±2.4
18:1n-9 94.8±0.3 95.1±0.2 94.3±0.5 95.1±0.2 94.1±0.3 93.8±0.1
18:1n-7 93.4±0.4 93.2±0.2 91.9±0.7 93.3±0.2 92.2±0.3 91.8±0.2
18:2n-6 96.6±0.2ab 96.8±0.1b 95.9±0.3a 96.8±0.1b 96.1±0.2ab 95.9±0.0a
18:3n-6 95.2±0.2 95.1±0.3 93.5±1.2 94.9±0.3 94.2±0.1 94.1±0.1
18:3n-3 97.2±0.2b 97.3±0.1b 96.4±0.2a 97.2±0.2b 96.4±0.2a 96.1±0.2a
20:0 78.3±2.8 75.1±1.7 72.5±1.3 78.4±1.7 77.3±1.2 74.7±1.9
18:4n-3 98.9±0.0bc 98.9±0.1bc 98.1±0.1a 99.1±0.1c 99.0±0.1c 98.6±0.0b
20:1n-13 99.1±0.9b 99.0±1.0b 98.1±1.9b 100 91.9±0.9a 89.8±1.7a
20:1n-11 93.6±0.7 87.9±6.4 96.8±1.7 93.5±0.1 95.6±2.2 93.8±0.5
20:1n-9 91.7±0.6 90.9±1.2 92.1±0.9 91.9±0.2 93.6±2.3 90.0±0.5
20:2n-6 82.3±1.3 81.7±1.4 77.9±1.1 83.0±1.1 83.1±0.7 77.6±2.0
20:3n-6 83.6±1.6 81.4±3.2 80.1±1.0 88.6±3.7 79.3±2.9 83.7±3.9
20:4n-6 96.3±0.2bc 96.2±0.1bc 94.8±0.4a 96.5±0.1c 96.1±0.2bc 95.5±0.1b
20:3n-3 1002 100 100 100 100 100
22:0 60.6±4.4 54.4±3.7 47.2±2.3 59.1±3.8 60.7±1.4 51.2±3.6
20:4n-3 95.7±0.6 94.3±1.4 95.3±0.7 96.9±0.3 95.6±0.5 94.7±0.3
22:1n-11 89.1±0.8ab 88.8±0.8ab 87.1±0.9a 90.4±0.2b 89.1±0.5ab 87.8±0.2ab
22:1n-9 81.0±1.2ab 78.9±1.6ab 76.5±1.0a 83.4±0.8b 81.8±0.6b 79.3±1.4ab
20:5n-3 98.4±0.1c 98.5±0.0c 97.7±0.2a 98.5±0.0c 98.2±0.1bc 98.0±0.0ab
22:2n-6 n.d.3 n.d. n.d. n.d. n.d. n.d.
22:4n-6 96.3±3.7 96.3±1.9 89.0±2.6 97.5±2.5 90.4±0.4 90.5±0.4
22:5n-6 98.9±1.1 100 100 100 98.1±1.9 100
24:1n-9 76.7±2.0b 72.6±1.8ab 67.4±1.3a 72.1±2.1ab 74.1±0.6ab 67.0±2.1a
22:5n-3 97.6±0.1b 97.7±0.0b 96.7±0.3a 97.6±0.2b 97.3±0.2b 97.0±0.1ab
22:6n-3 96.8±0.2b 96.8±0.1b 95.6±0.4a 97.0±0.0b 96.8±0.1b 96.3±0.1b
24:5n-3 n.d. n.d. n.d. n.d. n.d. n.d.
24:6n-3 n.d. n.d. n.d. n.d. n.d. n.d.
SFA4 77.8±2.4 76.2±1.6 74.2±1.4 76.5±1.4 77.9±1.4 74.0±1.8
MUFA4 94.9±0.3 95.1±0.2 94.2±0.4 95.1±0.2 94.2±0.3 93.8±0.1
PUFA4 96.9±0.2b 97.0±0.1b 96.0±0.3a 97.1±0.1b 96.5±0.2ab 96.2±0.0a
n-6 PUFA4 96.3±0.2b 96.5±0.1b 95.4±0.3a 96.5±0.1b 95.8±0.2ab 95.4±0.1a
n-6 LC-PUFA4 92.0±0.9ab 91.5±0.6ab 89.5±0.5a 93.3±0.6b 92.0±0.4ab 90.6±1.0ab
n-3 PUFA4 97.7±0.1c 97.8±0.1c 96.9±0.2a 97.9±0.1c 97.5±0.1bc 97.2±0.0ab
n-3 LC-PUFA4 97.8±0.1c 97.8±0.1c 96.9±0.2a 97.9±0.0c 97.6±0.1bc 97.2±0.0ab
Total Fatty Acids 89.5±1.0 89.1±0.6 87.8±0.7 89.2±0.4 88.9±0.5 87.3±0.7
Data are expressed as mean±S.E.M., n = 3; N = 18. Values in the same row with different letters (a, b, c) are significantly different (P<0.05; ANOVA and Student–Newman–Keuls post hoc test).
1abbreviation as inTable 1.
2ADC% = 100%, it means that the fatty acid was not detected in the faeces. 3ADC% = n.d., it means that the fatty acid was not detected in the feed. 4abbreviation as inTable 2.
Table 7. The fatty acid composition (% of total fatty acids) and total fatty acid content (mg/g of lipid) of the whole body of Atlantic Salmon at com-mencement and the completion of the in vivo feeding trial (initial fish not included in statistical analysis; seeTable 3for fatty acid classes’ nomenclature).
Experimental treatments1
% of total fatty acids Initial CD LV HV LR HR VR
12:0 0.08 0.08±0.00 0.09±0.00 0.09±0.00 0.09±0.00 0.08±0.00 0.08±0.00 14:0 4.33 2.68±0.07 2.76±0.01 2.74±0.02 2.82±0.01 2.85±0.04 2.77±0.03 14:1n-5 0.2 0.15±0.02a 0.19±0.00b 0.19±0.00b 0.19±0.00b 0.21±0.00b 0.20±0.01b
16:0 17.67 18.05±0.53 18.48±0.06 18.58±0.11 18.16±0.11 18.32±0.17 18.67±0.11 16:1n-7 7.68 6.04±0.16a 6.32±0.03a 6.26±0.02a 6.45±0.02ab 7.08±0.04c 6.79±0.22bc
17:0 0.36 0.27±0.01 0.28±0.00 0.28±0.00 0.27±0.01 0.27±0.01 0.28±0.00 17:1n-7 0.24 0.20±0.00 0.21±0.00 0.19±0.01 0.21±0.00 0.21±0.00 0.21±0.00
18:0 4.75 5.30±0.13 5.42±0.06 5.52±0.04 5.25±0.04 5.25±0.05 5.36±0.06 18:1n-9 27.94 37.81±1.46 35.63±0.09 35.50±0.03 35.77±0.21 35.06±0.21 35.37±0.06 18:1n-7 3.7 3.37±0.07a 3.48±0.03ab 3.52±0.04ab 3.57±0.02bc 3.72±0.03c 3.60±0.06bc
18:2n-6 7.88 9.67±0.00ab 9.99±0.04c 9.88±0.04bc 10.06±0.06c 9.43±0.07a 9.55±0.16a
18:3n-6 0.28 0.31±0.01 0.33±0.00 0.34±0.01 0.33±0.01 0.34±0.02 0.34±0.00 18:3n-3 1.21 1.09±0.02bc 1.17±0.01c 1.15±0.01c 1.15±0.01c 0.98±0.00a 1.02±0.06ab
20:0 0.18 0.18±0.00 0.17±0.00 0.18±0.01 0.17±0.00 0.18±0.01 0.18±0.01 18:4n-3 1.2 0.62±0.02 0.66±0.01 0.67±0.01 0.65±0.01 0.65±0.01 0.66±0.01
20:1n-13 0.36 0.24±0.01a 0.26±0.01a 0.25±0.00a 0.25±0.00a 0.29±0.01b 0.26±0.01a
20:1n-11 0.11 0.09±0.00 0.10±0.00 0.09±0.00 0.09±0.00 0.11±0.01 0.10±0.00 20:1n-9 1.21 1.45±0.04 1.48±0.02 1.46±0.01 1.47±0.04 1.43±0.01 1.45±0.01 20:2n-6 0.46 0.74±0.02 0.77±0.01 0.77±0.01 0.77±0.01 0.72±0.01 0.74±0.00
20:3n-6 0.3 0.48±0.02 0.51±0.01 0.51±0.01 0.51±0.01 0.49±0.01 0.50±0.01 20:4n-6 0.83 0.63±0.02a 0.66±0.01ab 0.68±0.00b 0.69±0.01b 0.71±0.00b 0.69±0.01b
20:3n-3 0.09 0.10±0.00a 0.11±0.00ab 0.11±0.00ab 0.11±0.00b 0.10±0.00a 0.10±0.00ab
22:0 0.1 0.11±0.02 0.07±0.00 0.07±0.00 0.07±0.00 0.07±0.01 0.07±0.00
20:4n-3 0.6 0.37±0.01 0.40±0.01 0.40±0.01 0.39±0.01 0.40±0.00 0.39±0.00 22:1n-11 0.36 0.17±0.01 0.17±0.00 0.17±0.00 0.17±0.00 0.18±0.01 0.18±0.00 22:1n-9 0.16 0.15±0.00 0.15±0.00 0.15±0.00 0.15±0.00 0.16±0.00 0.16±0.00 20:5n-3 5.37 2.52±0.04 2.60±0.07 2.51±0.05 2.60±0.13 2.74±0.06 2.62±0.05
22:2n-6 0.08 0.11±0.00 0.12±0.01 0.12±0.01 0.11±0.01 0.11±0.01 0.12±0.01 22:4n-6 0.09 0.07±0.00 0.07±0.00 0.08±0.01 0.08±0.00 0.08±0.00 0.07±0.00 22:5n-6 0.22 0.13±0.01 0.13±0.00 0.15±0.01 0.13±0.00 0.15±0.00 0.14±0.00 24:1n-9 0.33 0.23±0.01a 0.25±0.00ab 0.25±0.00ab 0.24±0.00ab 0.27±0.01b 0.26±0.01ab
22:5n-3 1.62 0.89±0.02 0.92±0.02 0.90±0.02 0.92±0.05 0.99±0.02 0.92±0.01 22:6n-3 9.62 5.43±0.23a 5.76±0.04ab 5.93±0.11ab 5.83±0.14ab 6.11±0.12b 5.87±0.03ab
24:5n-3 0.2 0.10±0.00 0.10±0.00 0.10±0.01 0.10±0.00 0.10±0.01 0.09±0.00 24:6n-3 0.19 0.15±0.00 0.17±0.01 0.17±0.01 0.16±0.01 0.16±0.01 0.17±0.02
SFA2
27.47 26.67±0.72 27.27±0.04 27.47±0.13 26.83±0.09 27.02±0.25 27.42±0.21 MUFA2 42.28 49.90±1.13 48.25±0.11 48.05±0.05 48.56±0.24 48.71±0.24 48.59±0.32
PUFA2 30.25 23.43±0.41 24.48±0.08 24.48±0.08 24.60±0.33 24.27±0.12 23.99±0.23
n-6 PUFA2 10.14 12.15±0.08a 12.59±0.07b 12.53±0.05b 12.67±0.04b 12.03±0.09a 12.14±0.17a
n-6 LC-PUFA2
1.99 2.17±0.06 2.27±0.03 2.31±0.02 2.28±0.02 2.26±0.01 2.25±0.01
n-3 PUFA2 20.1 11.28±0.34 11.89±0.13 11.94±0.10 11.93±0.33 12.24±0.18 11.85±0.07
n-3 LC-PUFA2 17.69 9.56±0.30a 10.06±0.12ab 10.13±0.09ab 10.13±0.31ab 10.61±0.18b 10.17±0.02ab
n-3/n-6 ratio2 0.256 0.123±0.007 0.117±0.006 0.126±0.004 0.118±0.007 0.129±0.009 0.121±0.008
Total Fatty acid(mg/g of lipid) 775.1 758.6±27.5 810.1±35.0 756.1±16.5 802.5±40.4 795.8±44.9 817.0±51.9
Initialfish not included in statistical analysis. Data are expressed as mean±S.E.M., n = 3; N = 18. Values in the same row with different letters (a, b, c) are significantly different (P<0.05; ANOVA and Student–Newman–Keuls post hoc test).
1abbreviation as inTable 1. 2abbreviation as inTable 2.
Table 8. The fatty acid composition (% of total fatty acids) and total fatty acid content (mg/g of lipid) of the fillets of Atlantic Salmon at commence-ment and the completion of the in vivo feeding trial.
Experimental treatments1
% of total fatty acids Initial CD LV HV LR HR VR
12:0 0.08 0.03±0.03 0.09±0.02 0.02±0.02 0.05±0.03 0.03±0.03 0.09±0.05 14:0 3.69 2.39±0.01 2.38±0.02 2.33±0.05 2.43±0.03 2.42±0.03 2.37±0.04 14:1n-5 0.18 0.16±0.00a 0.16±0.00a 0.16±0.00a 0.17±0.00a 0.19±0.00b 0.18±0.00b
16:0 19.05 19.65±0.08b 19.29±0.02ab 19.17±0.10ab 18.88±0.06a 18.93±0.15a 19.47±0.20b
16:1n-7 6.65 5.76±0.05a 5.76±0.03a 5.71±0.07a 5.87±0.06a 6.49±0.01b 6.39±0.04b
17:0 0.36 0.25±0.03 0.28±0.01 0.29±0.00 0.27±0.00 0.27±0.01 0.27±0.01 17:1n-7 0.24 0.18±0.00 0.19±0.02 0.19±0.01 0.18±0.01 0.26±0.07 0.20±0.00 18:0 5.31 5.70±0.07 5.63±0.01 5.64±0.05 5.43±0.04 5.43±0.09 5.59±0.07
18:1n-9 26.55 34.64±0.17 34.70±0.21 34.54±0.28 34.59±0.29 34.12±0.13 34.12±0.05 18:1n-7 3.69 3.56±0.01a 3.56±0.01a 3.57±0.01a 3.61±0.01a 3.81±0.02c 3.72±0.04b
18:2n-6 7.48 9.71±0.03b 9.84±0.08b 9.78±0.08b 9.76±0.07b 9.21±0.08a 9.18±0.01a
18:3n-6 0.23 0.30±0.01 0.32±0.00 0.31±0.00 0.30±0.01 0.30±0.01 0.31±0.01
18:3n-3 1.15 1.11±0.01b 1.13±0.01b 1.14±0.02b 1.13±0.01b 0.93±0.01a 0.93±0.01a
20:0 0.23 0.20±0.01 0.21±0.01 0.26±0.06 0.21±0.01 0.22±0.01 0.20±0.02 18:4n-3 0.97 0.55±0.02 0.58±0.00 0.58±0.00 0.56±0.00 0.55±0.00 0.56±0.00 20:1n-13 0.32 0.25±0.02 0.23±0.00 0.22±0.00 0.25±0.00 0.25±0.01 0.24±0.00
20:1n-11 0.12 0.10±0.01 0.09±0.00 0.09±0.00 0.09±0.00 0.10±0.01 0.10±0.00 20:1n-9 1.13 1.43±0.03 1.40±0.01 1.35±0.01 1.43±0.01 1.34±0.03 1.34±0.01 20:2n-6 0.56 0.95±0.12 0.84±0.02 0.81±0.02 0.86±0.02 0.77±0.03 0.77±0.02 20:3n-6 0.31 0.56±0.00 0.59±0.00 0.59±0.02 0.59±0.02 0.55±0.01 0.57±0.02
20:4n-6 0.83 0.70±0.02 0.70±0.01 0.72±0.03 0.75±0.02 0.76±0.02 0.75±0.01 20:3n-3 0.1 0.13±0.00c 0.12±0.00abc 0.12±0.00bc 0.12±0.00bc 0.11±0.00ab 0.10±0.00a
22:0 0.12 0.08±0.00 0.07±0.00 0.08±0.00 0.07±0.00 0.08±0.01 0.08±0.00 20:4n-3 0.63 0.41±0.00 0.42±0.01 0.43±0.00 0.41±0.02 0.42±0.01 0.42±0.03
22:1n-11 0.28 0.11±0.02 0.15±0.00 0.15±0.01 0.15±0.01 0.15±0.00 0.15±0.01 22:1n-9 0.16 0.14±0.00 0.15±0.00 0.16±0.01 0.15±0.01 0.15±0.00 0.15±0.01 20:5n-3 5.06 2.60±0.05a 2.67±0.02ab 2.74±0.04ab 2.74±0.06ab 2.86±0.08b 2.77±0.03ab
22:2n-6 0.14 0.19±0.06 0.19±0.03 0.18±0.02 0.18±0.01 0.21±0.01 0.19±0.00
22:4n-6 0.09 0.06±0.01 0.08±0.00 0.07±0.00 0.08±0.00 0.08±0.00 0.08±0.00 22:5n-6 0.27 0.14±0.00 0.15±0.00 0.15±0.01 0.16±0.01 0.16±0.01 0.16±0.01 24:1n-9 0.3 0.21±0.01 0.22±0.01 0.21±0.01 0.22±0.01 0.21±0.01 0.21±0.00 22:5n-3 1.5 0.85±0.02a 0.90±0.01ab 0.90±0.01ab 0.93±0.02b 0.98±0.01c 0.93±0.01b
22:6n-3 12.04 6.82±0.13 6.77±0.20 7.18±0.31 7.24±0.29 7.57±0.21 7.33±0.21 24:5n-3 0.17 0.06±0.01 0.07±0.00 0.07±0.00 0.08±0.01 0.08±0.01 0.07±0.00 24:6n-3 0.03 0.04±0.02 0.05±0.05 0.09±0.04 0.09±0.05 - 0.02±0.02 SFA2 28.84 28.31±0.13b 27.96±0.04ab 27.79±0.17ab 27.33±0.07a 27.39±0.20a 28.08±0.26ab
MUFA2
39.6 46.54±0.17 46.63±0.23 46.35±0.38 46.70±0.37 47.08±0.26 46.79±0.10 PUFA2 31.55 25.15±0.27 25.41±0.26 25.87±0.23 25.97±0.30 25.53±0.32 25.13±0.24
n-6 PUFA2 9.91 12.59±0.07b 12.71±0.06b 12.62±0.11b 12.67±0.03b 12.02±0.09a 12.00±0.05a
n-6 LC-PUFA2 2.2 2.59±0.07 2.55±0.05 2.53±0.05 2.61±0.04 2.52±0.02 2.52±0.04
n-3 PUFA2
21.64 12.56±0.20 12.70±0.26 13.24±0.30 13.29±0.32 13.51±0.29 13.13±0.19 n-3 LC-PUFA2 19.53 10.90±0.21 10.99±0.26 11.53±0.30 11.60±0.33 12.04±0.29 11.65±0.20
n-3/n-6 ratio2 0.318 0.13±0.001a 0.13±0.003a 0.13±0.004a 0.13±0.004a 0.15±0.004b 0.15±0.005b
Total Fatty Acid(mg/g lipid) 690.7 746.0±6.9 731.6±11.9 755.6±8.7 753.7±16.3 729.4±17.6 706.2±19.6
Initialfish not included in statistical analysis. Data are expressed as mean±S.E.M., n = 3; N = 18. Values in the same row with different letters (a, b, c) are significantly different (P<0.05; ANOVA and Student–Newman–Keuls post hoc test).
1abbreviation as inTable 1. 2abbreviation as inTable 2.
the fillets of fish fed HR and VR, and lower levels recorded in the whole bodies of fish fed LR, compared to other treatments. The EPA (20:5n-3) and DPA (22:5n-3) content in fish fillets were significantly affected by diets, with the highest levels recorded in fish fed HR. DHA (22:6n-3) was on the other hand significantly higher in the whole body of fish fed HR, com-pared to all other treatments. This resulted in overall higher content of n-3 LC-PUFA in the whole bodies of fish fed HR. The variation in n-6 and n-3 fatty acid mentioned above, also re-sulted in significantly higher n-3/n-6 ratio in the fillets of fish fed HR and VR, compared to other treatments.
Apparent in vivo fatty acid beta-oxidation and bioconversion
Statistically significant differences were observed for the apparentin vivofatty acidβ-oxidation for energy production among dietary groups (Table 9). Specifically, treatment HR showed rela-tively higher fatty acidβ-oxidation rates for the majority of the SFA and MUFA compared with the other treatments, whereas in fish fed VR a significantly lowerβ-oxidation of alpha-linolenic acid (18:3n-3) was recorded. Only minor modifications of the apparentin vivofatty acid
Table 9. The apparent in vivo fatty acidβ-oxidation (nmol/g/day; deduced by the whole body fatty acid balance method) in Atlantic Salmon fed the experimental diets containing different fortification level of selected micronutrients.
Experimental treatments1
FA (nmol/g/day)2 CD LV HV LR HR VR
12:0 6.0±0.0c 4.7±0.1c 0.2±0.1a 5.2±0.3c 2.1±0.6b 1.5±0.6b
14:0 89.3±1.4a 71.7±7.4a 82.2±3.3a 74.1±7.7a 113.0±7.7b 75.6±12.4a
14:1n-5 12.4±0.8b 9.2±0.6a 9.4±0.2a 8.7±0.6a 12.8±0.7b 10.7±0.9ab
16:0 487.7±6.8a 380.0±43.7a 392.4±25.1a 396.2±50.3a 639.2±57.1b 411.9±68.3a 16:1n-7 181.4±3.0ab 148.9±16.4a 165.1±7.0ab 147.2±17.1a 223.5±17.9b 172.5±22.2ab
18:1n-7 31.7±2.4 17.4±7.8 25.0±1.9 16.4±8.4 36.1±8.4 17.5±9.4
18:0 79.1±3.2ab 47.5±10.4a 47.7±6.8a 61.7±14.3a 115.2±14.9b 51.0±19.1a
18:1n-9 501.0±135.6 514.1±83.7 592.2±35.7 506.6±96.0 728.9±95.4 454.1±111.0
20:0 1.8±1.1 2.5±0.3 2.5±0.0 3.5±0.3 4.3±0.9 3.2±0.8
20:1n-11 1.5±0.1ab 0.9±0.2a 1.7±0.1ab 0.9±0.2a 2.3±0.6b 1.8±0.3ab
22:1n-11 2.4±0.0 2.1±0.2 2.4±0.2 2.6±0.3 3.4±0.4 2.4±0.5
22:0 0.1±0.1 0.2±0.1 0.0±0.0 0.5±0.2 0.8±0.4 0.1±0.1
18:2n-6 182.9±17.2 137.1±26.5 165.3±11.5 129.9±27.7 185.9±29.0 108.1±34.1
20:4n-6 1.1±0.2 -3 0.4±0.2 0.5±0.5 2.9±1.5 0.8±0.8
22:4n-6 0.3±0.1 0.1±0.1 0.2±0.1 0.2±0.1 0.5±0.3 0.5±0.4
22:5n-6 0.1±0.1 0.0±0.0 0.1±0.1 0.0±0.0 0.2±0.1 0.1±0.1
18:3n-3 44.2±1.3b 37.0±2.9b 39.6±0.8b 36.4±2.9b 33.7±2.5b 23.9±5.1a
18:4n-3 20.0±0.1 15.9±2.3 18.2±0.8 18.2±1.6 22.3±2.0 16.3±2.5
20:4n-3 1.2±0.3 - 0.7±0.3 1.8±0.8 2.3±1.0 3.2±1.2
20:5n-3 99.3±1.8 65.9±16.0 86.5±6.1 71.3±18.1 105.6±17.8 57.2±25.3
Total Fatty Acids 1,743±173 1,455±217 1,631±98 1,482±242 2,235±257 1,412±309
(Only fatty acidrecording an apparent in vivo fatty acidβ-oxidation are reported).
Data are expressed as mean±S.E.M., n = 3; N = 18. Values in the same row with different letters (a, b, c) are significantly different (P<0.05; ANOVA and Student–Newman–Keuls post hoc test).
1abbreviation as inTable 1.
2apparentin vivofatty acidβ-oxidation (nmol/g/day). 3not detected.
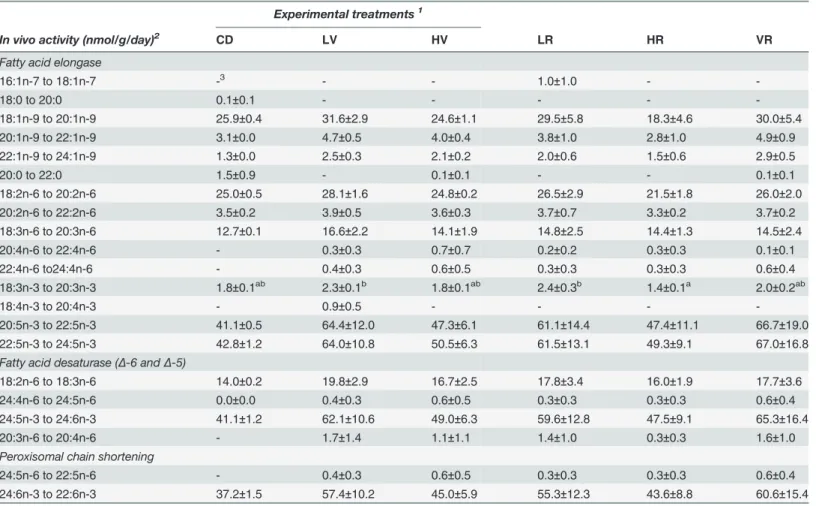
bioconversion, as affected by dietary treatments, were recorded (Table 10). Specifically the elongation of 18:3n-3 to 20:3n-3 was up-regulated in fish fed the low inclusion of the two algal products (LV and LR) compared to the other treatments. No differences were recorded for the activities of any of the main enzymes (elongases, desaturases and peroxisomal chain shorten-ing) for the ultimate production of DHA.
Discussion
The results from the present study indicate that inclusion of algae product Verdemin and Rosa-min at levels of 2.5 and 5.0% in practical diets did not cause any significant effect on growth performance, fish biometry macronutrient digestibility and muscle fatty acid composition of Atlantic Salmon, with the exception of feed intake and FCR for HR treatment, and a slight re-duction in protein digestibility for both tested products. Accordingly, previous studies testing the inclusion of 5% ofUlvaspp. meal in feed for carnivorous fish like European sea bass
Table 10. The apparent in vivo activity (nmol/g/day) of the key enzymes in fatty acid biosynthetic pathways (deduced by the whole body fatty acid balance method) in Atlantic Salmon fed the experimental diets.
Experimental treatments1
In vivo activity (nmol/g/day)2 CD LV HV LR HR VR
Fatty acid elongase
16:1n-7 to 18:1n-7 -3 - - 1.0±1.0 -
-18:0 to 20:0 0.1±0.1 - - - -
-18:1n-9 to 20:1n-9 25.9±0.4 31.6±2.9 24.6±1.1 29.5±5.8 18.3±4.6 30.0±5.4
20:1n-9 to 22:1n-9 3.1±0.0 4.7±0.5 4.0±0.4 3.8±1.0 2.8±1.0 4.9±0.9
22:1n-9 to 24:1n-9 1.3±0.0 2.5±0.3 2.1±0.2 2.0±0.6 1.5±0.6 2.9±0.5
20:0 to 22:0 1.5±0.9 - 0.1±0.1 - - 0.1±0.1
18:2n-6 to 20:2n-6 25.0±0.5 28.1±1.6 24.8±0.2 26.5±2.9 21.5±1.8 26.0±2.0
20:2n-6 to 22:2n-6 3.5±0.2 3.9±0.5 3.6±0.3 3.7±0.7 3.3±0.2 3.7±0.2
18:3n-6 to 20:3n-6 12.7±0.1 16.6±2.2 14.1±1.9 14.8±2.5 14.4±1.3 14.5±2.4
20:4n-6 to 22:4n-6 - 0.3±0.3 0.7±0.7 0.2±0.2 0.3±0.3 0.1±0.1
22:4n-6 to24:4n-6 - 0.4±0.3 0.6±0.5 0.3±0.3 0.3±0.3 0.6±0.4
18:3n-3 to 20:3n-3 1.8±0.1ab 2.3±0.1b 1.8±0.1ab 2.4±0.3b 1.4±0.1a 2.0±0.2ab
18:4n-3 to 20:4n-3 - 0.9±0.5 - - -
-20:5n-3 to 22:5n-3 41.1±0.5 64.4±12.0 47.3±6.1 61.1±14.4 47.4±11.1 66.7±19.0
22:5n-3 to 24:5n-3 42.8±1.2 64.0±10.8 50.5±6.3 61.5±13.1 49.3±9.1 67.0±16.8
Fatty acid desaturase (Δ-6 andΔ-5)
18:2n-6 to 18:3n-6 14.0±0.2 19.8±2.9 16.7±2.5 17.8±3.4 16.0±1.9 17.7±3.6
24:4n-6 to 24:5n-6 0.0±0.0 0.4±0.3 0.6±0.5 0.3±0.3 0.3±0.3 0.6±0.4
24:5n-3 to 24:6n-3 41.1±1.2 62.1±10.6 49.0±6.3 59.6±12.8 47.5±9.1 65.3±16.4
20:3n-6 to 20:4n-6 - 1.7±1.4 1.1±1.1 1.4±1.0 0.3±0.3 1.6±1.0
Peroxisomal chain shortening
24:5n-6 to 22:5n-6 - 0.4±0.3 0.6±0.5 0.3±0.3 0.3±0.3 0.6±0.4
24:6n-3 to 22:6n-3 37.2±1.5 57.4±10.2 45.0±5.9 55.3±12.3 43.6±8.8 60.6±15.4
Data are expressed as mean±S.E.M., n = 3; N = 18. Values in the same row with different letters (a, b) are significantly different (P<0.05; ANOVA and Student–Newman–Keuls post hoc test).
1abbreviation as inTable 1.
2apparentin vivoactivity (nmol/g/day). 3not detected.
(Dicentrarchus labrax)[16] and rainbow trout [43] reported no effect on growth performance. Nevertheless, other studies that tested dietary inclusion up to 10–15% of algae meal in feed for fishes with more amylase activity (e.g. herbivorous and/or omnivorous species) [44] which are reported to be able to digest algal products more efficiently [10,45], such as Nile tilapia [46,47], common carp (Cyprinus carpio) [15] gilthead sea bream (Sparus aurata) [22], reported signifi-cant improvement in growth performances, feed efficiency, nutrient utilisation and body com-position. Accordingly, the response of fish to dietary algal inclusion is well documented to be species-specific. In the present study a significant negative effect of both algal product inclusion on protein digestibility was observed. It has been suggested that carnivorous fish, like Atlantic Salmon, are not particularly efficient in digesting particle nutrients from algae. Accordingly, it may be suggested that the observed negative effect on protein digestibility in diets formulated with the inclusion of algal products was resulting from a lower digestibility of the actual protein contained in the algal products. However, previous studies suggest that fish are not able to di-gest more than 45–56% protein from algae [45], not because of protein quality, but because of the limited ability in the hydrolysis of complex polysaccharides present in algae. Therefore the negative effect recorded in this study on nutrient digestibility was likely not due to an actual lower digestibility of those nutrients, but was due to a negative effect of the complex polysac-charides contained in algal products. Additionally, it is also important to considerer that in the present study the total protein content originating from the algae inclusion was only 1–2% (low to high inclusion) of the total protein content of the diet, and therefore it is more likely that the recorded negative effect on protein digestibility is due to a negative interaction between some components of the algal products and proteolytic enzymes.
General beneficial effects of the use of algae in finfish nutrition are not commonly reflected in a direct positive effect on growth, but more typically reflected in effects of some specific physiological activities [21]. For example, positive effects of algal products in fish feed have been reported on improved liver functions, stress response and starvation tolerance [43], and in overall increased carcass quality and health status, and in particular improved health of the intestinal mucosa [11,21,23]. Admittedly, the present study was not designed to address these specific scientific questions and more compressive studies are warrant, specifically towards as-sessing the potential beneficial effects of the inclusion of algae in aquafeed with respect to fish welfare and stress tolerance, which is an increasingly important issue of the current
aquaculture industry.
The present study also found an increase in the n-3 LC-PUFA content in whole body of fish fed the algal products. Accordingly, similar results have been reported previously in studies in Atlantic salmon fed with a commercial blend of seaweed [48] and in mice feed with the algal carotenoid fucoxanthin and fucoxanthinol, where a remarkable increase in the polyunsaturated fatty acid content of the liver was observed [30,34,49]. All this evidence, clearly displays the im-portance of these bioactive carotenoids found in algae. Importantly, the observed increased in n-3 LC-PUFA content of fish tissues, though statistically significant, from a nutritional point of view for consumers can be considered as minimal. Accordingly, it can be reported that it is un-likely that the improved n-3 LC-PUFA content of fish tissues resulting from dietary algal prod-uct inclusion could compensate for the possible redprod-uction of n-3 LC-PUFA resulting from a reduction of dietary fish oil inclusion.