Validity of self-reported weight - A study of urban brazilian adults*
Maria I. Schmidt**, Bruce B. Duncan**, Mário Tavares***, Carísi A. Polanczyk****, Lúcia Pellanda****, Paulo M. Zimmer****
SCHMIDT, M.I. et al. Validity of self-reported weight - A study of urban brazilian adults. Rev. Saúde Pública, 27: 271-6, 1993. In order to evaluate the validity of self-reported weight for use in obesity prevalence surveys, self-reported weight was compared to measured weight for 659 adults living in the Porto Alegre county, RS Brazil in 1986-87, both weights being obtained by a technician in the individual's home on the same visit. The mean difference between self-reported and measured weight was small (-0.06 +/- 3.16 kg; mean +/- standard deviation), and the correlation between reported and measured weight was high (r=0.97). Sixty-two percent of participants reported their weight with an error of < 2 kg, 87% with an error of < 4 kg, and 95% with an error of < 6 kg. Underweight individuals overestimated their weight, while obese individuals underestimated theirs (p<0.05). Men tended to overestimate their weight and women underestimate theirs, this difference between sexes being statistically significant (p=0.04). The overall prevalence of underweight (body mass index < 20) by reported weight was 11%, by measured weight 13%; the overall prevalence of obesity (body mass index [] 30) by reported weight was 10%, by measured weight 11%. Thus, the validity of reported weight is acceptable for surveys of the prevalence of ponderosity in similar settings.
Keywords: Obesity, epidemiology. Body weight. Validity.
Introduction
Self-reported weight, if accurate, can be very useful in public health studies, obviating the need for in the field weight measurements. However the validity of this information has not been uniformly accepted6,8,9,11,13,14.
A literature search covering the last ten years revealed no study evaluating the accuracy of self-reported weight in an adult Brazilian population.
The purpose of this study is to evaluate the va-lidity of reported personal weight in a survey of 659 adults living in Porto Alegre, RS, in 1986-87, by comparing the self-reported weight with a measured weight, both obtained in the individual's household during the same interview.
Methodology
Data were collected in the Porto Alegre county (Brazil) as part of a Pan-American Health
Organi-* Research supported by the Pan-American Health Organ-ization, CNPq (Conselho Nacional de Desenvolvimento Científico e Tecnológico) and FAPERGS (Fundação Amparo à Pesquisa do Estado do Rio Grande do Sul). ** Department of Social Medicine of the Faculty of
Medi-cine (UFRG) Porto Alegre, RS-Brazil *** Médico
**** Clinic Hospital of Porto Alegre-Porto Alegre, RS-Brazil
Reprints: M.I. Schmidt Rua Ramiro Barcelos, 2600/414 -90035-003 - Porto Alegre, RS - Brazil
zation multicenter study of non-communicable disease risk factors10. The methodology used in this study has been reported in greater detail previ-ously3. In brief, a sample of 1,157 men and wom-en betwewom-en 15 and 64 years of age were inter-viewed in 1986 and 1987 in randomly selected households in selected census zones of the city.
Weight was measured during the chronological second half of the data collection. During this peri-od, 699 individuals were interviewed. Of these, 39 did not have a self-reported weight, and one did not have his height recorded. Thus, analysis here were performed on the remaining 659 individuals. Small differences in the total number of individuals in categories of race and educational level reflect two missing values for each of these variables.
Educational achievement, measured by the number of grades completed, was categorized on the basis of Brazilian educational levels. Race was assessed by the interviewer and, for the purposes of this study, the categories of black and "mulato" (a mixed white and black appearance) were grouped together as black.
recommended2,5,15 body mass index (BMI: weight in kilograms/height in meters squared) cutpoints of underweight (BMI < 20), normal (20 < = BMI < 25), overweight (25 <= BMI < 30), and obese (BMI > 30).
Error in the reporting of weight was calculated as the difference between self-reported and meas-ured weight, negative differences thus represent-ing underestimation and positive differences over-estimation. The statistical significance of these differences was tested by paired t-tests. The corre-lation of self-reported weight with measured weight was expressed using Pearson's correlation coefficient1. The association of various factors with under and overreporting of weight was evalu-ated through multiple linear regression modelling of the differences between reported and measured weight as a function of these factors7.
Error in the classification of individuals as un-derweight, overweight and obese on the basis of self-reported weight was evaluated through contin-gency tables comparing self-reported weight with measured weight classifications. The sensitivity and specificity of using self-reported weight in this process was calculated along with appropriate confidence intervals4. Sex-specific linear regres-sions were used to evaluate the degree to which true (measured) weight can be predicted on the ba-sis of reported weight7.
Results
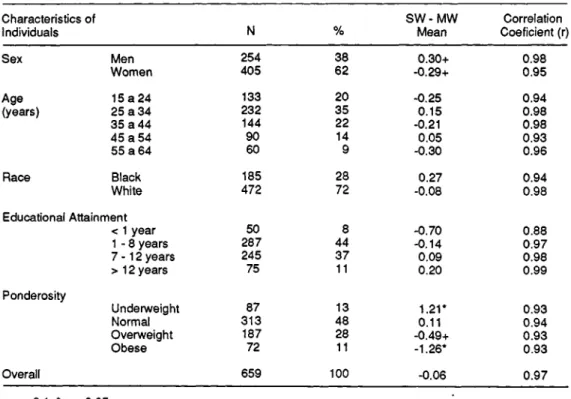
As seen in Table 1, 62% of the 659 individuals studied were women, slightly more than half under 35 years of age, 72% white, and most with either a primary or secondary school educational achieve-ment. Thirteen percent were underweight, 48% of normal ponderosity, 28% overweight and 11% obese.
The overall comparison of self-reported and measured weight (Table 1, bottom) showed the two measurements to be remarkably similar. The mean of the differences between the weights ob-tained by the two techniques was -0.06 kg, with standard deviation of 3.16 kg. The correlation be-tween the two, for the whole sample, was r=0.97.
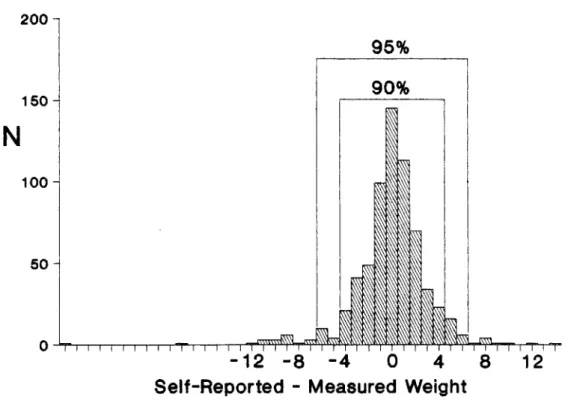
Figure 1 illustrates the overall distribution of the differences between self-reported and meas-ured weight. Approximately 62% of the sample re-ported their weight with an error of less than 2 kg. The largest underreporting overall was 28 kg (1 case, a 54 - year old, obese woman); the largest overreporting 12 kg (1 case, a 54 - year old, over-weight woman). But large differences were rare. In fact, only 13% of the sample reported differenc-es equal to or greater than 4 kg, and only 5% dif-ferences equal to or greater than 6 kg.
sex, age, race, educational attainment, and ponde-rosity. Correlations between self-reported and measured weight are high in all categories consid-ered, ranging from 0.88 to 0.99. Examining the differences between self-reported and measured weight, one finds very similar results for men and women, perhaps with a small tendency for men to overreport (mean = 0.30 kg, p < 0.1) and for wom-en to underreport (mean = -0.29 kg, p < 0.1) their actual weight. Even smaller differences are found across age and race categories. Greater differences are found when examining the data across educa-tional and ponderosity categories, although statisti-cally significant differences were found only for the latter. Underweight individuals overreport their weight on average 1.2 kg (p<0.05); over-weight individuals tend to underreport their over-weight on average 0.5 kg (p<0.1), and obese individuals underreport their weight by 1.3 kg (p < 0.05).
As men and women, in general, err in different directions in their reporting of weight, as do un-derweight as compared to overweight individuals, mean differences between reported and measured weight were calculated separately for men and women by ponderosity category. Among men, the underweight overreported their weight by 1.2 kg, those with normal ponderosity by 0.42 kg, and the overweight by 0.22 kg, while obese men underre-ported their weight by 1.4 kg. Among women, the
underweight overreported their weight by 1.2 kg, while those with normal poderosity underreported their weight by 0.07 kg, the overweight by 1 kg and the obese by 1.2 kg.
In multiple linear regression modelling of weight difference, after controlling for measured weight, only height, age and sex associated with significantly altered reported weight. In this model, for each centimeter of height, the differ-ence between reported and measured weight was 0.05 kg greater (p<0.01); for each year of age 0.02 kg greater (p=0.02). Males reported a weight 0.67 kg lower than that reported by fe-males (p=0.04). Neither race, educational achievement nor second-order interaction terms were significantly associated with discrepant re-ported weight in these analysis.
Figure 2 demonstrates the distribution of differ-ences between self-reported and measured weight across categories of ponderosity. Consistent with the data in Table 1, this figure shows that the lean overreport their weight while the overweight un-derreport theirs. Additionally, the figure shows that the larger absolute differences tended to be re-ported by the overweight and the obese.
meas-ured weight as a gold standard. Table 2 shows that the error was small and had as a main effect the generation of lower sensitivity indices.
Sensitivity was the lowest for the underweight classification - 28% of those underweight by
measurement were not so by reported weight. False positive rates were very low for all catego-ries, as indicated by the high specificity seen.
To evaluate the impact of these false negative and false positive rates in the estimation on the fre-quency of ponderosity categories, Table 3 com-pares prevalences calculated using self-reported weight with those determined using measured weight. As was to be expected, given the fact that the sensitivities were considerably lower than the specificities, the net result was one of underestima-tion of the frequency of abnormal poderosity. The effect was small, 1-2%, for the abnormal categories. Measured weight was predicted, in women, by the equation: Measured weight (kg) = 2.10 + 0.97 reported weight (kg) with R2= 9 5 . In men, the equation was: Measured weight (kg) = -0.58 + 1.00 reported weight (kg), with R2=0.98. In these sex-specific models, no other factor significantly predicted measured weight.
Discussion
study design or analysis, the following statements can be made. In this study, differences between reported and measured weight greater than or equal to 4 kg were seen in 13% of the sample, compared with 11% in the Finnish study6. In the Porto Alegre study, differences greater than or equal to 2 kg occurred in 38% of the sample, and greater than or equal to 3 kg in 22%, in compari-son with differences greater than or equal to 5 lbs (2.3 kg) in 37% of the Minnesota Lipid Research Clinic11 sample. The remaining studies8,9,13,14 ei-ther were not population-based or did not report data on the distribution of these differences.
In a society where few homes possess a weight-scale, this finding of relatively similar accuracy of weight reporting may be in part explained by widespread use of drug store scales, and, perhaps to a lesser extent, to fairly frequent medical con-tact in Porto Alegre.
It is also important to note that these data, col-lected in households at the same moment in time, derive from a community-based study rather than from one with a more restricted base, such as that of participants or volunteer potential participants in clinical studies or of applicants for life insu-rance6,8,9,11,13,14. Thus, it is less likely that the par-ticipants in this study would have specific reasons for misrepresenting their own weight or having unusually recently measured it, or that their weight should have changed during the time lapse that oc-curred between its report and measurement.
Before discussing the implications of the differ-ences encountered between self-reported and measured weight, it is important to note their po-tential causes. The cause could be a problem of knowledge, that is to say, the person does not know his current weight. Or the problem could be related to the person's body image. Here, regard-less of how regularly or accurately he measures his weight, the person erroneously forms an idea of his weight in accordance with an internally de-sired body image. Finally, the problem could be at the level of weight reporting - even a person with accurate knowledge, consistent with his body im-age, may be led by factors such as cultural norms or personal psychological needs to report his weight inaccurately to an interviewer.
The finding here presented - that self-reported weight is biased towards what appears to be a cul-turally ideal or a desirable body weight - is also consistent with the literature6,8,9,11,13,14: over-weight individuals underreport while underover-weight individuals overreport their body weight. Whether the bias occurs at the level of body image, or at that of reporting, cannot be safely judged from this study nor from the previous ones. However, it is unlikely that mere differences in acquired
knowl-edge of measured weight can explain the differen-tial biases seen here by sex and ponderosity cate-gory. The fact that men tended to overreport their weight while women to underreport theirs proba-bly reflects gender specificity in cultural ideals of weight, be they acting at the level of body image or misreporting. In this regard, results here are similar to those of the Lipid Research Clinic popu-lation in the USA11. Notably however, women in the USA sample tended to underreport across all categories of ponderosity, whereas in Porto Ale-gre, this underreporting occurred in significantly only for the overweight and the obese. This differ-ence may well reflect some cross-cultural varia-tion in the concept of "ideal weight".
Other factors associated with discrepancy in self-reported weight, consistent with the literature, were height and age. These associations were of smaller magnitude: for example, for each decade increase in age, overreporting increased by 0.2 kg; for each 10 cm increase in height, 0.5 kg.
What are the implications of these findings for field studies conducted in similar settings? If the purpose of such a study is to estimate the weight of groups of individuals, error in population weight parameter estimates should be small. Fur-thermore, it is possible to use the equations here presented to adjust the self-reported weight. Simi-larly, if the purpose is to describe prevalences of cat-egories of ponderosity based on self-reported weight, the error in underestimation should also be small. It is possible to use the sensitivity and speci-ficity here presented to produce an adjusted preva-lence for each ponderosity category 12.
It must be noted, however, that these data do not address the effect or weight mis-reporting in analysis whose objective is to evaluate the associa-tion of weight with other variables.
Finally, it was concluded that the validity of self-reported weight is sufficient to permit its use in surveys of the prevalence of obesity and other weight categories in settings similar to the one here studied.
SCHMIDT, M.I. et al. [Validade do peso auto-referido. Estudo de população urbana de adultos, Brasil]. Rev, Saúde Pública, 27: 271-6, 1993. Para avaliar a validade
95% com erro < 6 kg. Indivíduos de baixo peso hiperes-timaram seu peso, o oposto ocorrendo com indivíduos obesos (p<0,05). Os homens tendiam a superestimar seu peso, o oposto ocorrendo com as mulheres (p=0,04). A prevalência geral de baixo peso (índice de massa corpo-ral (IMC) < 20) por peso auto-referido foi de 11% e a por peso medido, de 13%; a prevalência geral de obesi-dade (IMC > 30) por peso referido, foi de 10% e a por peso medido, de 11%. Concluindo, a validade do peso auto-referido é aceitável para inquéritos de prevalência realizados em contextos similares.
Descritores: Obesidade, epidemiologia. Peso corporal.
Validez.
References
1. BERQUÓ, E.S.; SOUZA, J.M.P. de; GOTLIEB.S.L.D. Bio-estatística. São Paulo, Ed. Pedagógica e Universitária
Ltda., 1981.
2. BRAY, G.A. Classification and evaluation of the obesities.
Med. Clin. N. Am., 73:161-84, 1989.
3. DUNCAN, B.B.; SCHMIDT, M.I; POLANCZYK, C.A.;
HOMRICH, C.S.; ROSA, R.S.; ACHUTTI, A.C. Fa-tores de risco para doenças não-transmissíveis em área metropolitana na região sul do Brasil: Prevalên-cia e simultaneidade. Rev. Saúde. Pública, 27: 43-8,
1983.
4. FLETCHER, R.H; FLETCHER, S.W.; WAGNER, E.H. Epi-demiologia clínica, bases científicas da conduta médi-ca. Porto Alegre, Ed. Artes Médicas, 1989.
5. GARROW, J.S. Índices of adiposity. Nutr. Abstr. Rev. Ser.
A,. 5 3: 6 9 7 -7 0 8, 19 83.
6. JALKANEN, L.; TUOMILEHTO, J.; TANSKANEN, A.; PUSKA, P. Accuracy of self-reported body weight compared to measured body weight, a population sur-vey. Scand. J. Soc. Med., 15:191-8,1987.
7. KLEINBAUM, D.G.; KUPPER, L.L.; MULLER, R.E. Ap-plied regression analysis and other multvariable meth-ods. Boston, PWS - KENT, 1988.
8. PAGANINI-HILL, A. & ROSS, R.K. Reliability of recall of drug usage an other health-related information. Am. J. Epidemiol, 116:114-22, 1982.
9. PALTA, M.; PRINEAS, RJ.; BERMAN, R.; HANNAN, P. Comparison of self-reported and measured height and weight. Am.J. Epidemiol., 115:223-30, 1982.
10. PAN AMERICAN HEALTH ORGANIZATION. Health of adults and the elderly. In: Health conditions in the Americas. Washington, Pan American Health Organiza-tion, 1990. (Scientific publication no. 524)P.
11. PIRIE, P.; JACOBS, D.; JEFFREY, R.; HANNAN, P. Dis-tortion in self-reported height and weight data. J. Am. Diet. Assoc.78: 601-6, 1981.
12. ROGAN, W.J. & GLADEN, B. Estimating prevalence from the results of a screening test. Am. J. Epidemiol.,
107:71-6, 1978.
13. SCHLICHTING, P.; HOILUND-CARLSEN, P.F.; QUAADE, F. Comparison of self-reported height and weight with controlled height and weight in women and men. Int. J. Obesity, 5:67-76, 1981.
14. STUNKARD, A J. & ALBAUM, J.M. The accuracy of self-, reported weights. Am.J. Clin.Nutr. ,34:1593-9,1981. 15. WHO STUDY GROUP ON DIET, NUTRITION AND
PRE-VENTION OF NONCOMMUNICABLE DISEASES, Geneva, 1989. Report. Geneva, 1990. (Who Technical Report Series, 797).