781
Nutr Hosp. 2012;27(3):781-788 ISSN 0212-1611 • CODEN NUHOEQ S.V.R. 318
Original
Increasing leptin level in abstaining alcohol-dependent women
M. Cardoso Fernandes Toffolo1, C. Aparecida Marliére1, S. Nascimento de Freitas1andA. Silva de Aguiar Nemer2
1Ouro Preto Federal University (UFOP). School of Nutrition. Ouro Preto. Minas Gerais, Brazil. 2Juiz de Fora Federal University (UFJF). Biological Science Institute. Department of Nutrition. Juiz de Fora. Minas Gerais. Brazil.
NIVELES ELEVADOS DE LEPTINA EN LAS MUJERES ALCOHÓLICAS ABSTINENTES
Resumen
Introducción: La leptina, hormona secretada en el tejido adiposo, altera la señalización de la dopamina en el núcleo accumbens, lo que afecta directamente la sensibili-dad a la recompensa y la modulación de la abstinencia.
Objetivo:Evaluar el nivel de leptina en suero y su rela-ción con el estado nutricional entre los abstemios y los alcohólicos activos.
Métodos:Se incluyeron en el estudio pacientes de ambos sexos, mayores de 18 años de edad y que utilizan el alcohol como droga principal. Los pacientes fueron sepa-rados en función del tiempo sin el uso de la droga como abstinentes A2 (1-3 meses de abstinencia) y A3 (4 meses o más de abstinencia). Se midieron la circunferencia de la cintura (CC); el % de grasa corporal (%GC) y el peso y la altura para calcular el IMC. Muestras de sangre fueron colectadas para la medición de la leptina.
Resultados:Los niveles medios de leptina, la leptina/ IMC, leptina/%GC, fueron mayores entre las mujeres. Las mujeres abstinentes (A2), también presentaron mayor nivel de leptina, la leptina/IMC y leptina/%GC, de que las mujeres bebedoras activas (p = 0,039, p = 0,023, p = 0,023). Las diferencias estadísticas también se mues-tran entre las mujeres abstinentes A2 y A3. Se observó una asociación positiva significativa entre niveles de lep-tina y el IMC y leplep-tina y la CC en las mujeres alcohólicas activas (leptina ×IMC: r = 0,91, p < 0,01; leptina ×CC:
r = 0,87, p = 0,001). Sin embargo, una asociación significa-tiva no se muestra entre estos resultados en las mujeres abstinentes (leptina ×IMC: r = 0,28, p = 0,37/leptina x
CC: r = -0,32, p = 0,92).
Conclusión:Nuestros resultados sugieren que los nive-les de la leptina parecen aumentar sólo en las mujeres que se abstienen. Este resultado puede estar relacionado con la duración de la abstinencia.
(Nutr Hosp. 2012;27:781-788) DOI:10.3305/nh.2012.27.3.5695 Palabras clave: Leptina. Dependencia. Índice de masa cor-poral. Fisura.
Abstract
Introduction: Leptin, hormone secreted by the fat tissue, changes the signaling of dopamine in the nucleus accumbens, which directly affects the sensitivity of reward and modulation of abstinence.
Aims:To evaluate the level of serum leptin and its rela-tion to nutrirela-tional status among alcoholic abstainers and non-abstinent.
Methods:Patients of both sexes, over 18 years old and who used alcohol as their primary drug were included in the study. Abstaining patients were separated according to the time without the use of the drug as A2 (1-3 month-abstainers) and A3 (4 month and over-month-abstainers). Waist circumference (WC), body fat percentage (%BF) and weight and height were measured to calculate Body Mass Index (BMI). Blood samples were collected for leptin measurement.
Results:Mean levels of leptin, leptin/BMI, leptin/%BF were higher in all women categories. Abstaining women (A2) also showed higher leptin, leptin/BMI and leptin/ %BF than non-abstinent (p = 0.039; p = 0.023; p = 0.023). Statistical differences were also shown among abstaining women A2 and A3 as well a significant positive associa-tion between leptin levels and BMI and leptin and WC in active female drinkers (leptin ×BMI: r = 0.91; p < 0.01;
leptin ×WC: r = 0.87; p = 0.001). However, a significant
association was not shown among these results in abstai-ning women (leptin ×BMI: r = 0.28; p = 0.37/ leptin X
WC: r = -0.32, p = 0.92).
Conclusion:Our results suggest that leptin levels seem to increase only in abstaining women. This result can be related to the length of abstinence.
(Nutr Hosp. 2012;27:781-788) DOI:10.3305/nh.2012.27.3.5695 Key words: Leptin. Dependency. Body mass index. Cra-ving.
Correspondence: Aline Silva de Aguiar Nemer.
Universidade Federal de Juiz de Fora.
Instituto de Ciências Biológicas – Departamento de Nutrição. Zip: 36036-900 Cidade Universitária/Juiz de Fora, Minas Gerais. Brazil. E-mail: [email protected]/
Abbreviations
VTA: Ventral Tegmental Área. BMI: Body Mass Index.
CAPSad: Center for Psychosocial Support for users of alcohol and other drugs from SUS: Unified Health System.
NA: Non-abstinent. A2: 1-3 month abstainer. A3: 4 month or more abstainer.
ICD-10: International Statistical Classification of Diseases and Related Health Problems.
WC: Waist circumferences. %BF: Body fat percentage. WHO: World Health Organization. NIH: National Institutes of Health. GGT: Gamma-glutamyltransferase.
LAPAC: Pilot Laboratory of Clinical Analysis. ELISA: Enzyme Linked Immuno Sorbent Assay. ANOVA: Analysis of variance.
Introduction
Leptin is a polypeptide hormone produced by adipocytes, which play an important role in regulating food intake and body weight control.1Its action on the central nervous system inhibits food intake and incre-ases energy expenditure; it also regulates glucose metabolism, fats and neuroendocrine function.2Plasma concentrations of leptin are influenced by testosterone levels and body fat distribution.3,4Body composition is another important factor related with circulating levels of leptin action.5In addition to body composition, the hormones are correlated directly with the leptin levels. The testosterone has a negative correlation with leptin levels due to the direct effect of androgens in inhibition of leptin secretion by adipocytes.6
The same neurotransmitters, neuromodulators, neu -ro peptides and hormones that cont-rol food intake and regulate body weight, also regulate the sensitivity to drug reward in the brain.7,8 By binding to specific receptors located on dopaminergic neurons in the ventral tegmental area (VTA), leptin plays an inhibi-tory role in the signaling of dopamine in the nucleus accumbens, which directly affects the sensitivity of reward.9
A few studies have been done, trying to understand the relationship between the levels of leptin, and its influence on the rewarding value and modulation of abstinence.10,11,12In a study conducted in alcohol-depen-dent detoxification treatment, Hillemacher et al. (2007),11found that leptin levels are positively corre-lated with the magnitude of desire for alcohol between men and women. Nicolas et al (2001),12also found that leptin levels were higher in alcoholics who used to drink a greater daily dose than they were in those who used to drink less, regardless of nutritional status or compensated liver disease.
The serum leptin levels differ between men and women. Women show plasma levels three times higher than men, compared with the same body mass index (BMI).13However, only few studies have examined separately the levels of leptin in alcohol consumers.14,15 Besides that, little is known about the behavior of leptin in different periods of abstinence. Therefore, we conducted this study with stratified analyse by sex and length of abstinence, in order to know the variation of plasma levels in these conditions.
Due to the few and limited results in the literature, studies are needed to evaluate the influence of adipo-kines that control body weight and food intake in the use of psychoactive drugs, specifically ethanol because it is a unique drug that provides energy (7.1 kcal/g)16 and its use is related to development of malnutrition17 or increased body weight.18
Thus, the objective of this study was to evaluate the level of serum leptin in abstaining and actively drin-king alcoholic patients and its relation to nutritional status and body adiposity.
Material and methods
A cross-sectional study was conducted with conve-nience sampling, where all the attendees of the Center for Psychosocial Support for users of alcohol and other drugs (CAPSad) from Ouro Preto, Minas Gerais, Brazil, connected to the Unified Health System (SUS) were invited to participate in the study between July 2009 and December 2010. According to information obtained from medical records, patients were separated in non-abstinent (ND) and abstinent, considering the length of time without alcohol use as A2 (1-3 month abstainer) and A3 (4 month or more abstainer).
Inclusion criteria
Patients of both sexes (23 women and 42 men) and age over 18 years who agreed to participate in the study signed the Free and Clarified Consent Term were included in the research with a confirmed diagnosis of alcohol dependency in medical records, according to the International Statistical Classification of Diseases and Related Health Problems (ICD-10). These patients used alcohol as the main drug of treatment in CAPSad, being abstaining (A2 and A3/ n = 35) or drinking (non-abstinent – NA/ n = 30).
Exclusion criteria
Approval by the Ethics Comittee
The study was approved by the Research Ethics Committee of Ouro Preto Federal University (CAAE: 0031.0.238.000-09).
Procedures
Nutritional assessment was based on measurements of body weight and height to calculate body mass index (BMI). World Health Organization criteria were used for classification of adults and elderly: low weight (BMI < 18.5 kg/m2); normal (18.5 to 24.9 kg/m2); over-weight (25 to 29.9 kg/m2) and obese (≥ 30 kg/m2).19
Body fat percentage (%BF) was estimated from a prediction equation based on BMI: % BF = 1.218 (BMI) - 10.13 (men); %BF = 1.48 (BMI) – 7 (women). The same formula was used in other studies with alco-holics.20The obtained values were classified according to the Lohman (1991): mean % BF= 15% for men and 23% for women.21
Waist circumferences (WC) were measured in the mid-point between the lower end of the rib cage and top of the iliac crest in a standing position, which is usually 3 cm above the anterior superior iliac spine. The measures were collected following the rules proposed by Lohman(1992)22 and Callaway et al. (1988).23 To measure body weight, TANITA Iroman® was used, adjusted for each measurement, with a capacity of 150 kg with a precision of 0.1 kg with participants standing bare-foot and wearing light clothing. To measure the height,
the portable anthropometric Alturaexata®was used, with field of use from 0.35 to 2.13 m (scaled in centimeters).
The collection of blood samples for serum leptin and the biomarker of alcohol consumption gamma-glutamyl-transferase (GGT) were performed at the Pilot Labora-tory of Clinical Analysis (LAPAC) of Ouro Preto Federal University. Blood was collected in the morning with all participants fasted for 12 hours. Samples were centrifuged and stored at -80 °C until analysis. Plasma leptin was assayed by ELISA (Enzyme Linked Immuno Sorbent Assay), using the Kit for Human Leptin Millipore®. The mean leptin level from normal lean individuals was considered (BMI ranges 18-25 kg/m2): Lean men 3.8 ± 1.8 ng/mL; lean women 7.4 ± 3.7 ng/mL. The detection limit was 0.5 ng/mL-100 ng/mL. Part of the analysis was done in duplicate (61%). The GGT was determined by routine clinical chemistry methods of LAPAC. The cut-off limit used in the study was > 50 U/L for GGT.
Statistical analysis
The results were expressed as mean and standard deviation. Leptin levels were used for statistical analysis correction for BMI (leptin/BMI) and % BF (leptin/%BF).
Statistical analysis was performed in SPSS software version 17.0. Statistical significance was accepted if a p value less than 0.05 was obtained. A Kolmogorov-Smirnov test was performed to assess if variables were normally distributed. The variables leptin, leptin/BMI,
Leptin level in abstaining
alcohol-dependent women 783
Nutr Hosp. 2012;27(3):781-788
Fig. 1.—Distribution of men and women abstinent and non-abstinent on the Body Mass Index and body fat per-centage classification. Ade-quate %BF: mean 15% for men and 23% for women.21
BODY MASS INDEX
BODY FAT PERCENTAGE
ABSTINENT NON-ABSTINENT
ABSTINENT NON-ABSTINENT
20
15
10
5
0
Participants (n)
20
15
10
5
0
Participants (n)
Men Women Men Women
Men Women Men Women
Slimness Normal weight Overweight Obesity
Adequate
784
M. Cardoso Fernandes Toffolo et al.
Nutr Hosp. 2012;27(3):781-788
Table I
Means, standard deviations (± SD), minimum and maximum values of age, BMI, % BF, WC, leptin, leptin/BMI and leptin/% BF stratified by characteristics of pattern of alcohol use
Men Women
Mean Median Mean Median
Variable Pattern of use N ± SD (Min-Max) N ± SD (Min-Max)
NA 20 41.1 ± 7,77 41 (26-54) 10 40.30 ± 7,86 42.5 (29-49)
Age A2 15 43.67 ± 7,89 40 (32-57) 6 36.83 ± 6,58 36 (29-45)
A3 7 49.00 ± 12,54 50 (29-64) 7 46.57 ± 9,74 48 (32-62)
p* 0.13 0.11
NA 20 22.25 ± 4.7 21.37 (16.67-28.91) 10 24.27 ± 5,72 21.64 (18.87-36.94) BMI A2 15 23.39 ± 4.21 22.06 (18.56-31.84) 6 26.98 ± 4,577 26.26 (21.80-34.17) A3 7 25.24 ± 3.47 26,49 (20.39-29.20) 7 26.63 ± 6,16 27.18 (16.25-34.42-)
p* 0.19 0.57
NA 20 16.98 ± 4.29 15.9 (10.18-25.08) 10 28.92 ± 8.46 25.02 (20.93-47.67) % BF A2 15 18.36 ± 4.89 16.74 (12.47-28.65) 6 32.93 ± 6.76 31.87 (25.26-43.58) A3 7 20.61 ± 4.22 22.13 (14.7-25.44) 6 32.40 ± 9.11 33.23 (17.05-45.42)
p* 0.19 0.57
NA 20 80.63 ± 8.81 77.8 (68-105.00) 10 81.87 ± 12.17 81 (67.5-103.00)
WC A2 15 83.48 ± 8.97 80 (71-100.30) 6 88.45 ± 9.33 88 (79-101.2)
A3 7 90.4 ± 9.59 91 (78.3-102.00) 6 96.91 ± 33.05 87.25 (69-162)
p* 0.05* 0.07
NA 20 2.55 ± 2,89 1.76 (0.00-13.17) 10 16.66 ± 20.12 9.54 (1.27-62.90)
Leptin A2 15 1.73 ± 1,59 1.15 (0.09-6.41) 6 36.20 ± 17.76 36.93 (14.4-63.09)
A3 7 4.49 ± 3,75 2.98 (0.05-11.37) 6 14.62 ± 14.20 11.67 (0.7-38.09)
p** 0.13 0.05
NA 20 0.11 ± 0.11 0.08 (0.00-0.47) 10 0.58 ± 0.58 0.44 (0.06-1.70)
Leptin/BMI A2 15 0.07 ± 0.07 0.55 (0.003-0.24) 6 1.33 ± 0.60 1.23 (0.66-2.09)
A3 7 0.17 ± 0.13 0.14 (0.002-0.39) 6 0.57 ± 0.55 0.49 (0.02-1.36)
p** 0,27 0,05
NA 20 0.16 ± 0.14 0.11 (0.00-0.56) 10 0.46 ± 0.46 0.36 (0.06-1.32)
Leptin/%BF A2 15 0.10 ± 0.09 0.07 (0.00-0.30) 6 1.08 ± 0.49 0.98 (0.57-1.69)
A3 7 0.21 ± 0.15 0.20 (0.00-0.46) 6 0.47 ± 0.44 0.42 (0.02-1.11)
p** 0.29 0 0.05
BMI: Body Mass Index; % BF: Body fat percentage; WC: Waist circumference; NA: Non-abstinent; A2: 1-3 month-abstainer; A3: 4 month and over-abstainer. Leptin: NA ×A2, p = 0.039, A2 × A3, p = 0.032; Leptin/BMI = NA ×A2, p = 0.023, A2 × A3, p = 0.05; Leptin/%BF: NA × A2, p = 0.023, A2 × A3, p = 0.05 (U-Mann-Whitney Test)/ WC: NA × A3, p = 0.04 (ANOVA Post-hoc Tukey).
leptin/%body fat and GGT did not fit the normal distri-bution.
Non-parametric variables were analyzed with the Man-Whitney U test and Kruskal-Wallis test. We performed one-way analysis of variance (ANOVA) for parametric variables. Spearman’s correlation coeffi-cient with 95% confidence interval (95%CI) was used to assess the association between continuous variables. The variables categorical were compared using the Chi-Square test or Fisher’s Exact Test. Simple linear regression was performed with leptin levels, BMI and WC. The leptin was transformed logarithmically due to non-normal distributions.
Results
More men were assessed than women (men 64.6%). The mean age was 43.3 ± 8.95 years for men and 41.3 ± 8.70 years for women (t-Student Test; p = 0.381).
In figure 1, regarding the nutritional status of alcoho-lics assessed, it can be observed that there were diffe-rences between the sexes for the distribution of abstai-ning normal weight participants and overweight participants. Men had more normal weight participants compared with women (Men: n = 12/54.54% ×
Women: n = 2/16.67%; p = 0.001; Fisher’s Exact Test). The proportion of overweight abstaining women was higher than men (Women: n = 6/50% × Men: n = 9/40.9%; p = 0.04; Fisher’s Exact Test). Most partici-pants had %BF above the mean, regardless of the alcohol use patterns. (Fisher’s Exact Test, p = 0.310).
In table I, stratified by the characteristics of alcohol use pattern (NA, A2, A3), the variation was different according to sex in results of serum leptin, leptin/BMI and leptin/% BF. For men, there was no statistical difference in the variation of these results related to the alcohol use pattern. Short-time abstainers women (A2) had a significant increase in results of serum leptin, leptin/BMI and leptin/% BF compared to
non-abstinent (Women: Leptin-NA: 16.66 ± 20.12 ×A2:
36.20 ± 17.76 ng/mL; p = 0.04/Leptin/BMI-NA: 0.58 ± 0.58 ×A2: 1.33 ± 0.6, p = 0.02/Leptin/%BF-NA:
0.46 ± 0.46 × A2: 1.08 ± 0.49, p = 0.02; U-Mann Whitney Test). This increase was not observed with the progression of time of abstinence (A3). There was a reduction of the mean values of these parameters between the patterns of abstinence (A2 ×A3).
Long-time abstainers showed amounts of leptin, leptin/BMI and leptin/BF% similar to non-abstaining women. WC variation was the same for men and women. There was an increase in WC mean amounts accor-ding to the length of abstinence, although this varia-tion has not been significant.
There was an increase in WC mean amounts accor-ding to the length of abstinence, although this variation has been significant only between men (NA 80.63 ± 8.81 ×A3 90.4 ± 9.59 cm; p = 0.04).
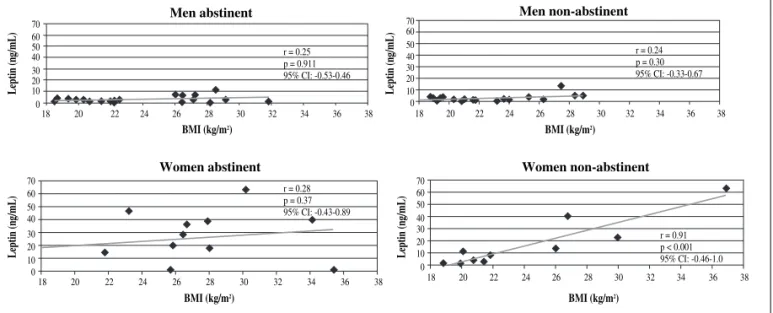
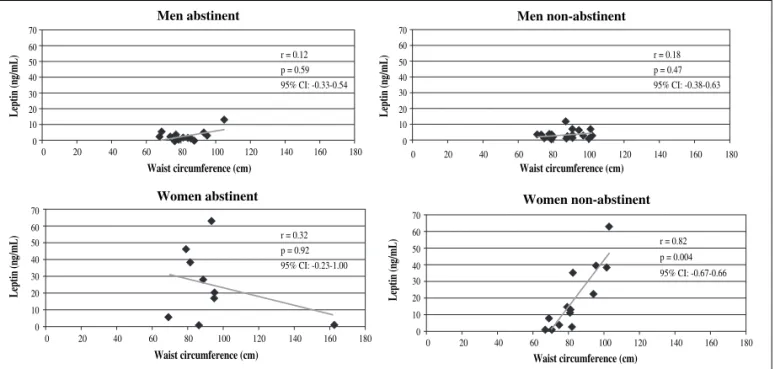
There was a strong positive association between BMI and WC and leptin levels in non-abstinent women [leptin ×BMI: r = 0.91, p < 0.01, 95% CI: (-0.46-1.0);
leptin × WC: r = 0.82, p = 0.004, 95% CI:
(-0.67-0.66)]. Simple linear regression confirmed the increa-sing association between BMI and WC with leptin in active female drinkers [leptin ×BMI R = 0.84, p =
0.002, 95% CI: (0.14-0.40)/leptin ×WC: R = 0.87, p =
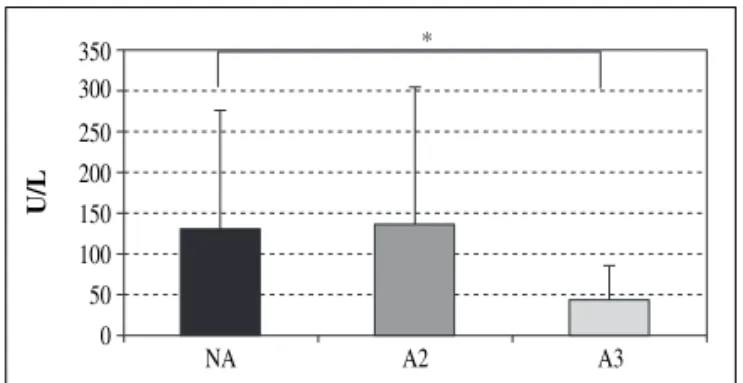
0.001, 95% CI: (0.06-0.13)]. However, there was no significant association between these results in absti-nent women (leptin ×BMI: r = 0.28, p = 0.37, leptin X WC: r = -0.32, p = 0.923). There was no association for abstaining and non-abstinent men. The results of corre-lation and linear regression between leptin and %BF were similar to values presented between leptin and BMI for men and women and their alcohol use pattern. Gamma-glutamyltransferase levels were within the reference values among longtime abstaining partici-pants (A3), and were significantly lower than the mean values for non-abstinent and short-time abstainers (A2). The short-time abstainers (A2) had similar values to those participants who still kept consuming alcohol
Leptin level in abstaining
alcohol-dependent women 785
Nutr Hosp. 2012;27(3):781-788
Fig. 2.—Serum leptin levels according to Body Mass Index (BMI) in men and women abstinent and non-abstinent alcoholics.
Men abstinent Men non-abstinent
70 60 50 40 30 20 10 0
Leptin (ng/mL)
70 60 50 40 30 20 10 0
Leptin (ng/mL)
BMI (kg/m2)
r = 0.25 p = 0.911 95% CI: -0.53-0.46
r = 0.24 p = 0.30 95% CI: -0.33-0.67
18 20 22 24 26 28 30 32 34 36 38
Women abstinent Women non-abstinent
70 60 50 40 30 20 10 0
Leptin (ng/mL)
70 60 50 40 30 20 10 0
Leptin (ng/mL)
BMI (kg/m2)
r = 0.28 p = 0.37 95% CI: -0.43-0.89
r = 0.91 p < 0.001 95% CI: -0.46-1.0
18 20 22 24 26 28 30 32 34 36 38
BMI (kg/m2)
18 20 22 24 26 28 30 32 34 36 38
BMI (kg/m2)
(A2: 136.97 ± 166.93 ×NA: 130.52 ± 144.88 U/L; p =
0.47). These results confirm the withdrawal state reported by the participants (fig. 3).
Discussion
The results of this study indicate that serum levels of leptin, leptin /BMI and leptin/% BF were significantly increased in early abstinence women. Mean value of BMI and WC were higher among participants absti-nent.
Alcohol dependence affects 12.3% of Brazilians living in the 108 largest cities in the country, with highest incidence among men. 24 In our study, we found a higher prevalence of men in attendance in the CAPSad (n = 42, 64.6%). This number is similar to other studies, such as Siqueira et al. (2005)25who found 85.5% of male patients in their sample of 216 patients in the Care Program Alcoholism.
Nutritional status assessed by BMI, % BF and WC of alcoholic patients indicates that there might be a tendency to gain weight, with accumulation of visceral fat between abstaining men and women. Other studies have reported changes in anthropometric alcoholics hospitalized with weight gain during abstinence.26,27 Krahn et al. (2006),26followed male alcoholics deter-mining the body weight at the beginning (1 month) and after 6 months of the study. Abstaining subjects gained 25.9 pounds in 6 months and non-abstaining subjects gained 4.9 pounds, but this was not a significant diffe-rence. Our study evaluated mean levels of body weight, BMI, % BF and WC in abstaining and non-abstaining men and women. Abstaining men and women had mean values of BMI and WC higher than the non-absti-nent, especially the longtime abstainers (A3).
Weight gain in the process of abstinence can be attri-buted to improved nutritional quality of food consumed, once the nutritional status of alcoholics is impaired due to the calorie-wasting effect of ethanol itself.28However, our results indicate an increase of abdominal adiposity during abstinence, increasing the risk of developing cardiovascular disease. Current studies have not evaluated the change in the pattern of alcohol consumption associated with changes in food consumption and nutritional status in alcoholics. Thus, studies that evaluate the process of abstinence, weight gain and food consumption changes should be conducted for better understanding.
In this study, the data suggests the importance of a nutritional counseling program during abstinence to avoid development of obesity and its related chronic diseases.
There was a strong and significant association between the values of leptin, BMI and % BF only in non-abstaining women, indicating a positive influence on body fat in leptin levels. This association was not found among abstaining women, although the groups A2 and A3 present a higher prevalence of overweight, 67% and 83.3% respectively. However, the results of this study showed that there is a tendency for a signifi-cant increase in leptin levels in the first phase of absti-nence. The higher leptin levels in recent abstaining women (A2), even after adjustment for BMI and % BF, can be explained by other factors than the highest concentration of body fat, as the history of chronic alcoholism itself. Abstinence process may induce pathophysiological mechanism changes, yet unknown, possibly inducing a higher sensitivity of fat tissue to release leptin. Such sensitivity can be seen by the higher proportion of leptin expressed per unit of BMI and % BF. Leptin levels between longtime abstaining
Fig. 3.—Serum leptin levels according to waist circumference in men and women abstinent and non-abstinent alcoholics.
Men abstinent Men non-abstinent
70 60 50 40 30 20 10 0
Leptin (ng/mL)
70 60 50 40 30 20 10 0
Leptin (ng/mL)
Waist circumference (cm)
r = 0.12 p = 0.59 95% CI: -0.33-0.54
r = 0.18 p = 0.47 95% CI: -0.38-0.63
0 20 40 60 80 100 120 140 160 180
Women abstinent 70
60 50 40 30 20 10 0
Leptin (ng/mL)
Waist circumference (cm)
r = 0.32 p = 0.92 95% CI: -0.23-1.00
0 20 40 60 80 100 120 140 160 180
Women non-abstinent 70
60 50 40 30 20 10 0
Leptin (ng/mL)
Waist circumference (cm)
r = 0.82 p = 0.004 95% CI: -0.67-0.66
0 20 40 60 80 100 120 140 160 180
Waist circumference (cm)
(A3) were close to the levels of non-abstaining men and women.
The first three months are critical for maintaining abstinence because more than 70% relapse in these months of treatment and this fact must be understood as a process inherent the abstinence.29Leptin has been studied as an important neuroactive agent in the chemical dependency.30The dopaminergic action on the mesolimbic reward circuit involving motivation, desire and memory are directly inhibited by leptin.31,32
In normal individuals, moderate amounts of alcohol have an inhibiting effect on leptin secretion.33However, there is evidence that serum leptin levels are increased by chronic alcoholism.12In abstaining alcoholics, the increase in leptin levels in the first months of absti-nence appears to correlate with the craving for alcohol and may precede the relapse of alcohol consumption.34
Kiefer et al. (2005)34followed patients in alcoholic detoxification, for 12 weeks, and evaluated the leptin levels at baseline and after 4, 8 and 12 weeks. Patients who relapsed between the eighth and twelfth weeks had leptin increase up until the 12thweek, while those who remained abstinent, reduced leptin in the same period. In our study, women with abstinence up to 12 weeks showed a level of leptin higher than more than 3 months abstainers. This result indicate that the increase in leptin is associated with an early relapse or with increased risk of relapse, and the reduction of leptin levels is associated with a longer abstinence.
Kiefer et al. (2001)10found increased levels of leptin in alcohol dependent patients at the onset of abstinence as compared with healthy controls. However, the authors did not assess the results of men and women separately as in the present study. A separate assessed by sex is justified once the serum concentration of leptin is influenced by testosterone levels and body fat distribution, so women have higher leptin levels than men.3,4
A later study of Kraus et al. (2004)8 showed the direct relation between leptin concentration and craving for alcohol in a sample of women suffering from alcoholism. These results were similar to our study, with increased levels of leptin associated with abstinence in women only, with evaluations timed at
days 0, 1, 2, 7 and 10 days of abstinence. Djurovic et al. (2007)15found an increase in leptin levels in women only after 3 weeks of abstinence from alcohol.
Leptin is produced by adipocytes. However, the decline in these levels after a longer period of absti-nence (≥ 4 months), despite the maintenance of obesity
(BMI), suggests the possible action of leptin in the reward system at the beginning of abstinence as a factor that influences the craving for the drug. But we cannot affirm this fact because we have not assessed the degree of craving of these female dependents.
Our study has some limitations. The cross-sectional design did not allow to assign causal effect between the process of abstinence, change in body weight and leptin levels. Because it was a study in an open institu-tion, where volunteers are not admitted, it was not possible to control a homogeneous time of abstinence, once monitoring was done during the visits in the insti-tution. However, GGT serum, commonly used as a biomarker of high use of alcohol,35confirmed the absti-nence state reported by participants. Another limitation of this study was to evaluate the body fat percentage by validated formulas. There are more accurate techniques such as bioelectrical impedance analysis, although it requires a rigorous protocol to be followed, such as abstinence from alcohol for 24 hours,36which is not practical the use of this technique in patients non absti-nent. The dual-energy X-ray absorptiometry (DEXA) is a laboratory equipment with high accuracy of the assessment of body fat. It is the gold standard for this evaluation. However, there were not DEXA available to use in this study.
Conclusion
The results indicate that only women had higher serum leptin levels, and this alteration may be subject to the length of abstinence and higher risk of relapse. These results do not support the hypothesis of altera-tion of nutrialtera-tional status on alcohol abstinence because it is a cross-sectional study that did not track the change of nutritional status in the process of abstinence. However, abstaining men and women had higher values of BMI and % BF than non-abstainers. Besides the leptin, the specificities of each psychotropic drug, the individual characteristics of addicts, as well as differences between the sexes and the length of absti-nence, may influence craving and relapse, and should be evaluated as determinants of influence in the neuro-biology of craving.
Acknowledgements
We are grateful to Post-Graduate Studies and Rese-arch Office/PROPP-UFOP, School of Nutrition/UFOP, LAPAC/UFOP, CAPSad Ouro Preto,MG, and George Luiz Lins Machado Ribeiro, Ivo Santana Caldas, Ana
Leptin level in abstaining
alcohol-dependent women 787
Nutr Hosp. 2012;27(3):781-788
Fig. 4.—Mean levels of Gamma-glutamyltransferase (GGT) in alcoholics according to the pattern of alcohol. NA (non-absti-nent), A2 (1-3 month abstainer), A3 (4 month or more abstai-ner). *p < 0.05 (U-Mann Whitney Test).
350 300 250 200 150 100 50 0
U/L
Carolina Volp, Izabelle de Sousa Pereira, Karine Aparecida Louvera Silva, Fernando Bretas and Késia Diego Quintaes, tutor and students of PET-Saúde/ Nutrição/UFOP for contributing to this work.
References
1. Ahima RS, Flier JS. Leptin. Annu Rev Physiol2000; 62: 413-37.
2. Friedmann JM, Halaas JL. Leptin and the regulation of body weight in mammals. Nature1998; 395: 763-70.
3. Rosenbaum M, Nicolson M, Hirsch J, Heymsfield SB, Gallag-her D, Chu F et al. Effects of gender, body composition and menopause on plasma concentration of leptin. J Clin Endocri-nol Metab1996; 81: 3424-7.
4. Blum WF, Englaro P, Hanitsch S, Juul A, Hertel NT, Muller J et al. Plasma leptin levels in healthy children and adolescents: dependence on body mass index, fat mass, gender, pubertal stage, and testosterone. J Clin Endocrinol Metab1997; 82: 2904-10.
5. Rosado EL, Monteiro JB, Chaia V, Lago MF. Efecto de la lep-tina en el tratamiento de la obesidade influencia de la dieta en la secreción y acción de la hormona. Nutr Hosp2006; 21: 686-93. 6. Tena-Sempere M, Barreiro ML. Leptin in male reproduction:
the testis paradigm. Mol Cell Endocrinol2002; 188: 9-13. 7. Carr KD. Augmentation of drug reward by chronic food
restric-tion: behavioral evidence and underlying mechanisms. Physiol Behav2002; 76: 353-64.
8. Volkow ND, Wise RA. How can drug addiction help us unders-tand obesity? Nature Neurosci2005; 8: 555-60.
9. Palmiter RD. Is dopamine a physiologically relevant mediator of feeding behavior? Trends Neurosci2007; 30: 375-81. 10. Kiefer F, Jahn H, Jaschinski M, Holzbach R, Wolf K, Naber D
et al. Leptin: a modulator of alcohol craving? Biol Psychiatry
2001; 49: 782-7.
11. Hillemacher T, Bleich S, Frieling H, Schanze A, Wilhelm J, Sperling W et al. Evidence of an association of leptin serum levels and craving in alcohol dependence. Psychoneuroendo-crinology2007; 32: 87-90.
12. Nicolas JM, Fernández-Solà J, Fatjó FR, Casamitjana R, Bata-ller E, Sacanella E et al. Circulating Leptin Levels in Chronic Alcoholism. Alcohol Clin Exp Res2001; 25: 83-8.
13. Ahima RS, Flier JS. Adipose tissue as an endocrine organ.
Trends Endocrinol Metab2000; 11: 327-31.
14. Kraus T, Reulbach U, Bayerlein K, Mugele B, Hillemacher T, Sperling W et al. Leptin is associated with craving in women with alcoholism. Addict Biol2004; 9: 213-9.
15. Djurovic S, Berge KE, Birkenes B, Braaten O , Retterstol L. The effect of red wine on plasma leptin levels and vasoactive factors from adipose tissue: a randomized crossover trial. Alco-hol AlcoAlco-hol2007; 42: 525-8.
16. Molina PE, Hoek JB, Nelson S, Guidot DM, Lang CH, Wands JR et al. Mechanisms of Alcohol-Induced Tissue Injury. Alco-hol Clin Exp Res2003; 27: 563-75.
17. Lieber CS. Alcohol and the liver:1994 update. Gastroentero-logy1994; 106: 1085-1105.
18. Wannamethee SG, Shaper AG. Alcohol, body weight, and weight gain in middle-aged men. Am J Clin Nutr2003; 77: 1312-7.
19. World Health Organization (WHO). Obesity: preventing and managing the global epidemic. Report of a WHO Consulation. Geneva: World HealthOrganization; WHO Technical Report Series 894, 1998.
20. Das KD, Vasudevam DM. Biochemical diagnosis of alcoho-lism. Indian J Clin Biochem2005; 20: 35-42.
21. Lohman TG, Roche AF, Martorell R. Anthropometric standar-dization reference manual. Abridged Edition.Champaign, Illi-nois: Human Kinetics Books; 1991.
22. Lohman TG. Advances in body composition assessment. Champaign: Human Kinetics Publishers; 1992.
23. Callaway CW, Chumlea WC, Bouchard C, Himes JH, Lohman TG, Martin AD, et al. Circumferences. In: Lohman TG, Roche AF, Martorell R. Anthropometric standardization reference manual. Champaign, IL: Human Kinetics; 1988, pp. 39-54. 24. Carlini EA, Galduróz JCF, Noto AR, Fonseca AM, Carlini CM,
Oliveira LG, et al. II levantamento domiciliar sobre o uso de drogas psicotrópicas no Brasil: estudo envolvendo 108 maiores cidades do país.São Paulo: Centro Brasileiro de Informações sobre drogas psicotrópicas-CEBRID; 2006. 468 p.
25. Siqueira MM, Garcia MLT, Souza RS. O impacto das faltas às consultas em um programa de dependentes de alcool. J Bras Psiquiatr 2005; 54 (2): 114-9.
26. Krahn D, Grossman J, Henk H, Mussey M, Crosby R, Gosnell B. Sweet intake, sweet-liking, urges to eat, and weight change: relationship to alcohol dependence and abstinence. Addict Behav2006; 31: 622-31.
27. Dias AP. Estado nutricional de alcoolistas crônicos na inter-nação e na alta médica, em um hospital psiquiátrico [Disserta-tion] Programa de Pós-Graduação em Alimentos e Nutrição, Faculdades de Ciências Médicas: Universidade Estadual Pau-lista Júlio Mesquita, 2007.
28. Pirola RC, Lieber CS. The energy cost of the metabolism of drugs, including alcohol. Pharmacology1972; 7: 185-96. 29. Miller WR, Rollnick S. Entrevista motivacional: preparando as
pessoas para a mudança de comportamentos adictivos. Porto Alegre: Artmed; 2001.
30. Zupancic ML,Mahajam A. Leptin as a neuroactive agent. Psy-chosom Med2011; 73: 407-14.
31. Harvey J. Leptin regulation of neuronal excitability and cogni-tive function. Curr Opin Pharmacol 2007; 7: 643-7.
32. Morrison CD. Leptin signaling in brain: a link between nutri-tion and cogninutri-tion? Biochim Biophys Acta2009; 1792: 401-8. 33. Röjdmark S, Calissendorff J, Brismar K. Alcohol ingestion
decreases both diurnal and nocturnal secretion of leptin in healthy individuals. Clin Endocrinol2001; 55: 639-47. 34. Kiefer F, Holger J, Otte C, Demiralay C, Wolf K, Wiedemann
K. Increasing leptin precedes craving and relapse during phar-macological abstinence maintenance treatment of alcoholism.
J Psychiatr Res2005; 39: 545-51.
35. Carvalho FM, Neto MAS, Mendes JLB, Cotrim HP, Nasci-mento ALS, Junior ASL et al. Alteração de Enzimas Hepáticas em Trabalhadores de Refinarias de Petróleo. Rev Saúde Pública
2006; 40: 92-8.