Water Distribution Schedule under Warabandi
System considering Seepage Losses for an
Irrigation Project-A case Study
Sunil Ajmera
Associate Professor, SGSITS, Indore Civil Enginering and Applied Mechanics Department,
SGSITS, 23, Park Road, Indore- 452003, M.P., India
Dr. R.K.Shrivastava
Professor, SGSITS, Indore
Civil Enginering and Applied Mechanics Department, SGSITS, 23, Park Road, Indore- 452003, M.P., India
Abstract: Warabandi system of water distribution is followed for canal irrigation system at many parts in India including Madhya Pradesh. It is observed that tail end fields receive less amount of water compared to fields situated at or near the head of water courses. This is because of seepage losses in unlined water courses. For improving the water supply for the tail end fields considering seepage losses, an attempt has been made in the present study for modification in Roster of conventional Warabandi System for achieving equitable water distribution under existing land holdings in the command area of a minor canal of Choral projects in Madhya Pradesh.
Key words: Water Distribution Schedule, Warabandi, Modified Warabandi, Seepage Losses, Chak, Evapotranspiration.
I. INTRODUCTION:
Important aspect of irrigation management requires Efficient and fair distribution of water. Water distribution methods affect the performance of Irrigation system and ultimately affect the water use efficiency of the project. Main aim of irrigation system operation is to supply the water as and when it is required. The art and the science of the distribution of water over the time and space are termed as Irrigation Scheduling. For deciding the amount of irrigation and its scheduling it is necessary to calculate crop water requirement considering climatic and soil water relationship. This requires calculation of consumptive use of water by crop over the growth period.
II. STUDY AREA
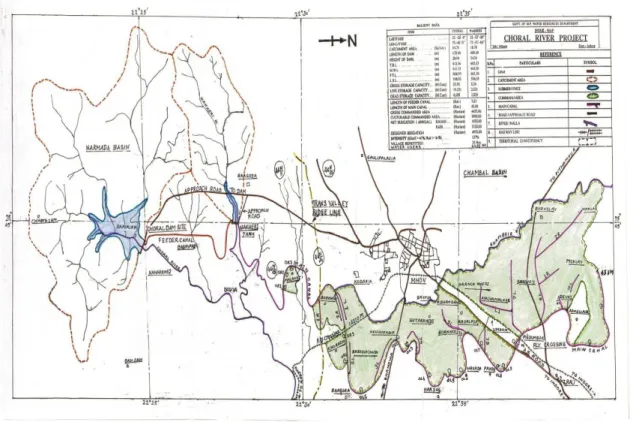
The Choral River Project situated near Mhow Tehsil of Indore under Water Resources Deptt. of M.P. has been considered as a case study for obtaining Water distribution Schedule for 1LMinor in the Command Area in the present study. Choral River a tributary of River Narmada, originates from Vindhyan ranges and flows through Indore and Khargone districts. The Choral Reservoir is located in Rampuriya village under Mhow Tehsil of Indore district. The latitudes and longitudes of the project site are 75°46’N and 22°25’E respectively. The index map of the Choral Project is shown in Figure1. The site of Choral Reservoir is situated at a distance of 15 kms from Mhow by road. It is a trans-basin diversion project having command area under Chambal basin and catchment area under Narmada basin. Earthen dam of height 27.82m is constructed across the river having gross storage of 21.91 million cubic meters (MCM) with live storage capacity of 17.21 MCM and Dead storage capacity of 4.7 MCM. The cropping pattern under the project is given in table 1. The command area under 1-L minor is 271 hectare. The entire command area under this minor consists of small holdings of individual farmers; the smallest area of holding is 1.468 hect. and the largest holding area is 6.152 hect. The command area under this minor is divided into seven Chaks and the details of holdings under these Chaks are given in table 2. The position of outlets for different Chaks is shown in Figure 2.
Figure 1. Choral River Project
Table 1. Details of Crop Pattern in Command Area under study
Particulars Area in Hectares Kharif Crop:
a. Maize 20
b. Jower 15
c. Ground Nut 5
d. Vegetable 7
Rabi Crop:
a. Wheat 2145
b. Gram 234
c. Potato 585
d. Onion 78
e. Vegetable 78
Table 2. Details of area of Holdings in Hectares under 1-L Minor
S. No A B C D E F G
1 2.654 2.46 2.30 3.009 1.920 2.418 2.312
2 1.650 2.663 4.80 2.271 2.413 3.238 5.090
3 2.442 2.295 1.98 1.849 2.970 3.471 3.390
4 3.821 2.016 3.39 2.189 2.100 2.249 2.816
5 3.110 2.321 3.89 2.457 2.164 2.29 1.521
6 2.970 2.553 1.98 1.829 2.228 2.189 2.720
7 2.704 2.216 1.72 1.957 3.210 2.690 2.612
8 3.092 2.706 4.06 1.942 2.780 1.784 3.772
9 2.282 2.914 2.39 1.854 2.125 3.020 2.660
10 2.111 3.469 2.15 1.864 2.280 1.572 2.835
11 1.793 1.654 2.28 2.474 1.830 2.640 3.623
12 2.463 2.767 1.47 3.253 2.120 2.850
13 2.6 2.01 3.035 3.460 2.810
14 2.182 3.56 3.773 2.224
15 1.854 2.12 1.733 3.102
16 1.584 2.34 2.184
17 6.15 2.710
18 1.84
19 2.78
20 1.65
21 3.13
Total 31.092 38.254 57.96 35.489 26.020 33.14 49.23
III. WARABANDI SYSTEM
The term Warabandi is originated from two vernacular words ‘Wara’ and ‘bandi’. The meaning of wara is ‘turn’ and bandi means ‘fixation’. Taken together, the term Warabandi means rotation of water supply according to a fixed schedule. “Warabandi is a system of equitable water distribution by turns according to a predetermined schedule specifying the day, time and duration of supply to each irrigation in proportion to holdings in the outlet command”
For implementation of Warabandi the following basic requirements are fulfilled:
(1) To provide network of field channel, so as to ensure water to every holding within the Chak. (2) To ensure design discharge in distributory or minor at each outlet.
(3) Farmer’s participation.
A. Terms used in the study:
a. Water Allocations
Each unit of culturable command area is allocated a certain rate of flow of water termed as water allowance, its value is decided after a compromise between demand and supply. The carrying capacity of field channels and water courses is on the basis of this allowance.
b. Capacity Factor
No distributory operates for all the days during a crop, nor is this advisable, if the means of salinity and water logging is to be guarded against. The ratio which the operating period of distributory bears to the total period of the crop is called ‘capacity factor’. This is again a compromise between demand and supply and is separately designed for each of the sub periods of crop. This factor helps in the operation of the distributaries while drawing water from the reservoir.
c. The Chak Units
The command area of an outlet is called Chak. The Chak is a function of the application rate at the field, the peak design irrigation requirement at the outlet and the operating characteristics of the system. The Chak is further divided into sub Chak units for better planning and management.
B. Fixing of Chak
This is an important work if properly done will ensure fair distribution of water in the Chak. The field officers of irrigation department, should survey the Chak at site and fix its boundaries keeping the following points in view:
(1) While fixing the boundaries of the Chak for village, the nallas, C.T. crossing, village boundaries, road, railway line etc. are kept in mind. The area of the Chak islimited upto 60 hectares.
(2) While demarcating the boundaries of the Chak, few extra outlets existing within the Chak shall have to be removed and irrigation ensured from the authorized outlet.
(3) The network of field channels within the Chak should be such that every holding within a Chak is connected by field channel.
C. The Irrigation Channel
minimize the seepage loss. The alignment of a water course is made in such a way that it touches each holding and provides one point for delivery to each holding. This delivery point is called Nakka and the Warabandi roster is framed with respect to their Nakka. Water from a water course through field channel is allocated to farmer in the ratio of their holding on 7 days week basis, for the sake of equity and proper monitoring all water courses must be run full for such 7 days period.
D. Management of Warabandi System
The distribution of water in Warabandi system is of two tier operation and each is managed by a separate agency. In the upper tier which is managed by the state, all distributaries and consequently water courses are always operated at full and not partial discharges. This results in minimizing the running time and conveyance losses in distributaries. The distribution of water coming out of an outlet and flowing into a water course is the second tier of distribution and this is managed by the cultivator and the state employees. The distribution of water is done on seven days rotation basis with the help of an approved roster.
Whenever a distributory is in operation a water course receives an authorised share of water at a constant rate round the clock and water distribution proceeds from head to tail. The time rotation once started, continues even when the distributory is closed and there is no water in a water course. Thus each cultivator is entitled to receive the entire water in a water course only on a specific week day and at a specific time including night time. A schedule of water supply indicating the time of starting and closing to a particular land holding is known as Roster of turns. There is no provision in this system to compensate any individual farmer who may fail to receive his turn or share of water for any reason, because there is no unalloted time.
E. Flow Time with Conventional Warabandi System
Before a farmer can receive his share of water, he must have spent some time filling up his water course between the point of his taking over to the point of delivery. This time is called Bharai, in the present case, it’s value is taken as 16.76 meter per minute.
The cycle of turns on a water course or its branch starts from its head, proceeds downward and ends at its tail. The supply has to be cutoff from the head when the last farmer having his turn, the length of upper position which has been filled with common pool time (Bharai) can be discharged only into his field and normally the total time spent on its filling should be recovered from him in lieu of this, but he does receive all this water at a constant rate. When the supply is cuts off from head, it starts depleting at tail and gradually approaches zero. Such a supply, beyond a limit is not efficient from the point of view of field application. The farmer needs to be compensated for it and this is done be allowing a certain discount on the recovery Bharai time, the discounted value of ‘Bharai’ is known as ‘Jharai’. After allowing amendment for Bharai and Jharai, the flow time (F.T.)for unit area and for an individual farmer are given by the following equations:
And
F. Flow Time with Modified Warabandi System
Flow rate available at the head points of different fields do not correspond to the outlet’s discharge rate, owing to the seepage losses in water courses. Hence, it is essential to account for the seepage losses in respect of different fields to determine the actual flow rate reaching at their fields. The seepage losses vary greatly with time and from soil to soil and, therefore, need to be determined in situ. Seepage losses also depend on the antecedent moisture condition of the soil of the channel. The losses will be more if the interval between consecutive uses of channel is more.
The flow rates reaching the head points of different fields is given by –
Where, Qi = Flow rate reaching to ithfield (m3/hr). Qo = Flow rate of the outlet (m3/hr).
S = Seepage rate (cumecs per million sq.m. of wetted area). P = Average wetted perimeter of the water course (m). Wli = Length of water course connecting i
th
field with the outlet (m). The seepage factor is the ratio of flow rate of the outlet and the flow rate reaching a field.
Thus,
Net allotted time for different fields determined as per conventional Warabandi rostering procedure(NTi)were multiplied by the corresponding seepage factor andthe values of revised net allotted time (RTi) were determined as follows:
After determining the revised net allotted time for different field in the command area of an outlet, a correction factor (CF) is determined as follows:
Corrected net irrigation time (CT) for different fields are determined by multiplying their revised net allotted time by the correction factor as follows:
Total time allotted for each field (TTi) is finally determined as follows:
Where, Fi = Bharai Time, and
Di = Jharai Time. From this value of time, the Roster is prepared.
G. Roster of Turn
The turns are fixed on the basis of first come, first served basis from head to tail. The operation of the schedule present no difficulty. A farmer understands that there will be no compensation for a missed turn and, hence, missing even a part of the turnis avoided. The water will be kept open for such a duration so that about 50% of the water requirement of crops of the sub Chak will be fulfilled. At the same time the remaining turnout of the same Chak will be kept closed. In this way in one turn of 7 days all the sub- Chaks of the same Chak will get about 50% of the fortnightly water requirement. In second rotation, or round of seven days fortnightly crop water requirement of the chak will be fulfilled.
IV. CROP WATER REQUIREMENT
. “Crop Water Requirements” have been worked out for the various crops considered for the project area. Estimation of the irrigation water requirement involves the determination of Special needs (SPL), Crop evapotranspiration (ETc), Crop factor (kc), Reference crop evapotranspiration (ETo) and Effective rainfall (ER) of the project area. The SPL value for individual crops has been determined using prevailing practice in the Water Resources Department, Govt. of M.P.
The FAO Penman-Monteith method (Allen et al., 1998) is used for the computation of Reference crop evapotranspiration (ETo) from meteorological data in the vicinity of the Project Area. The estimated values of ETo have been further multiplied by crop factor Kc to get the crop evapotranspiration (ETc) for individual crops. The value of crop factor “kc” has also been taken from the FAO-56/Agriculture department.
The estimation of crop evapotranspiration ETc consists of:
1. Identifying the crop growth stages determining their length and selecting the corresponding Kc factor. 2. Constructing the crop curve to determine Kc value for any period during the growth period.
3. Calculating stage wise ETc as the product of ETo and Kc.
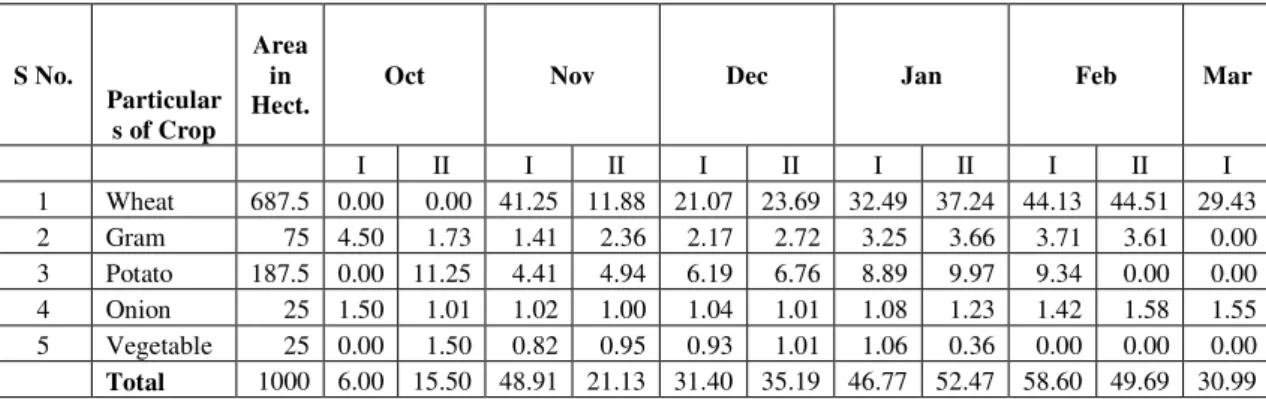
Table no 3. Gross Water requirement of Crop in Ha. m. for a plot of 1000 Ha. Area
V. PLANNING ANALYSIS AND COMPUTATION
A. Channel Network
The peak water requirement has been calculated at the outlet utilizing the maximum value of fortnightly water requirement for Rabi season which is 58.60 ha m. for I fortnight of February. The value of field channel efficiency and field application efficiency each are taken as 90%, in addition 2% allowance for losses is also added .Considering the same, the value of peak discharge required in water course at the head of minor would be 0..610 lit/sec/Ha..
B. Fixing of chaks
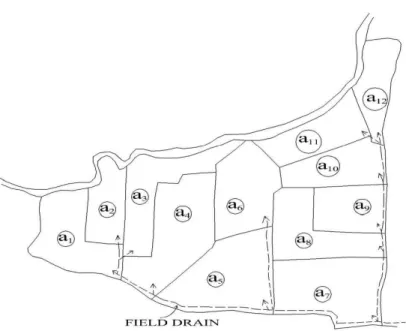
The Chaks and sub Chaks have been fixed on the guidelines as detailed in Para III. B.In all seven Chaks have been considered for the design of modified Warabandi system under 1-L minor of Choral Project. TheLayout of Chak ‘A’ is shown in Fig. 3
C. Design Computations
a. Parameters for water course and field channel design
The total area considered for planning is divided into Chaks and sub Chaks. After finalizing these, the alignment of the water course and field channel network have been determined . The water course and the field channel has been designed with a capacity of 0.61 lit/sec/Ha. The bed width is kept 0.30 m., depth of water is taken as 0.20 m, side slope is kept 1.5:1and wetted parimeter as 1.021m. There is no provision of lining of water course as well as field channel. The value of rugosity constant is adopted as 0.018. The field drains and collecting drains have been aligned according to topography of land. The Layout of water course and the field channel for a Chak ‘A’ is shown in Figure 3
S No.
Particular s of Crop
Area in Hect.
Oct Nov Dec Jan Feb Mar
I II I II I II I II I II I
1 Wheat 687.5 0.00 0.00 41.25 11.88 21.07 23.69 32.49 37.24 44.13 44.51 29.43
2 Gram 75 4.50 1.73 1.41 2.36 2.17 2.72 3.25 3.66 3.71 3.61 0.00
3 Potato 187.5 0.00 11.25 4.41 4.94 6.19 6.76 8.89 9.97 9.34 0.00 0.00
4 Onion 25 1.50 1.01 1.02 1.00 1.04 1.01 1.08 1.23 1.42 1.58 1.55
5 Vegetable 25 0.00 1.50 0.82 0.95 0.93 1.01 1.06 0.36 0.00 0.00 0.00 Total 1000 6.00 15.50 48.91 21.13 31.40 35.19 46.77 52.47 58.60 49.69 30.99
Figure 3. Layout of Subchaks,Water Course and Field Drains for Chak-A
D. Roster Computations for Conventional Warabandi
The allocation of turn is done so as to allot to each farmer a volume of water proportionate to area of land holdings in an outlet command. The proposed water management envisages the running of the entire conveyance system with respect to full supply discharge in all channels during the peak demand periods. The main canal, minors and water courses will be running full for 14 days in a fortnight. The complete roster has been prepared for Chak ‘A’ is shown in Table 4, similar computations are made for the other Chaks also.
E. Roster Computation for Modified Warabandi Method
Table 4. Water Distribution Schedule under Conventional and Modified Warabandi System for Chak – A
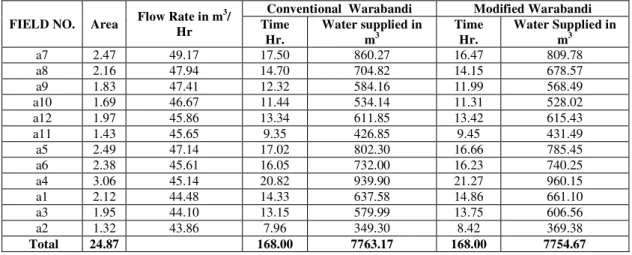
Table 5. Comparison of Water Distribution Schedule under Conventional and Modified Warabandi System for Chak – A
FIELD NO. Area Flow Rate in m
3
/ Hr
Conventional Warabandi Modified Warabandi Time
Hr.
Water supplied in m3
Time Hr.
Water Supplied in m3
a7 2.47 49.17 17.50 860.27 16.47 809.78
a8 2.16 47.94 14.70 704.82 14.15 678.57
a9 1.83 47.41 12.32 584.16 11.99 568.49
a10 1.69 46.67 11.44 534.14 11.31 528.02
a12 1.97 45.86 13.34 611.85 13.42 615.43
a11 1.43 45.65 9.35 426.85 9.45 431.49
a5 2.49 47.14 17.02 802.30 16.66 785.45
a6 2.38 45.61 16.05 732.00 16.23 740.25
a4 3.06 45.14 20.82 939.90 21.27 960.15
a1 2.12 44.48 14.33 637.58 14.86 661.10
a3 1.95 44.10 13.15 579.99 13.75 606.56
a2 1.32 43.86 7.96 349.30 8.42 369.38
Total 24.87 168.00 7763.17 168.00 7754.67
Field No Area 'Ha' Serving length of water course M Water course filling time 'Hr' Water course drain time Hr Net allotted time Hr Total Time Hr. Expected flow Rate m3/ Hr Revised net allocated time Hr Corrected net allocated time Hr Total allocated time Hr
Filling Drain (NTi) (Qi) (RTi) ( CTi) (TT i)
a7 2.474 926 0 0.92 0 16.58 17.50 49.17 18.41 15.55 16.47
a8 2.163 210 0 0.21 0 14.49 14.70 47.94 16.51 13.94 14.15
a9 1.826 90 0 0.09 0 12.23 12.32 47.41 14.09 11.90 11.99
a10 1.689 126 0 0.13 0 11.31 11.44 46.67 13.24 11.18 11.31
a12 1.970 138 0 0.14 0 13.20 13.34 45.86 15.72 13.28 13.42
a11 1.434 36 600 0.04 0.3 9.61 9.35 45.65 11.50 9.71 9.45
a5 2.488 346 0 0.35 0 16.67 17.02 47.14 19.31 16.31 16.66
a6 2.376 260 260 0.26 0.13 15.92 16.05 45.61 19.06 16.10 16.23
a4 3.057 340 0 0.34 0 20.48 20.82 45.14 24.78 20.93 21.27
a1 2.123 113 0 0.11 0 14.22 14.33 44.48 17.47 14.75 14.86
a3 1.954 64 0 0.06 0 13.09 13.15 44.10 16.22 13.69 13.75
a2 1.320 41 1830 0.04 0.92 8.84 7.96 43.86 11.01 9.30 8.42
TOTAL 24.874 2690 2690 2.69 1.35 166.66 168.00 197.34 166.66 168.00
V. CONCLUSION
The results of Roster for Conventional Warabandi and Modified Wrabandi system are shown in Table 5 for a Chak under 1L minor of canal project i.e. the study area. It reveals from the results that the rescheduling of timing as obtained using Modified Warabandi system considering seepage losses in serving length of the channel will provide adequate water as per requirement even to the farmers at the tail end, which was not possible with Conventional Warabandi System
REFERENCES
[1] Ambert, s.et. al(1990). “Performance Evaluation of Water Delivery System in a Unit Comm. And area”, Paper published in Journal of I.W.R.S., Vol. 10,Number 2, April 1990.
[2] D.P.R. Choral Project (1979). Irrigation Deptt. , Govt. of M.P. India.
[3] FAO. (1979). Yield response to water. Irrigation and Drainage Paper No. 33. Rome
[4] FAO. ( 1992).CROPWAT. A computer program for irrigation planning and management. Irrigation and Drainage Paper No. 46. Rome. [5] FAO. (1993).CLIMWAT for CROPWAT. A climatic database for irrigation planning and management.Irrigation and Drainage Paper No.
49. Rome.
[6] FAO. (1998).Crop evapotranspiration; guidelines for computing crop water requirements. Irrigation and Drainage Paper No. 56. Rome. [7] Hillel, D., Krentos, V. & Stilianov Y. (1972).Procedure and test of an internal drainage method for measuring soil hydraulic characteristics
in situ. Soil Science, 114: 395-400.
[8] IAEA. (1996). Nuclear techniques to assess irrigation schedules for field crops. IAEA-TECDOC-888. Vienna.
[9] Jensen, M.E. (1974) .(ed.) Consumptive use of water and irrigation water requirements. Rep. Tech. Com. on Irrig. Water Requirements, Irrig. and Drain. Div., ASCE, 227 pp.
[10] Kang, S., Shi, W. & Zhang, J. ( 2000). An improved water-use efficiency for maize grown under regulated deficit irrigation. Field Crops Research, 67: 207-214.
[11] Kemp, P. (1996) New war of words over scarce water. Middle East Economic Digest 49: 2-7.
[12] Kirda, C., Moutonnet, P., Hera, C. & Nielsen, D.R. (eds.) ( 1999).Crop yield response to deficit irrigation. Dordrecht, The Netherlands, Kluwer Academic Publishers.
[13] Libardi, P.L., Reichardt, K., Nielsen, D.R. & Biggar, J.W. (1980).Simple field methods for estimating soil hydraulic conductivity. Soil Science Society of America Journal, 44: 3-7.
[14] Molden, D. J. and Gates, T. K. (1990). “Performance measures for evaluation of irrigation water delivery systems.” Journal of Irrigation and Drainage Engineering, ASCE, 116(6), 804-823.
[15] Mannocchi, F. & Mecarelli, P. (1994). Optimization analysis of deficit irrigation systems. Journal of Irrigation and Drainage Engineering,
120: 484-502.
[16] Rao, N. H., Sarma, P. B. S., & Chander, S. (1988).”Irrigation scheduling under a limited water supply”. Agriculture Water Manage.15, 165-175.
[17] Reca, J., Roldan, J., Alcaide, M., Lopez, R., &Camacho, E. (2001).”Optimization model for water allocation in deficit irrigation systems: II.Application to the bembezar irrigation system”. Agriculture Water Manage.48, 117-132.
[18] Rajput and Michael (1989). “Development of an integrated canal scheduling model”. Journal of Irrigation and Power, CBIP, 46(2), 23-39. [19] Santhi, C. and Pundarikanthan, N. V. (2000). “A new planning model for canal scheduling of rotational irrigation”, Journal of Agricultural
and Water Management, 43, 327-343.
[20] Sanimer, K., Srivastava, D.K. and Arya D. S.(2011). “Some Limitations of a Planning Model for Canal Scheduling of Rotational Irrigation”, Journal of Earth Sciences and Engineering, 04(06), PP 286-289.
[21] Singh, K.K.1980. “Warabandi for Irrigated Agriculture in India”, Publication No. 146, Central Board of Irrigation and Power, New Delhi. [22] Singh, R., Soni, B. & Changkakoti, A. K. (1987).”Optimal utilization of irrigation water in garufella catchment in Assam, India”. Irrigation
and water allocation, IASH publ. no. 169,195-205.
[23] Smout, I. K., and Gorantiwar, S. D. (2005).”Multilevel approach for optimizing land and water resources and irrigation deliveries for tertiary units in large irrigation schemes.I: Method”.Transaction ASCE, 131,254-263.
[24] Tongongar, B, Chun-E Kan and Jin-Hwua Chen (2008). “Distribution Factor Technique for Water Allocation in Rotational Irrigation.” Journal of Agriculture & Environmental Science, 3 (3), 474-484.
[25] Vaux, H.J. & Pruitt W.O. (1983. Crop-water production functions. In: D. Hillel, ed.Advances in irrigation, Volume 2, p. 61-93. New York, United States of America, Academic Press.
[26] Vedula, S., Ramesh, T. S. V. and Mujumdar, P. P. (1993). “Real-time irrigation scheduling” Internat ional Conference on Environmentally Sound Water Resources Utilization, Bangkok, Thailand, 25-31.