Engineering
ISSN: 1809-4430 (on-line)
_________________________
1Part of the Master of the First Author
3Federal University of Campina Grande / Campina Grande - PB, Brazil.
4Federal Institute of Education, Science and Technology Baiano / Salvador - BA, Brazil. 5State University of São Paulo - "Julio de Mesquita Filho" / Botucatu - SP, Brazil.
EVALUATION OF SELF COMPENSATING EMITTERS IRRIGATING WITH SALINE
WATER: PART II:PROCESS CAPABILITY INDEX1
Doi:http://dx.doi.org/10.1590/1809-4430-Eng.Agric.v36n6p1086-1095/2016
PATRÍCIA F. DA SILVA2*, JOSÉ DANTAS NETO3, VERA L. A. DE LIMA3,
DELFRAN B. DOS SANTOS4, PEDRO H. P. RIBEIRO5
2*Corresponding author. Federal University of Campina Grande / Campina Grande - PB, Brazil. E-mail: [email protected]
ABSTRACT: The use of tools such as process capability index for irrigation aims to observe how
this irrigation is adequate in terms of quality. The aim of the study was analyzing the Christiansen uniformity coefficient and the flow of a drip irrigation system with self-compensating emitters under water different salt concentrations, using the process capability index. The research was
conducted in a greenhouse at the Federal University of Campina Grande (UFCG).The experimental
design was a randomized block in a factorial 5 x 2 with three replications, the factors consisted of
five levels of irrigation water salinity (CEw) (0.6, 1.5, 2.5, 3.5 and 4.5 dS m-1 at 25°C) and two
running times (0 and 350 hours of operation). The Christiansen uniformity coefficient (CUC) for
new and used emitters was greater than 90%, in different salt concentrations studied. The flow of emitters is maintained within the statistical quality control, since management and maintenance
operations are made after 350 hours of operation. The potential process capability index for the
Christiansen uniformity coefficient was higher than recommended for new and used emitters, being the process within the required specifications.
KEY WORDS: quality engineering, flow, quality control, Christiansen uniformity.
INTRODUCTION
The uniformity of water distribution is essential in any method of irrigation, because it affects the efficiency, economy and the rational use of water, being considered one of the most important factors in the design and operation of irrigation systems (DANTAS NETO et al. 2013). The water shortage in the world is a problem diagnosed, especially in countries with semi-arid areas, such as Brazil. Given the low supply of drinking water, it become important research projects and the creation of technologies that allow the use of saline water for irrigation (PAULUS et al, 2010; YACOUBI et al, 2010; RIBEIRO et al ., 2010).
The flow rates of the emitters in localized irrigation systems vary considerably and depend on various factors (water quality, orifice size of emitters, pressure, etc.). The consequence of this is the obstruction of emission, which occurs mainly in drip irrigation due to the emitters having holes with small passages, susceptible to clogging, resulting in reduction of evenness irrigation over time (BUSATO & SOARES, 2010).
Tools that help identify faulty processes can be applied in localized irrigation. Thus, the process capability index aims to observe how irrigation is adequate in terms of quality, reflected through the control charts (MONTGOMERY, 2009).
It is known that the process capability index is the response and the process is operating within specification limits provided; it is necessary that is in statistical control and that the values of flow and Christiansen Uniformity coefficients (CUC) have close to normal distribution and thus
observe the quality of irrigation (GONÇALEZ & WERNER, 2009). FRIZZONE et al. (1998), claim
that as the flow variation has normal distribution, it is possible to use statistical concepts to make quantitative analysis.
For irrigation, the usefulness of the capacity index aims to check how much the parameters involved meet the objectives of a rational irrigation, for example, the variation in the system flow can be at most of 10% of the nominal flow (MERCANTE et al. 2014).
Thus, the use of tools to identify problems caused to the emitters due to the use of lower quality water for irrigation is of fundamental importance, since the water quality may affect, beyond the irrigated crop, the irrigation system, causing losses to the producer.
Given the relevance of the theme aimed with this study, analyze the Christiansen uniformity coefficient and the flow of a drip irrigation system with self-compensating emitters applying waters of different salt concentrations, using the process capability index.
MATERIAL AND METHODS
The experiment was conducted in a greenhouse of the Academic Unit of Agricultural Engineering, Federal University of Campina Grande, Campina Grande, and PB, located at 7º
12’88” south latitude, 35°54’40” west longitude and average altitude of 532 m. For the assay it was
used a masonry structure with 8 m long and 1 m wide and 0.11 m high consisting of five modules and three experimental tanks. Five lines 8 m long were used.
The pressurization system used in the experiment consisted of a centrifugal pump of 0.5 hp. The pump running operation, as the start time and end of each application cycle, was performed manually observing the start times, duration of application and flow test. To prevent suspended
particles from entering in the system larger than the diameter of the emitters, we used a 1” screen
filter with a capacity of 5 m3h-1 of flow; and 1 manometer Bourdon type, tested and calibrated prior
to the assays.
The drip tape used in the experiment is the Rain Bard™, XFS 0612500 model, self
-compensating, with spacing between dripper of 0.30 m and the recommended pressure for
operation, according to the manufacturer, range from 60 to 420 kPa and a flow rate of 2.3 L h-1.
The treatments consisted of the combination of two factors: five levels of salinity of the
irrigation water - ECw (S1 = 0.6; S2 = 1.5; S3 = 2.5; S4 = 3.5 and S5 = 4.5 dS m-1 at 25 °C) and
two times of use (0 and 350 hours of operation); the operating pressure was 160 (kPa) supplied to the system, recorded by Bourdon tube pressure gauge (0 to 1000 kPa), connected to the input lines of emitters. The statistical design was a randomized block design with three replications, so that the factors studied were arranged in a factorial 5 x 2. The water of different salt concentrations were prepared by the methodology proposed by RICHARDS (1954), which were 0.6 ; 1.5; 2.5; 3.5 and
4.5 dS m-1 at 25 ° C.
Initially, were used new emitters with 0 (zero) hours of operation, and been evaluated using the five levels of salinity of the water in the pressure applied to the line emitters, individually; then at the end with the emitters used 350 hours of operation of the irrigation system in the same salt concentrations, the last evaluation was carried on emitters.
The attention in the collecting were the screen filter cleaning, the opening of the end of the lines and stabilization of pressure. We conducted 15 evaluations in each collecting for new and used emitters in each studied treatment. With the flow data was determined the Christiansen Uniformity Coefficient (CUC), [eq. (1)] for new and used emitters (0 and 350 hours of operation).
(1)
where,
Qi = flow collected on each emitter (L h-1 );
= average flow rates collected from all the emitters (L h-1 );
n = number of emitters analyzed.
For the application of the tools provided by the statistical process control, it is highlighted the need that the data must present normal distribution. The Anderson-Darling and Kolmorogov - Smirnov tests were used and determined using the Minitab program 16 to test the normality.
With the flow data and the Christiansen uniformity coefficient of the assay of each treatment, we calculated the ratio of the estimated processing capacity (Cp) using the eqs. (2) and (3), and developed (Cpk and Cpl) Graphic to analyze the ability of the processes and its centrality Cp.
(2)
where,
6𝜎 it is the ability of the process.
(3) where,
or = mean amplitude;
d2 = factor for the center line;
Ĉp = is an estimate of Cp;
LSE= upper specification limit, LSI= lower specification limit.
LOPES (2007) describes that when Cp <1, the capacity of the process is inadequate, and
recommended to perform the study with a process that is best suited to specifications if 1 ≤ Cp ≤
1.33 the process capability is around difference between the specifications; in this case, it is interesting the use of control charts to keep the process under control and Cp> 1.33, the process capacity is adequate to the required tolerance. If the process capability is less than half the tolerance, no need to take more care with the process, but you can say that it is excellent and highly reliable.
When the process is stable applies Cpk (unilateral processes) which is defined according to
the eqs. (4) and (5), [eq. (6)] Cpk is the lowest value between CPs and CPi. The classification
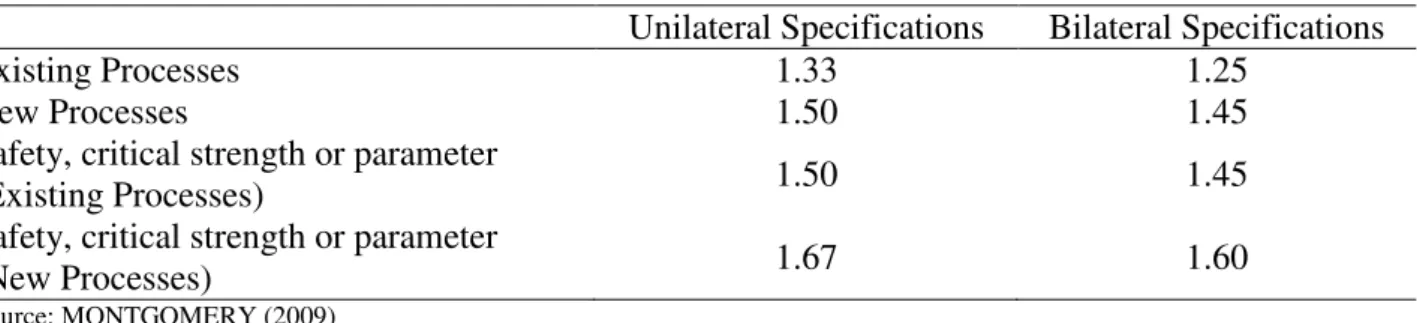
process is described in Table 1 according to MONTGOMERY (2009).
(4)
(5)
where,
- average;
LSE= upper specification limit; LIE= lower specification limit;
= LIE process capability,
= LSE process capability.
TABLE 1. Minimum values Recommended of the process capability ratio (Cp, Cpk).
Unilateral Specifications Bilateral Specifications
Existing Processes 1.33 1.25
New Processes 1.50 1.45
Safety, critical strength or parameter
(Existing Processes) 1.50 1.45
Safety, critical strength or parameter
(New Processes) 1.67 1.60
Source: MONTGOMERY (2009)
RESULTS AND DISCUSSION Process Capability Index
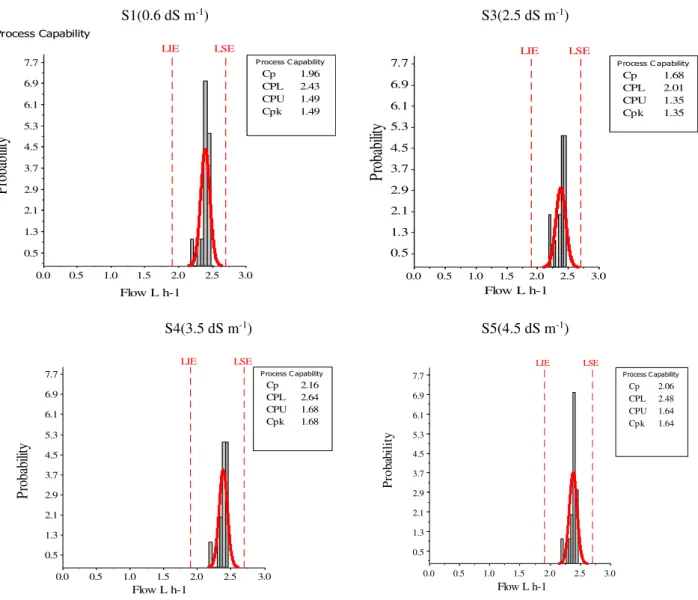
Histograms with normal curve to evaluate the process capability (Cp) and its centrality (Cpk) for the flow of new emitters subjected to five levels of irrigation water salinity are in Figure 1. It is
observed that in the S1 treatment (0.6 dS m-1); S3 (2.5 dS m-1); S4 (3.5 dS m-1) and S5 (4.5 dS m-1),
the flow distribution curve was normal and the values exceeded the reference (1.33).
Indicating that the waters of different salt concentrations applied to emitters when new can keep the process under control. These results are in agreement with those observed by SILVA et al. (2016), they say there is no influence of different salt concentrations in the flow of new emitters, being within the control limits.
By observing the centrality of the process only the treatment S3 (2.5 dS m-1) is kept centered,
do not escaping the established specification (5 to 10%) and thus the value of Cpk = 1.35 is close to Cp = 1.68. According to MONTGOMERY (2009), the closer the Cp of the Cpk more centered is the process.
To analyze the process capability (Cp) it is observed that the treatments are able, given that the optimal value according to MONTGOMERY (2009) should be greater than 1.50 for new materials like this experiment. According to JUCHEN et al. (2013), the average flow of irrigation has high potential for the process presenting low variation in reference to the range of specification limits and the process capability index is able, with Cpk of 1.59. Thus, the process meets the requirements for the Low Limit specification (LIE) in the nominal flow studies of the evaluated system.
S1(0.6 dS m-1) S3(2.5 dS m-1) 3.0 2.5 2.0 1.5 1.0 0.5 0.0 7.7 6.9 6.1 5.3 4.5 3.7 2.9 2.1 1.3 0.5 LIE LSE Cp 1.96 CPL 2.43 CPU 1.49 Cpk 1.49
P rocess C apability
Pr
ob
ab
ilit
y
Flow L h-1 Process Capability 3.0 2.5 2.0 1.5 1.0 0.5 0.0 7.7 6.9 6.1 5.3 4.5 3.7 2.9 2.1 1.3 0.5 LIE LSE Cp 1.68 CPL 2.01 CPU 1.35 Cpk 1.35
P rocess C apability
Pr
ob
ab
ilit
y
Flow L h-1
S4(3.5 dS m-1) S5(4.5 dS m-1)
3.0 2.5 2.0 1.5 1.0 0.5 0.0 7.7 6.9 6.1 5.3 4.5 3.7 2.9 2.1 1.3 0.5 LIE LSE Cp 2.16 CPL 2.64 CPU 1.68 Cpk 1.68
P rocess C apability
Pr
ob
ab
ilit
y
Flow L h-1
3.0 2.5 2.0 1.5 1.0 0.5 0.0 7.7 6.9 6.1 5.3 4.5 3.7 2.9 2.1 1.3 0.5 LIE LSE Cp 2.06 CPL 2.48 CPU 1.64 Cpk 1.64
P rocess C apability
Pr
ob
ab
ili
ty
Flow L h-1
FIGURE 1. Histograms of process capability (Cp) and its centrality (Cpk) for flow of new drippers submitted to waters of different salt concentrations (S1, S3, S4 and S5) for new emitter.
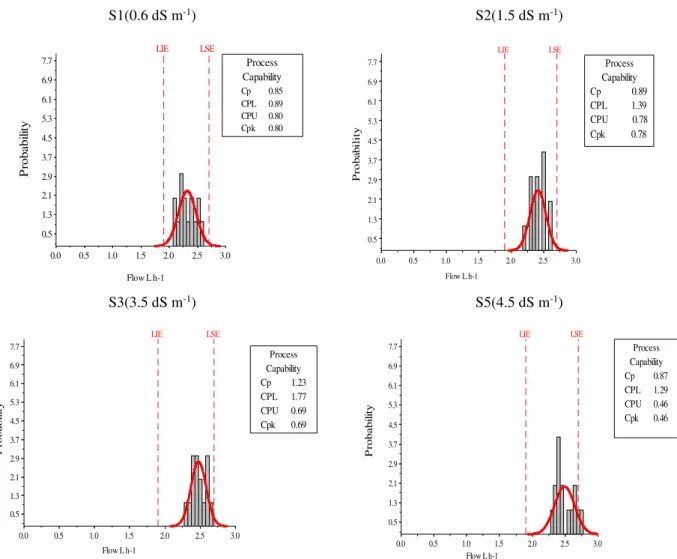
The process capability index for the flow with 350 hours of operation depending on the saline
treatments applied to the emitters is found in Figure 2. It is verified that S1 treatment (0.6 dS m-1);
S2 (1.5 dS m-1) and S5 (4.5 dS m-1) were classified as unable, given that the Cp and Cpk indices are
below the recommendations (Figure 2). JUSTI et al. (2010) argue that the process potential capability (Cp) is directly proportional to the increase in distribution uniformity, in addition to being able to diagnose if irrigation is within acceptable levels of control.
In treatment S3 (2.5 dS m-1) for used emitters (350 operating hours), it was found that the
process was rated as capable by the process potential capability (Cp), but for the potential centrality capability ( Cpk) did not present good centrality, Figure 2.
COSTA et al. (2005) report that the process capability index is a dimensionless parameter that indirectly measures how the process can meet the specifications, i.e., how much the irrigation system is operating efficiently. According to WERKEMA (1995), a process may not be able to present high variability or the average has been displaced regarding to the midpoint of the
specification limits. Occurrence hat was verified in S1 treatments (0.6 dSm-1); S2 (1.5 dSm-1) and
S1(0.6 dS m-1) S2(1.5 dS m-1) 3.0 2.5 2.0 1.5 1.0 0.5 0.0 7.7 6.9 6.1 5.3 4.5 3.7 2.9 2.1 1.3 0.5 LIE LSE Cp 0.85 CPL 0.89 CPU 0.80 Cpk 0.80 Capability Process P ro ba bi lit y
Flow L h-1
3.0 2.5 2.0 1.5 1.0 0.5 0.0 7.7 6.9 6.1 5.3 4.5 3.7 2.9 2.1 1.3 0.5 LIE LSE
Cp 0.89 CPL 1.39 CPU 0.78 Cpk 0.78 Capability Process P ro ba bi li ty
Flow L h-1
S3(3.5 dS m-1) S5(4.5 dS m-1)
3.0 2.5 2.0 1.5 1.0 0.5 0.0 7.7 6.9 6.1 5.3 4.5 3.7 2.9 2.1 1.3 0.5 LIE LSE Cp 1.23 CPL 1.77 CPU 0.69 Cpk 0.69 Capability Process P ro ba bi lit y
Flow L h-1 0.0 0.5 1.0 1.5 2.0 2.5 3.0
7.7 6.9 6.1 5.3 4.5 3.7 2.9 2.1 1.3 0.5 LIE LSE Cp 0.87 CPL 1.29 CPU 0.46 Cpk 0.46 Capability Process P ro b ab ili ty
Flow L h-1
FIGURE 2. Histograms of process capability (Cp) and its centrality (Cpk) for flow drippers subjected to water of different salt concentrations (S1, S2, S3 and S5), with 350 hours of operation.
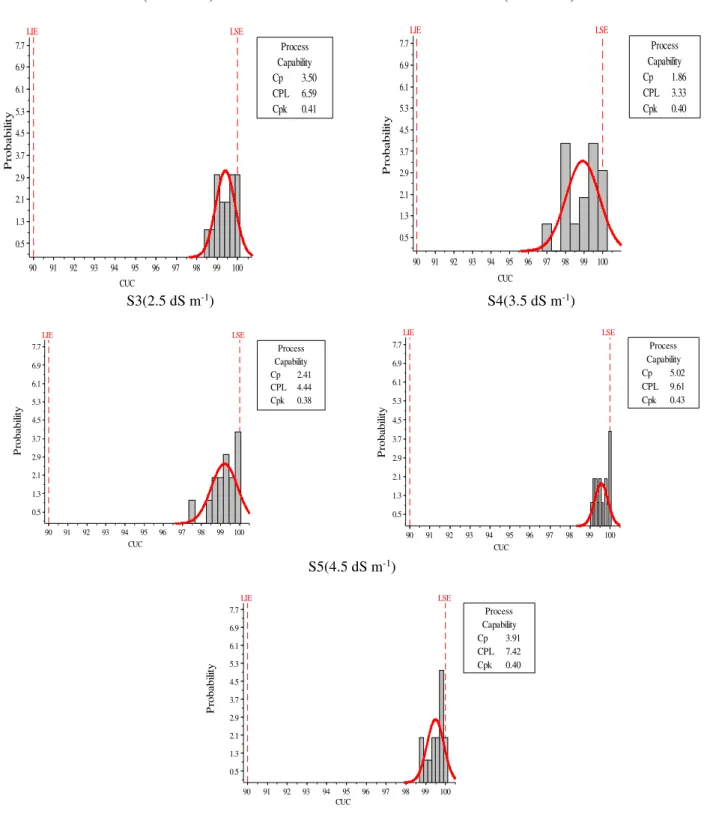
To evaluate the capability and the centrality of the process in the variable Christiansen uniformity coefficient, it was used in the graphics, the equation that considers only the existence of the Lower Limit Specification (LIE) of 90% for new emitters using saline water (Figure 3). It is
observed to new emitters that all treatments S1 (0.6 dS m-1); S2 (1.5 dS m-1); S3 (2.5 dS m-1); S4
(3.5 dS m-1) and S5 (4.5 dS m-1) obtained indexes above the acceptable minimum values (Figure 3).
The Cpl values are equal to the Cpk, once the lower specification limit is what interests to determine the minimum value of the process.
We can also say that the drip has excellent processing capability, since their value is higher than proposed by MONTGOMERY (2009), or the Cpk values are greater than 1.60, for one-sided process, that is, it is used only one specification limit. Thus, the system operation when new by the different treatments has excellent process capability by CUC data.
As for the Cpl values, MONTGOMERY (2009) stated that to consider new processes acceptable the minimum value of the process capability index (Cpl) should be 1.60. The studied system obtained indexes above 2.00 being a new system in its first year of use.
S1(0.6 dS m-1) S2(1.5 dS m-1) 100 99 98 97 96 95 94 93 92 91 90 7.7 6.9 6.1 5.3 4.5 3.7 2.9 2.1 1.3 0.5 LIE LSE Cp 3.50 CPL 6.59 Cpk 0.41 Capability Process P ro b ab ili ty CUC 100 99 98 97 96 95 94 93 92 91 90 7.7 6.9 6.1 5.3 4.5 3.7 2.9 2.1 1.3 0.5 LIE LSE Cp 1.86 CPL 3.33 Cpk 0.40 Capability Process P ro b a b il it y CUC
S3(2.5 dS m-1) S4(3.5 dS m-1)
100 99 98 97 96 95 94 93 92 91 90 7.7 6.9 6.1 5.3 4.5 3.7 2.9 2.1 1.3 0.5 LIE LSE Cp 2.41 CPL 4.44 Cpk 0.38 Capability Process P ro ba bi lit y CUC
90 91 92 93 94 95 96 97 98 99 100
7.7 6.9 6.1 5.3 4.5 3.7 2.9 2.1 1.3 0.5 LIE LSE Cp 5.02 CPL 9.61 Cpk 0.43 Capability Process P ro ba bi lit y CUC
S5(4.5 dS m-1)
100 99 98 97 96 95 94 93 92 91 90 7.7 6.9 6.1 5.3 4.5 3.7 2.9 2.1 1.3 0.5 LIE LSE Cp 3.91 CPL 7.42 Cpk 0.40 Capability Process P ro ba bi lit y CUC
FIGURE 3. Histograms of process capability (Cp) and its centrality (Cpk) to Christiansen uniformity coefficient with different salt concentrations (S1, S4, S3, S4 and S5) water for new emitter.
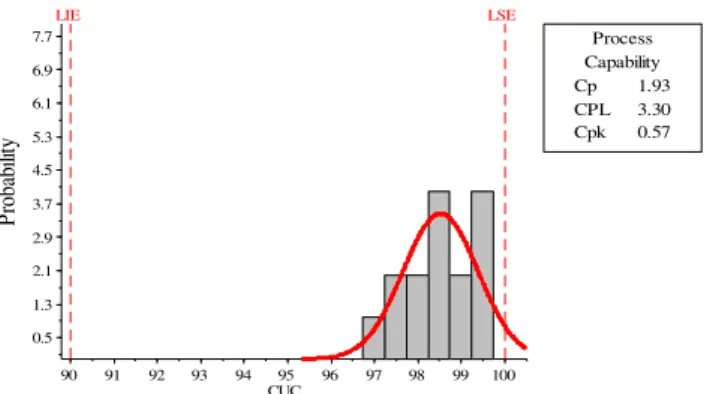
It has been found, in Figure 4, that the process capability index (Cpl) for the Christiansen Uniformity Coefficient with 350 hours of operation was superior to the process centrality index (Cpk). Fact that contributes that the processes are within the specified point and the distribution is centered.
S1; S3 and S5 treatment are regarded capable as the optimum value should be greater than 1.50 (Figure 4).
According to HERMES et al. (2013) in their study on quality control in irrigation and fertigation with wastewater from cassava processing in drip system, were observed that for a CUC value between 85 to 87.5% the calculated process capability index was 4.13. However, when the values are between CUC 87.5 to 90%, the process capability index was 4.19, and when the CUC is greater than 90%, the obtained process capability index was 5.50.
This result differed from that observed in the present study since the process capability index was lower for Christiansen uniformity coefficient superior to 90%. This fact is possibly related to the reference value adopted for the Lower Limit Specification.
According to GONÇALEZ & WERNER (2009), the process capability index is considered within specification when the process is centered on the nominal value specification.
S1(0.6 dS m-1) S2(1.5 dS m-1)
100 99 98 97 96 95 94 93 92 91 90 7.7 6.9 6.1 5.3 4.5 3.7 2.9 2.1 1.3 0.5 LIE LSE Cp 1.78 CPL 3.05 Cpk 0.51 Capability Process P ro ba bi lit y CUC 100 99 98 97 96 95 94 93 92 91 90 7.7 6.9 6.1 5.3 4.5 3.7 2.9 2.1 1.3 0.5 LIE LSE Cp 0.70 CPL 1.08 Cpk 0.32 Capability Process P ro ba bi lit y CUC
S3(2.5 dS m-1) S4(3.5 dS m-1)
100 99 98 97 96 95 94 93 92 91 90 7.7 6.9 6.1 5.3 4.5 3.7 2.9 2.1 1.3 0.5 LIE LSE Cp 2.20 CPL 3.86 Cpk 0.54 Capability Process P ro ba bi lit y CUC 100 99 98 97 96 95 94 93 92 91 90 7.7 6.9 6.1 5.3 4.5 3.7 2.9 2.1 1.3 0.5 LIE LSE Cp 1.21 CPL 2.09 Cpk 0.34 Capability Process P ro ba bi lit y CUC
100 99 98 97 96 95 94 93 92 91 90 7.7
6.9 6.1
5.3 4.5
3.7
2.9
2.1
1.3 0.5
LIE LSE
Cp 1.93
CPL 3.30
Cpk 0.57
Capability Process
Pr
ob
ab
ili
ty
CUC
FIGURE 4. Histograms of process capability (Cp) and its centrality (Cpk) to Christiansen uniformity coefficient with different salt concentrations waters (S1,S2,S3,S4 and S5) for emitters with 350 operating hours.
CONCLUSIONS
The Christiansen uniformity coefficient (CUC) for emitters with until 350 hours of operation
was above 90% in all saline treatments S1 (0.6 dS m-1); S2 (1.5 dS m-1); S3 (2.5 dS m-1); S4 (3.5
dS m-1) and S5 (4.5 dS m-1).
The emitters’ flow used for drip irrigation remains within the statistical quality control and
excellent Christiansen uniformity coefficient, since it has provided all the management and maintenance up to 350 hours of operation.
The potential capacity index for the Christiansen uniformity coefficient was higher than the recommended for new and used emitters, being the process within the required specifications.
REFERENCES
BUSATO, C. C. M.; SOARES. A. A. Desempenho de gotejadores, utilizando água de baixa
qualidade química e biológica. Bioscience Journal, Uberlândia, v.26, n.5, p.739-746, 2010.
COSTA, A. F. B. EPPRECHT, E. K. CARPINETTI, L. C. R. Controle estatístico de qualidade. 2.
ed. Ribeirão Preto: Ed. Atlas, 2005. 334p.
CHEN, K.S.; HUANG, H.L.; HUANG, C.T. Control charts for one-sided capability indices.
Quality & Quantity,Amsterdam, v.41, n. 3, p.413-427, 2007.
DANTAS NETO, J.; AZEVEDO, C. A. V.; SILVA, L. F. D.; SILVA, P. F. ; SANTOS, C. S. Desempenho de sistema de irrigação por gotejamento em áreas de pequenos produtores do
semiárido Paraibano. Enciclopédia Biosfera,Goiânia, v.9, n. 3, p. 679-688, 2013.
DENÍCULI, W.; BERNARDO, S.; THIÉBAUT, J. T. L.; SEDIYAMA, G. C. Uniformidade de
distribuição de água, em condições de campo num sistema de irrigação por gotejamento. Revista
Ceres,Viçosa, MG, v. 27, n. 150, p. 155-162, 1980.
FRIZZONE, J. A.; VIEIRA, A. T.; PAZ, V. P. S.; BOTREL, T. A. Caracterização hidráulica de um
tubo gotejador. Revista Brasileira de Engenharia Agrícola e Ambiental, Campina Grande, v.2, n.
3, p.278-283, 1998.
GONÇALEZ, P.U.; WERNER, L. Comparação dos índices de capacidade do processo para
distribuições não-normais. Revista Gestão e Produção, São Carlos, v 16, n. 01, p 121-132, 2009.
HERMES, E.; VILAS BOAS, M. A.; GOMES, S. D.; GOMES, B. M.; REIS, C. F. Quality control
in irrigation and fertigation with cassava processing wastewater into drip system. International
Journal of Food, Agriculture and Environment, Helsinki, v. 11, n. 2, p. 841-845, 2013.
JUCHEN, C. R.; SUZEK, F. L.; VILAS BOAS, M. A. Irrigação por gotejamento para produção de
JUSTI, A. L.; VILAS BOAS, M. A.; SAMPAIO, S. C. Índice de capacidade do processo na
avaliação da irrigação por aspersão. Engenharia Agrícola, Jaboticabal, v.30, p.264-270, 2010.
LOPES, L. F. D. Controle estatístico de processo– Apostila. Santa Maria: DE – CEEMQ -UFSM,
2007. 70p.
MONTGOMERY, D.C. Introdução ao controle estatístico da qualidade. 4. ed. Tradução Ana
Maria Lima de Farias, Vera Regina Lima de Farias e Flores; Revisão técnica Luiz da Costa
Laurencel. – Rio de Janeiro: LTC, 2009. 513p.
MERCANTE, E.; VILAS BOAS, M. A.; SILVA, B. B.; KLEIN, M. R.Utilização de gráficos de
controle estatístico na irrigação. Revista Eletrônica do Mestrado de Educação Ambiental, Rio
Grande, p. 97- 108, 2014. Volume Especial
PAULUS, D.; DOURADO NETO, D.; FRIZZONE, J. A.; SOARES, T. M. Produção e indicadores
fisiológicos de alface sob hidroponia com água salina. Horticultura Brasileira, Brasília, v.28, n.1,
p.29-35, 2010.
RICHARDS, L. A. Diagnosis and improvement of saline and alkali soils. Washington: United
States Salinity Laboratory. 1954. 160p. (Agriculture Handbook, 60).
RIBEIRO, P. A. A.; COELHO, R. D.; TEIXEIRA, M. B. Entupimento de tubos gotejadores convencionais com aplicação de cloreto de potássio (branco e vermelho) via duas qualidades de
água. Engenharia Agrícola, Jaboticabal, v. 30, n. 2, p. 279-287, 2010. CD-ROM.
ROLDAN, V. P. S; CABRAL, A. C. Q; FILHO, J.C.L.S; SANTOS, S.M; PESSOA, M.N.M. Inovação em serviços: análise do caso de uma empresa de médio porte no nordeste brasileiro.
Revista Gestão Industrial,Ponta Grossa, v. 9, n. 1, p. 01-23, 2013.
SILVA, P. F.; MATOS, R. M.; DANTAS NETO, J.; GOMES, R. C.B. ; LIMA, V. L.A.
Characterization of the hydraulic performance of self-compensating emitters with water of different
salt concentrations. Semina: Ciências Agrárias, Londrina, v. 37, n. 2, p. 639-650. 2016.
WERKEMA, M. C. C. Ferramentas da qualidade: ferramentas estatísticas básicas para o
gerenciamento de processos. Belo Horizonte: FCO - UFMG, 1995. 404 p.
YACOUBI, S.; ZAIANI, K.; ZAPATA, N.; ZAIRI, A.; SLATNI, A.; SALVADOR, R.; PLAYÁN, E. Day and night time sprinkler irrigated tomato: Irrigation performance and crop yield.