Spatial Distribution of Dengue in a Brazilian
Urban Slum Setting: Role of Socioeconomic
Gradient in Disease Risk
Mariana Kikuti1,2, Geraldo M. Cunha3, Igor A. D. Paploski1,2, Amelia M. Kasper1, Monaise M. O. Silva1, Aline S. Tavares1, Jaqueline S. Cruz1, Tássia L. Queiroz2, Moreno
S. Rodrigues1, Perla M. Santana1, Helena C. A. V. Lima1, Juan Calcagno1,
Daniele Takahashi1, André H. O. Gonçalves1, Josélio M. G. Araújo4, Kristine Gauthier5,
Maria A. Diuk-Wasser5, Uriel Kitron6, Albert I. Ko1,5, Mitermayer G. Reis1,5,7, Guilherme S. Ribeiro1,2,5
*
1Centro de Pesquisas Gonçalo Moniz, Fundação Oswaldo Cruz, Salvador, Bahia, Brazil,2Instituto de Saúde Coletiva, Universidade Federal da Bahia, Salvador, Bahia, Brazil,3Escola Nacional de Saúde
Pública, Fundação Oswaldo Cruz, Rio de Janeiro, Rio de Janeiro, Brazil,4Departamento de Microbiologia e Parasitologia, Universidade Federal do Rio Grande do Norte, Natal, Rio Grande do Norte, Brazil,
5Department of Epidemiology of Microbial Diseases, School of Public Health, Yale University, New Haven,
Connecticut, United States of America,6Department of Environmental Studies, Emory University, Atlanta,
Georgia, United States of America,7Faculdade de Medicina, Universidade Federal da Bahia, Salvador,
Bahia, Brazil
Abstract
Background
Few studies of dengue have shown group-level associations between demographic, socio-economic, or geographic characteristics and the spatial distribution of dengue within small urban areas. This study aimed to examine whether specific characteristics of an urban slum community were associated with the risk of dengue disease.
Methodology/Principal Findings
From 01/2009 to 12/2010, we conducted enhanced, community-based surveillance in the only public emergency unit in a slum in Salvador, Brazil to identify acute febrile illness (AFI) patients with laboratory evidence of dengue infection. Patient households were geocoded within census tracts (CTs). Demographic, socioeconomic, and geographical data were obtained from the 2010 national census. Associations between CTs characteristics and the spatial risk of both dengue and non-dengue AFI were assessed by Poisson log-normal and conditional auto-regressive models (CAR). We identified 651 (22.0%) dengue cases among 2,962 AFI patients. Estimated risk of symptomatic dengue was 21.3 and 70.2 cases per 10,000 inhabitants in 2009 and 2010, respectively. All the four dengue serotypes were iden-tified, but DENV2 predominated (DENV1: 8.1%; DENV2: 90.7%; DENV3: 0.4%; DENV4: 0.8%). Multivariable CAR regression analysis showed increased dengue risk in CTs with poorer inhabitants (RR: 1.02 for each percent increase in the frequency of families earning
a11111
OPEN ACCESS
Citation:Kikuti M, Cunha GM, Paploski IAD, Kasper AM, Silva MMO, Tavares AS, et al. (2015) Spatial Distribution of Dengue in a Brazilian Urban Slum Setting: Role of Socioeconomic Gradient in Disease Risk. PLoS Negl Trop Dis 9(7): e0003937. doi:10.1371/journal.pntd.0003937
Editor:Christopher M. Barker, University of California, Davis, UNITED STATES
Received:February 22, 2015
Accepted:June 26, 2015
Published:July 21, 2015
Copyright:© 2015 Kikuti et al. This is an open access article distributed under the terms of the Creative Commons Attribution License, which permits unrestricted use, distribution, and reproduction in any medium, provided the original author and source are credited.
Data Availability Statement:All relevant data are within the paper and its Supporting Information files (S1 Database). Secondary data used in the study are publicly available as referenced in the manuscript. The cartographical database is available athttp:// downloads.ibge.gov.br/downloads_geociencias.htm, by choosing the option“malhas_digitais/censo_2010/ setores_censitarios/ba.zip”. The topographical database is available athttp://www.ibge.gov.br/ english/geociencias/default_prod.shtm#, by choosing the option“Continuous Cartographic Base–
1 times the minimum wage; 95% CI: 1.01-1.04), and decreased risk in CTs located farther
from the health unit (RR: 0.87 for each 100 meter increase; 95% CI: 0.80-0.94). The same CTs characteristics were also associated with non-dengue AFI risk.
Conclusions/Significance
This study highlights the large burden of symptomatic dengue on individuals living in urban slums in Brazil. Lower neighborhood socioeconomic status was independently associated with increased risk of dengue, indicating that within slum communities with high levels of absolute poverty, factors associated with the social gradient influence dengue transmission. In addition, poor geographic access to health services may be a barrier to identifying both dengue and non-dengue AFI cases. Therefore, further spatial studies should account for this potential source of bias.
Author Summary
Dengue is influenced by the environment; however, few studies have investigated the rela-tionship between neighborhood characteristics and the spatial distribution of dengue within small urban areas. We examined whether specific characteristics of an urban slum community were associated with dengue risk. From January 2009 to December 2010, we conducted community-based surveillance in a slum in Salvador, Brazil to identify patients with acute febrile illness (AFI) and to test them for dengue. We identified 651 (22.0%) patients with laboratory evidence of dengue infection among 2,962 AFI patients. All the four dengue serotypes were detected, but DENV2 predominated (DENV1 8.1%; DENV2 90.7%; DENV3 0.4%; DENV4 0.8%). Estimated risk of symptomatic dengue was 21.3 and 70.2 cases per 10,000 inhabitants in 2009 and 2010, respectively. We found that neighbor-hood poverty level and proximity to the health center were associated with higher risk of detection of dengue and other AFI. This study highlights the large burden of dengue in poor urban slums of Brazil and indicates that socioeconomic development could poten-tially mitigate risk factors for both dengue and non-dengue AFI cases. In addition, we found that residential proximity to a health care facility was associated with improved case detection. Therefore, further studies on disease distribution should consider household proximity to health care facilities when assessing risk.
Introduction
Approximately 2.5 billion people worldwide live in dengue-endemic areas and are at risk for acquiring the infection [1]. Every year, as many as 390 million dengue infections occur, result-ing in an estimated 96 million symptomatic cases [2]. In the Americas, dengue incidence has continuously increased since the reintroduction of its vector, the mosquitoAedes aegypti, in the 1970s [3–5]. Brazil accounts for the largest number of dengue cases in the region. In 2013 alone, Brazil reported more than 1.46 million cases of dengue; 61.5% of the total number of cases recorded in the American continent [6–8].
Rapid urbanization, with subsequent increases in population density and poor living condi-tions, has been associated with the re-emergence of dengue [9]. Currently, approximately one third of the urban population in developing regions live in urban slums and, according to socioeconomic data from the 2010 national census is
available athttp://downloads.ibge.gov.br/downloads_ estatisticas.htm, by choosing the option“Censos/ Censo_demografico_2010/Resultados_do_Universo/ Agregados_por_Setores_Cesnitarios/BA_20150527. zip”.
Funding:This work was supported by the National Council for Scientific and Technological Development - CNPq (grant 550160/2010-8 to MGR, and grant 400830/2013-2 to GSR; scholarship to: MK, IADP, MMOS); the Bahia Foundation for Research Support - FAPESB (grant PNX0010/2011 to MGR, and grants PPP0055/2011 and JCB0020/2013 to GSR; scholarship to: AHOG); the Federal University of Bahia - UFBA (grants PROPI 2011, PROPI 2013, and PRODOC 2013 to GSR); the National Institutes of Health - NIH (grants R01 AI052473, U01 AI088752, R25 TW009338, and D43 TW00919 to AIK; FICRS-F fellowship to: JC); the Oswaldo Cruz Foundation (scholarship to: AMK, MMOS, AST, JSC, HCAVL, DT, MGR); and the Coordination for the Improvement of Higher Education Personnel - CAPES, Brazilian Ministry of Education (scholarship to: MK, TLQ). The funders had no role in study design, data collection and analysis, decision to publish, or preparation of the manuscript.
United Nations projections, about 2 billion people will reside in urban slums by 2030 [10,11]. In Brazil, a marked increase in the number of people living in impoverished urban slum com-munities occurred during the 20thcentury as a consequence of intense rural to urban migration and population growth [12]. The United Nations estimated that 26.4% of Brazilians lived in slums in 2010 [13]. In Brazil and elsewhere, several studies with ecological design have found associations between increased dengue risk and demographic, socioeconomic, and environ-mental characteristics, such as high population and household densities [14–17], wide social inequality and low socioeconomic status [18–25], low levels of population education [24–26], presence of a precarious sanitary system [16,17], lack of garbage collection [15,18,27], and low coverage of piped water [28,29].
The majority of these studies have examined large urban areas and compared dengue occur-rence among states, counties, or cities. However, dengue transmission is highly focal in space, as the vector typically disperses within a short range (<100 meters) [30,31]. Up to now, it is unknown whether group-level factors are associated with dengue at smaller geographic scales, such as within a neighborhood. In addition, prior studies, particularly those performed in Bra-zil, used secondary data from the national dengue reporting system. As dengue usually presents with nonspecific clinical manifestations, the disease burden may have been underreported dur-ing interepidemic periods and over-reported durdur-ing epidemic periods [7], a limitation of stud-ies using official surveillance data.
In Salvador, Brazil, dengue has been transmitted endemically since 1995, with approxi-mately 5,000 cases reported each year between 2008 and 2012 [32,33]. We estimated the spatial distribution of symptomatic dengue in an urban slum community in Salvador, and assessed whether group-level demographic, socioeconomic, and geographic factors influenced dengue distribution. Additionally, to investigate whether any associations were specific for dengue, we repeated the spatial distribution analyses and assessed group-level associated factors using cases of non-dengue acute febrile illness (AFI) as the outcome.
Methods
Study site
Between January 1, 2009 and December 31, 2010, we conducted enhanced community-based surveillance to detect patients with laboratory evidence of dengue infection among those seek-ing medical care for AFI at the only public emergency health unit (São Marcos Emergency Center [SMEC]; 38°26'09"W, 12°55'32"S) serving the Pau da Lima slum community in Salva-dor, Brazil (Fig 1A). The study site for the community-based surveillance was arbitrarily defined to have common boundaries with census tract territories, allowing use of official social and demographic population data to determine if AFI patients who sought medical attention at SMEC lived within the study site. In 2010, we performed a community survey and found that 84% (284 of 337) of the study site residents seek medical assistance for AFI at SMEC.
Fig 1. (A) Pau da Lima study site in Salvador, Brazil and spatial distribution of the estimated risk of (B) dengue and (C) non-dengue acute febrile illness (AFI) in the 98 census tracts that comprise the study site.Risks (per 10,000 population) were estimated for the two-year study period from January 1, 2009 and December 31, 2010.
population densities per household and higher percentages of younger inhabitants, black popu-lation, illiteracy, and poverty (S1 Fig). Lack of sanitation was more frequent among CTs located in the northeast region of the study site (S1 Fig).
The Zoonosis Control Center at the Municipal Secretary of Health conducted vector control actions within the study site, according to the national guidelines for dengue control and prevention [35]. Vector control activities included community education on vector control measures and bimonthly household visits for entomological surveys and vector control. These actions were routinely performed throughout the study period, except for three months between August 2 and November 3, 2010, when a strike of the dengue control agents inter-rupted their activities. Although we informed the Pau da Lima Health District about the partic-ipants’laboratory dengue results, we were not able to provide this information in a timely enough fashion to guide the activities of the Zoonosis Control Center agents.
Community-based enhanced surveillance
AFI surveillance was performed at SMEC from Mondays to Fridays, from 07h30 to 16h00. During surveillance hours, the study team used medical charts to prospectively identify patients with the following inclusion criteria: age of five years or more, reported fever or mea-sured axillary temperature37.8°C of up to 21 days of duration, and household address inside the study area. Patients who agreed to participate in the study and provided informed consent had an enrollment blood sample collected and were invited to return 15 days later for conva-lescent-phase blood sample collection. For patients unable to return to SMEC, a study team visited their domiciles to collect convalescent-phase blood samples. Blood samples were main-tained under refrigeration and were processed on the same day of collection. Sera were stored at -20°C and -70°C for dengue serological and molecular testing, respectively. The study team retrospectively reviewed medical charts of enrolled participants to collect data on presumptive diagnoses, hospitalization, and death during hospitalization at SMEC. We also reviewed medi-cal charts for every patient attended to at SMEC in 2009 and 2010 to ascertain the number of patients who were eligible for but were not enrolled in the study. Residential addresses for enrolled patients were confirmed by household visits and their positions were marked onto hard copy 1:1,200 scale maps, which were then entered into an ArcGIS database [36]. This database was merged with a cartographical database provided by IBGE [37] to identify the CT of residence of the study patients.
Source and definitions of study variables
CT-level aggregated data for demographic, socioeconomic, and geographic variables were obtained from the 2010 national census [34]. Topographical data were obtained from IBGE [38]. Demographic variables examined were the mean age of CT population, percentage of residents
Dengue diagnosis
Acute-phase sera were tested by enzyme linked immunoassay (ELISA) for detection of dengue NS1 antigen and dengue IgM antibodies (Panbio Diagnostics, Brisbane, Australia). Conva-lescent-phase sera were also tested by dengue IgM ELISA to identify seroconversions. Acute-phase sera from patients who were positive by NS1 ELISA or by IgM ELISA in either the acute-or the convalescent-phase sera were also tested by reverse transcriptase polymerase chain reac-tion (RT-PCR) [39] to identify the infecting serotype. We defined a dengue case as an AFI patient with a positive NS1 ELISA, acute- or convalescent-phase IgM ELISA, or RT-PCR.
Statistical analysis
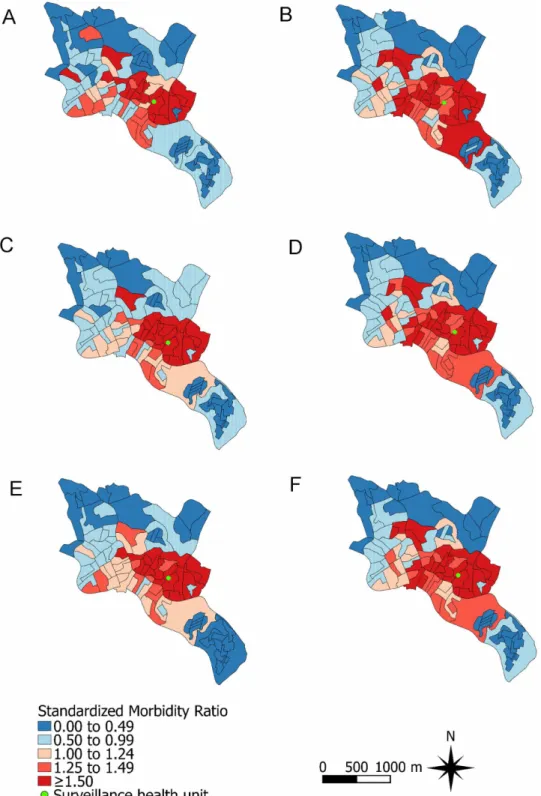
We estimated the population risk of symptomatic dengue as the ratio between the number of dengue cases detected by our surveillance and the area population. We also estimated the risk of non-dengue AFI using the number of enrolled patients without laboratory evidence of den-gue as the numerator. Risks were estimated for each CT. Denden-gue and non-denden-gue AFI stan-dardized morbidity ratios (SMR) were calculated indirectly by dividing the estimated risk for each CT during the two-year study period by the estimated risk for the overall study area. The SMRs were plotted in study site maps.
Bivariate and multivariable regression analyses to assess associations with estimated risk of dengue were performed using Poisson log-normal models [40]. This model is an extension of the Poisson model, which allows for data overdispersion. Demographic variables associated with dengue risk in the bivariate analysis (Pvalue0.20) were entered into a demographic multivariable backwards regression model. The same approach was used to build socioeco-nomic and geographic multivariable regression models. Variables withPvalues0.10 in the demographic, socioeconomic, or geographic multivariable regression models were selected for entry into a final backwards Poisson log-normal model to identify significant associations (P 0.05). A conditional autoregressive model (CAR) [40,41] was then used to account for the presence of spatially correlated residuals. The CAR model is an extension of the Poisson log-normal model, with the addition of a spatial component that is dependent on the neighboring structure of the spatial units of analysis. This component assumes that neighboring areas have similar risks, which often results in a smoothed risk map. In our CAR model, we assumed adja-cency-based neighborhood spatial weights. A Bayesian approach with non-informative prior distribution for all parameters was applied in the model. Calculations were made using inte-grated nested Laplace approximation (INLA) [42]. A backwards selection method was also applied to the CAR model to select associated variables (P0.05). Relative risks and 95% confi-dence intervals (95% CI) were calculated for all the models. Model fitness was assessed by the deviance information criterion (DIC) [43]. We repeated all the steps previously described to identify demographic, socioeconomic, and geographic variables associated with the estimated risk of non-dengue AFI. Risks of dengue and non-dengue AFI, predicted by the final multivari-able Poisson log-normal and by the CAR models, were used to calculate adjusted SMRs for each CT, which were plotted in maps. Statistical and spatial analyses were performed using Maptools and INLA packages in the R software (The R Project for Statistical Computing) [42]. The dataset was imported to Quantum GIS software to produce the maps [44].
Ethics statement
consent. Participants<18 years old who were able to read provided written assent following written consent from their parent or guardian. All study data were anonymized before analysis.
Results
During the two-year study period, a total of 12,958 study site residents5 years old received medical care for an AFI at SMEC. Among these residents, 3,459 (26.7%) were evaluated for study inclusion (Fig 2). Age and sex distributions for the groups of patients who were and were not evaluated were similar (both groups had median age of 18 years old and were 47% male). Of the assessed patients, 2,962 (85.6%) were enrolled in the study. Patients who were enrolled in the study were older (19 versus 13 years) and were more likely to be male (48% versus 44%) compared to those not enrolled.
An acute-phase blood sample was collected from 2,874 (97.0%) enrolled patients. Paired blood samples were obtained from 2,523 (85.2%) patients. Laboratory testing identified 651 (22.0% of 2,962) patients with evidence of dengue infection; the remaining 2,311 (78.0%) patients were classified as having non-dengue AFI. Among the dengue cases, 380 (58.4%) were acute-phase IgM ELISA positive, 505 (77.6%) were convalescent-phase IgM ELISA positive, 103 (15.8%) were NS1 ELISA positive, and 247 (37.9%) were RT-PCR positive. IgM serocon-version was observed for 207 (31.8%) of the dengue cases. For RT-PCR confirmed cases, 20 (8.1%) were infected with DENV1, 224 (90.7%) with DENV2, 1 (0.4%) with DENV3, and 2 (0.8%) with DENV4. Dengue was less prevalent among patients enrolled in 2009 (152 of 1,466; 10.4%) compared to patients enrolled in 2010 (499 of 1,496; 33.4%). The estimated risk of symptomatic dengue in the study site was 21.29 and 70.23 cases per 10,000 inhabitants in 2009 and 2010, respectively.
The socio-demographic and clinical characteristics of dengue and non-dengue AFI patients are shown inTable 1. Compared to non-dengue AFI, dengue cases more frequently presented with myalgia, retro-orbital pain, arthralgia, and rash. Only 16% of the dengue cases had a pre-sumptive diagnosis of dengue recorded in their medical charts. Yet, the likelihood of dengue suspicion was 7.5 times higher among dengue cases than among non-dengue AFI patients (P <0.001).
We were able to locate the census tract of residence for 570 (87.6%) of the 651 dengue cases and for 1,948 (84.3%) of the 2,311 non-dengue AFI patients. The estimated risks for both den-gue and non-denden-gue AFI were higher for the population living in the census tracts located in the central region of the study site (Fig 1B and 1C).
Multivariable Poisson log-normal models identified the following CT-level factors associ-ated with increased risk of dengue: a shorter linear distance between the centroid of the census tract and the emergency unit, a higher percentage of inhabitants who self-identify as black, and a higher percentage of families earning lower or equal to one Brazilian minimum wage per household inhabitant per month (Table 2). Estimated risk for non-dengue AFI was indepen-dently associated with the same CT-level factors, with higher mean age of the CT population as an additional risk factor (Table 2).
Addition of a spatial component to the multivariable models for both dengue and den-gue AFI improved their fitness and seemed to capture the spatial pattern of denden-gue and non-dengue AFI, since the non-structured residuals of both models were randomly distributed in space. Dengue risk, assessed by the CAR model, increased 2% (RR: 1.02; 95% CI: 1.01–1.04) for each 1% increase in the percentage of CT families with a monthly income1 times the Brazil-ian minimum wage per household inhabitant, and decreased 13% (RR: 0.87; 95% CI: 0.80–
families with a monthly income of1 times the minimum wage per household inhabitant increased (RR: 1.03; 95% CI: 1.01–1.04) and decreased as the linear distance between the CT centroid and the surveillance health unit increased (RR: 0.87; 95% CI: 0.80–0.93). In addition, non-dengue AFI was positively associated in the CAR model with higher mean age of the CT population (RR: 1.10; 95% CI: 1.02–1.19), and with a higher percentage of inhabitants who are black (RR: 1.02; 95% CI: 1.01–1.04) (Table 2). Although the spatial distribution of SMRs adjusted by the final Poisson log-normal and CAR models were smoother than the non-adjusted SMRs for both dengue and non-dengue AFI, the CTs located in the central region of the study site maintained a higher relative risk for both conditions (Fig 3).
Discussion
This enhanced surveillance study highlights the large burden of symptomatic dengue in a poor urban slum community of Salvador, the third largest city in Brazil. Even though the study site was relatively small and characterized by high levels of absolute poverty, the spatial distribution of the detected dengue cases was not homogenous, being influenced by neighborhood charac-teristics; namely, the gradient of social status and proximity to health services. These findings Fig 2. Enrollment of acute febrile illness (AFI) patients and dengue detection through enhanced surveillance in the Pau da Lima community, Salvador, Brazil, from January 1, 2009 to December 31, 2010.
were not specific for dengue, as the spatial distribution of non-dengue AFI presented the same pattern.
During the study period, the case definition for suspected dengue in Brazil was a patient who lived or traveled to endemic areas and presented with fever up to seven days of duration plus two of the following symptoms: headache, retro-orbital pain, myalgia, arthralgia, rash, or prostration [45]. However, underreporting of patients fulfilling clinical and epidemiological criteria for dengue is common in Brazil and elsewhere [46,47]. Furthermore, dengue reporting tends to be influenced by disease severity and the availability of dengue laboratory testing [48]. We used an enhanced surveillance design to detect AFI patients with laboratory evidence of dengue infection. This approach allowed identification of dengue cases that were unlikely to be reported, as only 16% of the detected cases had a clinical suspicion of dengue recorded in their chart, and also provided more complete epidemiological disease data.
Enhanced surveillance was only conducted during working hours, resulting in an underesti-mation of dengue and other non-dengue AFI risks. Furthermore, enrolled patients were older than those evaluated but not enrolled, which also might have influenced dengue risk estimation as dengue risk is not equal for all age groups. However, compared to the incidence of reported Table 1. Socio-demographic and clinical characteristics of acute febrile illness (AFI) patients detected through enhanced surveillance in the Pau da Lima community, Salvador, Brazil, according to dengue laboratory testing results—January 1, 2009 to December 31, 2010.
Characteristics Dengue Non-dengue AFI Total
Number/Total (%) or Median (Interquartile Range)
Socio-demographic
Male gendera 339/651 (52%) 1,069/2,311 (46%) 1,408/2,962 (48%)
Age, in yearsb 16 (10
–29) 19 (10–30) 19 (10–30)
Self-reported race
Black 278/569 (49%) 1,071/2,133 (50%) 1,349/2,702 (50%)
Mixed 224/569 (39%) 827/2,133 (39%) 1,051/2,702 (39%)
White 50/569 (9%) 196/2,133 (9%) 246/2,702 (9%)
Other 17/569 (3%) 39/2,133 (2%) 56/2,702 (2%)
Illiterate participants aged15 years 5/352 (1%) 27/1,374 (2%) 32/1,726 (2%)
Clinical
Days of symptomsc 3 (2
–4) 3 (2–4) 3 (2–4)
Headache 553/645 (86%) 1,912/2,299 (83%) 2,465/2,944 (84%)
Prostration 500/639 (78%) 1,818/2,264 (80%) 2,318/2,903 (80%)
Myalgiaa 472/644 (73%) 1,588/2,298 (69%) 2,060/2,942 (70%)
Retro-orbital paina 313/643 (49%) 832/2,290 (36%) 1,145/2,933 (39%)
Arthralgiaa 279/639 (44%) 756/2,287 (33%) 1,035/2,926 (35%)
Rasha 148/645 (23%) 313/2,299 (14%) 461/2,944 (16%)
Vomiting 197/645 (31%) 676/2,303 (29%) 873/2,948 (30%)
Outcomed
Clinical suspicion of denguea 102/648 (16%) 46/2,288 (2%) 148/2,936 (5%)
Hospitalization 20/648 (3%) 48/2,288 (2%) 68/2,936 (2%)
Death 1/648 (<1%) 3/2,288 (<1%) 4/2,936 (<1%)
aTwo-tailed chi-square P value<0.05, dengue versus non-dengue AFI patients.
bData on age were available for 2,961 AFI enrolled patients (651 with dengue and 2,310 with other non-dengue AFI).
cData on days of symptoms prior to presentation were available for 2,943 AFI enrolled patients (643 with dengue and 2,300 with other non-dengue AFI). dOutcome determined by medical chart review.
dengue in the whole Sanitary District of Pau da Lima, the study detected greater dengue risk in 2009 (17.3 and 21.3 cases per 10,000 inhabitants, respectively) and in 2010 (44.1 and 70.2 cases per 10,000 inhabitants, respectively) [33]. This finding is noteworthy, since the study only enrolled 22.9% of the 12,958 AFI subjects from the study site seeking medical attention at SMEC. As the AFI patients who were assessed for study inclusion had comparable age and sex distribution to those not assessed, we can assume that dengue prevalence was similar between these two groups and infer that the actual risk for a dengue episode requiring medical attention in the study site was about four times greater than estimated.
Table 2. Factors associated with dengue and non-dengue acute febrile illness (AFI) measured by Poisson log-normal models (bivariate and multi-variable) and conditional auto-regressive model (spatial), Pau da Lima community, Salvador, Brazil—January 1, 2009 to December 31, 2010.
Characteristics Dengue Non-dengue AFI
Bivariate Multivariablea Spatialb Bivariate Multivariablec Spatiald
Relative Risk (95%CI) Relative Risk (95%CI)
Demographics
Population density (x100 inhabitants/km2) 1.00 (0.99 –
1.00) 1.00 (0.991.00) –
Household density (x100 households/km2) 1.00 (0.99 –
1.00) 1.00 (0.991.00) –
Percentage of inhabitants<15 years of age 1.11 (1.07–
1.16)
1.07 (1.04–
1.11)
Mean age 0.84 (0.78–
0.90)
0.90 (0.84–
0.96)
1.16 (1.08–
1.25)
1.10 (1.02–
1.19) Socioeconomic
Percentage of black population 1.07 (1.05–
1.09)
1.02 (1.01–
1.04)
1.06 (1.04–
1.08)
1.03 (1.02–
1.05)
1.02 (1.01–
1.04)
Percentage of illiterates 1.13 (1.08–
1.18)
1.10 (1.05–
1.15)
Percentage density per household 5.29 (2.79–
10.31)
4.15 (2.32–
7.45)
Percentage of households:
With per capita monthly income1
minimum wagee 1.04 (1.03–
1.05)
1.02 (1.01–
1.03)
1.02 (1.01–
1.04)
1.03 (1.02–
1.03)
1.03 (1.02–
1.04)
1.03 (1.01–
1.04)
With inadequate sewer disposal 1.00 (0.99– 1.01)
1.00 (0.99– 1.01) Without public water supply 0.98 (0.92–
1.04)
0.97 (0.92– 1.03) Without garbage collection 1.02 (1.00–
1.04)
1.01 (0.99– 1.04)
Geographic
Mean elevation (m) 0.98 (0.96–
0.99)
0.98 (0.97–
0.99)
Elevation range (m) 1.03 (1.01–
1.04)
1.01 (1.00– 1.03) Distance from CT centroid to SMEC (x100 m) 0.87 (0.84–
0.91)
0.92 (0.89–
0.95)
0.87 (0.80–
0.94)
0.87 (0.84–
0.90)
0.91 (0.88–
0.93)
0.87 (0.80–
0.93)
aDeviance information criteria (DIC) = 456.1 bDIC = 443.1
cDIC = 632.2 dDIC = 609.8
eR$ 510.00; equivalent to US$289.77, in 2010
Fig 3. Standardized morbidity ratios (SMRs) for dengue and non-dengue acute febrile illness (AFI) in the Pau da Lima community, Salvador, Brazil, from January 1, 2009 to December 31, 2010. Non-adjusted SMR for (A) dengue and (B) non-dengue AFI; SMR Non-adjusted by the final Poisson-log normal model for (C) dengue and (D) non-dengue AFI; SMR adjusted by the final conditional auto-regressive model for (E) dengue and (F) non-dengue AFI.
We found a higher risk of dengue associated with poorer areas in the Pau da Lima slum community. Although some population-level studies based on reported dengue cases have also shown an association of symptomatic dengue risk and lower socioeconomic status [21–23,49], others have found an inverse association, where greater incidence occurred in areas of higher income [25,50], or even no association [51]. Discrepancies have been observed in individual-level studies, where dengue occurrence has not been associated [52,53] or was positively [54–
56] or negatively [24,57] associated with income and socioeconomic status. It has been specu-lated that these contradictory results were due to the specificities of each study location, such as level of dengue susceptibility in the population, implementation and coverage of vector control measures, as well as differences in the study spatial unit or the socioeconomic variables consid-ered [18,22,29]. However, poor communities typically have environmental characteristics that facilitateAedes spp. breeding, including presence of refuse deposits and containers for water storage [58,59]. Therefore, the social gradient we found in association with increased risk of dengue may have acted as a surrogate for other proximal factors involved in dengue transmission.
Proximity of the CTs to the health unit was the variable most strongly associated with detec-tion of dengue. This finding may be due to the fact that CTs located around the health unit had higher population densities per household, and higher percentage of inhabitants<15 years of age (a proxy for susceptibility to dengue infection) (S1 Fig); together these facts might favor dengue transmission as they increase opportunities for interactions between infected and sus-ceptible hosts via the mosquito vector. In bivariate, but not in multivariable and CAR analyses, both population density per household, and percentage of inhabitants<15 years of age were associated with dengue detection. However, the distance between the CTs and the health unit was also positively associated with non-dengue AFI cases detection, suggesting that this associ-ation was not specific for a vector-born disease. Therefore, CTs proximity to the study health unit most likely indicates increased opportunity for case detection. Measured distances between households and health facilities have previously been associated with dengue occur-rence [28], as well as with poorer colorectal cancer survival [60], lower clinic attendance and a higher degree of dehydration due to diarrhea [61], and decreased use of antenatal healthcare [62], among others. Geographic accessibility to health care is usually observed on a broader scale, especially in developing countries where greater inequalities in health care access are observed in smaller towns distant to large urban centers [63,64]. Our study demonstrates that this phenomenon may also be present at finer geographic scales, such as within urban commu-nities. This finding may be particularly important in spatial distribution studies that use reported cases of mild and self-limited diseases, and that rely on passive surveillance. In this context, areas of higher disease risk may actually represent areas of greater provision of health services and greater opportunity for case detection rather than a true difference in disease frequency.
inclusion of the distance from the health care unit and the CT centroid in the model may have overshadowed weaker associations.
This study has several limitations. Despite SMEC being the sole public emergency unit in the community, with the second closest public emergency unit located>1.5 km outside from the study site’s boundaries, Pau da Lima residents may have sought care elsewhere. In addition, we were not able to investigate dengue in all AFI patients seeking medical assistance at SMEC. However, AFI patients who were and were not evaluated for study inclusion were similar regarding age and sex distribution, suggesting that selection bias had a minor influence on our results. The CT of residence was not identified for all study participants, but we georeferenced the majority of them (87.6%) and ensured accuracy of the locations of CTs through household visits. We used different laboratory approaches to identify dengue cases. Even though it is likely that we missed some dengue cases by only performing RT-PCR on patients who were NS1 or IgM ELISA positive, the method we used to simultaneous test dengue by IgM and NS1 assays has been shown to increase diagnostic sensitivity [67]. Use of IgM ELISA to confirm dengue is consistent with the Brazilian Ministry of Health guidelines [68,69]; however, dengue IgM may remain detectable up to two months after an infection, and we may have classified patients with recent dengue infection as dengue cases. To account for the possible inclusion of recent asymptomatic infections among dengue cases, we repeated the multivariable Poisson-log nor-mal and the CAR regression analyses using only patients confirmed by IgM ELISA seroconver-sion, NS1 ELISA, and RT-PCR and found similar associations (S3 Table). Finally, in our model, we could not include data from the Larval Index Rapid Assay forAedes aegypti
(LIRAa), a national survey for positive mosquito breeding sites in a random sample of dwell-ings [70], because this index is recorded in spatial units that do not align with CTs boundaries.
Strengths of this study include the laboratory testing of all enrolled patients and the assess-ment of group-level characteristics associated with non-dengue AFI. Additionally, we used conditional auto-regressive models, which increased model fitness by adding a spatially struc-tured component. The increases in model fit indicate that there were residual spatial variations in the risk distributions that had not initially been captured by the studied variables.
Official surveillance systems based on passive reporting underestimate dengue burden; thus, enhanced surveillance is a useful tool to provide more accurate estimates of disease occurrence and its spatial distribution. According to the World Health Organization guidelines for dengue prevention and control, estimating the true burden of the disease is a critical step to achieve the goal of reducing dengue disease burden [71]. Our findings corroborate those of other studies showing that implementation of sentinel health unit-based enhanced surveillance for dengue is feasible and may be employed to obtain high quality information on disease trends and circu-lating serotypes as well as increase opportunities for timely detection and intervention during epidemics, which may not be achieved by passive surveillance [46,72].
In several settings, low socioeconomic status has been observed to impact dengue transmis-sion [21,54,73], emphasizing that the disease burden is likely to be greatest in vulnerable popu-lations such as urban slum dwellers, and as we found in this study, the poorest segments of such populations. Until initiatives address social inequity and the underlying poverty-associ-ated environmental determinants of dengue transmission, specific vector control actions that are difficult to apply citywide, such as biological larvae control, may target groups at higher dis-ease risk, such as those living in the poorer areas of urban communities.
Supporting Information
S1 Table. Characteristics of the 98 census tracts (CTs) comprising the study area in Pau da Lima, Salvador, Brazil, according to the 2010 national census.
(DOCX)
S2 Table. Spearman's rank correlation coefficient between socioeconomic variables.
(DOCX)
S3 Table. Factors associated with laboratory confirmed dengue measured by Poisson log-normal models (bivariate and multivariable) and conditional auto-regressive model (spa-tial), Pau da Lima community, Salvador, Brazil—January 1, 2009 to December 31, 2010. (DOCX)
S1 Fig. Spatial distribution of demographic, socioeconomic and geographical characteris-tics of Pau da Lima study site in Salvador, Brazil, according to the 2010 national census.
(A) Population density in hundreds (inhabitants/100/km2), (B) Population density per house-hold, (C) percentage of inhabitants<15 years of age, (D) percentage of black population, (E) percentage of illiterates, (F) percentage of households with per capita monthly income1 min-imum wage (R$ 510.00; equivalent to US$289.77, in 2010), (G) percentage of households with inadequate sewer disposal, (H) percentage of households without public water supply, (I) per-centage of households without garbage collection and (J) distance from CT centroid to SMEC (x100 m).
(TIF)
S1 Database. Database containing the numbers of confirmed and probable dengue cases and the numbers of non-dengue AFI cases, per study year and census tract.
(XLS)
S1 Checklist. STROBE checklist.
(DOC)
Acknowledgments
We would like to thank the technical staff who participated in study data collection and in sam-ple processing; Erica Souza, Nivison Nery Junior, Renan Rosa and Monique Silva for their assistance with data management, georeferencing, and with administrative matters; and Feder-ico Costa and Jose Hagan for their advice during study conduction. Finally, we would like to thank the indispensable contributions to accomplish this work provided by the São Marcos Emergency Center staff, especially from Aurélio Nei and Celeste Moura; of the Pau da Lima Health District, Salvador Secretariat of Health; and of Pau da Lima community leaders and res-ident associations.
Author Contributions
References
1. World Health Organization. Dengue and severe dengue [Internet]. 2014.http://www.who.int/ mediacentre/factsheets/fs117/en/
2. Bhatt S, Gething PW, Brady OJ, Messina JP, Farlow AW, Moyes CL, et al. The global distribution and burden of dengue. Nature. Nature Publishing Group.; 2013; 496: 504–7.
3. Maciel IJ, Siqueira Júnior JB, Turchi Martelli CM. Epidemiologia e desafios no controle do dengue. Rev
Patol Trop. 2008; 37: 111–130.http://www.revistas.ufg.br/index.php/iptsp/article/view/4998
4. Laughlin C a., Morens DM, Cassetti MC, Costero-Saint Denis A, San Martin JL, Whitehead SS, et al. Dengue research opportunities in the Americas. J Infect Dis. 2012; 206: 1121–1127. doi:10.1093/ infdis/jis351PMID:22782946
5. Guzman MG, Halstead SB, Artsob H, Buchy P, Farrar J, Gubler DJ, et al. Dengue: a continuing global threat. Nat Rev Microbiol. Nature Publishing Group.; 2010; 8: S7–S16.
6. Siqueira JB, Maria C, Martelli T, Coelho GE, Cristina A, Hatch DL. Dengue and Dengue Hemorrhagic Fever, Brazil, 1981–2002. Eme. 2005; 11: 48–53.
7. Teixeira MG, Siqueira JB, Ferreira GLC, Bricks L, Joint G. Epidemiological Trends of Dengue Disease in Brazil (2000–2010): A Systematic Literature Search and Analysis. PLoS Negl Trop Dis. 2013; 7: e2520. doi:10.1371/journal.pntd.0002520PMID:24386496
8. PAHO. Number of reported cases of Dengue and Severe Dengue (SD) in the Americas, by Country: Figures for 2013 [Internet].
9. Gubler DJ. Dengue and Dengue Hemorrhagic Fever. Clin Microbiol Rev. 1998; 11: 480–496. PMID: 9665979
10. UN-HABITAT. State of the World’s Cities 2012/2013. 2013.
11. UN-HABITAT. The Challenge of Slums. Global Report on Human Settlements. 2003.
12. BRASIL. Brasil em Desenvolvimento 2013. Estado, Planejamento e Políticas Públicas. Brasilia: Insti-tuto de Pesquisa Econômica Aplicada (IPEA); 2013.
13. UN-HABITAT. State of the World’s Cities 2010/11: Cities for All: Bridging the Urban Divide [Internet]. London: Earthscan; 2011.http://books.google.com.br/books?id=Yf0dMEc_IwoC
14. Koyadun S, Butraporn P, Kittayapong P. Ecologic and sociodemographic risk determinants for dengue transmission in urban areas in Thailand. Interdiscip Perspect Infect Dis. 2012; 2012: 907494. 4 doi:10. 1155/2012/907494PMID:23056042
15. Thammapalo S, Chongsuvivatwong V, Geater a, Dueravee M. Environmental factors and incidence of dengue fever and dengue haemorrhagic fever in an urban area, Southern Thailand. Epidemiol Infect. 2008; 136: 135–143. PMID:17359563
16. Da Costa Resendes AP, da Silveira N a PR, Sabroza PC, Souza-Santos R. Determination of priority areas for dengue control actions. Rev Saude Publica. 2010; 44: 274–282. PMID:20339626
17. Almeida AS, Medronho RDA, Valencia LIO. Spatial analysis of dengue and the socioeconomic context
of the city of Rio de Janeiro (Southeastern Brazil). Rev Saude Publica. 2009; 43: 666–673. PMID: 19649472
18. Flauzino RF, Souza-Santos R, Barcelllos C, Gracie R, Magalhaes Mde a, Oliveira RM, et al. Spatial
het-erogeneity of dengue fever in local studies, City of Niteroi, Southeastern Brazil. Rev Saude Publica. 2009; 43: 1035–1043.http://ovidsp.ovid.com/ovidweb.cgi?T=JS&CSC=Y&NEWS=N&PAGE= fulltext&D=medl&AN=19967254PMID:19967254
19. Rodrigues T, Teixeira DA. Spatial modeling of dengue and socio- environmental indicators in the city of Rio de Janeiro, Brazil Modelagem espacial da dengue e variáveis socioambientais no Município do Rio de Janeiro, Brasil. 2011; 27: 591–602.
20. Mena N, Troyo A, Bonilla-Carrion R, Calderon-Arguedas O. Factors associated with incidence of den-gue in Costa Rica. Rev Panam Salud Publica. 2011/05/24 ed. 2011; 29: 234–242. PMID:21603768
21. Costa JV, Donalisio MR, Silveira LV de A. Spatial distribution of dengue incidence and socio-environ-mental conditions in Campinas, São Paulo State, Brazil, 2007 Distribuição espacial da incidência de dengue e condições socioambientais em Campinas, Estado de São Paulo, Brasil, 2007 Distribuc. 2013; 29: 1522–1532.
22. Mondini A, Neto FC. Socioeconomic variables and dengue. Rev Saude Publica. 2007; 41: 923–930. PMID:18066463
23. Mondini A, Chiaravalloti-Neto F. Spatial correlation of incidence of dengue with socioeconomic,
24. Siqueira JB, Martelli CMT, Maciel IJ, Oliveira RM, Ribeiro MG, Amorim FP, et al. Household survey of dengue infection in central Brazil: spatial point pattern analysis and risk factors assessment. Am J Trop Med Hyg. Astmh.; 2004; 71: 646–651.http://www.ncbi.nlm.nih.gov/pubmed/15569799\nhttp://www. ajtmh.org/content/71/5/646.short
25. De Mattos Almeida MC, Caiaffa WT, Assunção RM, Proietti FA. Spatial vulnerability to dengue in a Bra-zilian urban area during a 7-year surveillance. J Urban Heal. 2007; 84: 334–345.
26. Flauzino RF, Souza-Santos R, Barcelllos C, Gracie R, Magalhaes Mde A, Oliveira RM. Spatial hetero-geneity of dengue fever in local studies, City of Niteroi, Southeastern Brazil. Rev Saude Publica. 2009/ 12/08 ed. 2009; 43: 1035–1043. PMID:19967254
27. Heukelbach J, Sales De Oliveira F a., Kerr-Pontes LRS, Feldmeier H. Risk factors associated with an out-break of dengue fever in a favela in Fortaleza, north-east Brazil. Trop Med Int Heal. 2001; 6: 635–642. 28. Stewart-Ibarra AM, Muñoz ÁG, Ryan SJ, Borbor MJ, Beltrán E. Spatiotemporal clustering, climate
peri-odicity, and social- ecological risk factors for dengue during an outbreak in Machala, Ecuador, in 2010. BMC Infect Dis. 2010; 14: 610.
29. Teixeira TR de A, Medronho RDA. Socio-demographic factors and the dengue fever epidemic in 2002 in the State of Rio de Janeiro, Brazil. Cad Saúde Pública. 2008; 24: 2160–2170. PMID:18813692
30. Harrington LC, Scott TW, Lerdthusnee K, Coleman RC, Costero A, Clark GG, et al. Disperad of the den-gue vector Aedes Aegypti within and between rural communities. Am J Trop Med Hyg. 2005; 72: 200–220.
31. Getis A, Morrison AC, Gray K, Scott TW. Characteristics of the spatial pattern of the dengue vector, Aedes aegypti, in Iquitos, Peru. Am J Trop Med Hyg. 2003; 69: 494–505. PMID:14695086
32. Teixeira MG, Costa MCN, Barreto ML, Barreto FR. Epidemiology of dengue in Salvador-Bahia, 1995– 1999. Rev Soc Bras Med Trop. 2001; 34: 269–274. PMID:11460213
33. BRASIL. Dengue: Notificações registradas no Sistema de Informação de Agravos de Notificação— SINAN, Brazil. [Internet]. da Saúde M, editor. 2014.http://dtr2004.saude.gov.br/sinanweb/tabnet/ tabnet?sinannet/dengue/bases/denguebrnet.def
34. IBGE. Censo Demográfico 2010—Resultados do universo. [Internet]. 2010.http://www.ibge.gov.br
35. BRASIL. Diretrizes Nacionais para a Prevenção e Controle de Epidemias de Dengue. 2009.
36. Environmental Systems Research Institute. ArcGIS Desktop: Release 9. Redlands, CA; 2011.
37. IBGE. Geociências—Malhas digitais Censo 2010 [Internet]. 2010.http://downloads.ibge.gov.br/ downloads_geociencias.htm
38. IBGE. Topographic Maps (edited)—Scale 1:1,000,000 [Internet]. 2005.http://www.ibge.gov.br/english/ geociencias/default_prod.shtm#
39. Lanciotti RS, Calisher CH, Gubler DJ, Chang GJ, Vorndam A V. Rapid detection and typing of dengue viruses from clinical samples by using reverse transcriptase-polymerase chain reaction. J Clin Micro-biol. 1992/03/01 ed. 1992; 30: 545–551.http://www.ncbi.nlm.nih.gov/pubmed/1372617PMID: 1372617
40. Banerjee S, Carlin BP, Gelfand AE. Hierarchical Modeling and Analysis for Spatial Data [Internet]. Tay-lor & Francis; 2003.http://books.google.com.br/books?id=YqpZKTp-Wh0C
41. Besag J, York J, Mollié A. Bayesian image restoration, with two applications in spatial statistics. Ann Inst Stat Math. 1991; 43: 1–20.
42. Rue H, Martino S, Chopin N. Approximate Bayesian inference for latent Gaussian models by using inte-grated nested Laplace approximations. J R Stat Soc Ser B. 2009; 71: 319–392.
43. Spiegelhalter DJ, Best NG, Carlin BP, van der Linde A. Bayesian measures of model complexity and fit. J R Stat Soc Ser B. 2002; 64: 583–639.
44. QGIS Development Team. QGIS Geographic Information System [Internet]. 2.2 Valmie. Open Source Geospatial Foundation Project; 2014.http://qgis.osgeo.org.
45. BRASIL. Dengue: diagnóstico e manejo clínico. 4th ed. da Saúde M, editor. Brasília; 2011.
46. Runge-Ranzinger S, McCall PJ, Kroeger a, Horstick O. Dengue disease surveillance: an updated sys-tematic literature review. Trop Med Int Health. 2014; 19: 1116–1160. doi:10.1111/tmi.12333PMID: 24889501
47. Runge-Ranzinger S, Horstick O, Marx M, Kroeger A. What does dengue disease surveillance contribute to predicting and detecting outbreaks and describing trends? Trop Med Int Heal. 2008; 13: 1022–1041. 48. Duarte HHeP, França EB. Data quality of dengue epidemiological surveillance in Belo Horizonte,
Southeastern Brazil. Rev Saude Publica. 2006; 40: 134–42. PMID:16410994
50. Barcellos C, Pustai AK, Weber MA, Brito MR V. Identification of places with potential transmission of dengue fever in Porto Alegre using Geographical Information Systems. Rev Soc Bras Med Trop. 2005; 38: 246–250. PMID:15895177
51. Indaratna K, Hutubessy R, Chupraphawan S, Sukapuruna C, Tao J, Chunsuthitwat S, et al. Application of geographical information systems to co-analysis of disease and economic resources Dengue and malaria in Thailand. Southeast Asian J Trop Med Public Heal. 1998; 29: 669–676.
52. Teixeira MDG, Barreto ML, Costa MDCN, Ferreira LD a, Vasconcelos PFC, Cairncross S. Dynamics of dengue virus circulation: A silent epidemic in a complex urban area. Trop Med Int Heal. 2002; 7: 757–762. 53. Espinoza-Gómez F, Hernández-Suárez CM, Rendón-Ramírez R, Carrillo-Alvarez ML,
Flores-Gonzá-lez JC. Interepidemic transmission of dengue in Colima City, Mexico. Salud Publica Mex. 2003; 45: 365–370. PMID:14628616
54. Ir P, Men C, Lucas H, Meessen B, Decoster K, Bloom G, et al. Self-reported serious illnesses in rural Cambodia: A cross-sectional survey. PLoS One. 2010; 5: 1–12. 0
55. Vasconcelos PF, Lima JW, da Rosa AP, Timbó MJ, da Rosa ES, Lima HR, et al. Dengue epidemic in Fortaleza, Ceará: randomized seroepidemiologic survey. Rev Saude Publica. 1998; 35: 447–454.
56. Vasconcelos PF da C, Lima JWO, Raposo ML, Rodrigues SG, da Rosa JFST, Amorim SMC, et al. Inquérito soro-epidemiológico na Ilha de São Luis durante epidemia de dengue no Maranhão. Rev Soc Bras Med Trop. 1999; 32: 171–179.http://www.scielo.br/scielo.php?script = sci_arttext&pid=S0037-86821999000200009&nrm = isoPMID:10228368
57. Braga C, Luna CF, Martelli CMT, De Souza WV, Cordeiro MT, Alexander N, et al. Seroprevalence and risk factors for dengue infection in socio-economically distinct areas of Recife, Brazil. Acta Trop. 2010; 113: 234–240. doi:10.1016/j.actatropica.2009.10.021PMID:19896921
58. Caprara A, Lima JWO, Marinho ACP, Calvasina PG, Landim LP, Sommerfeld J. Irregular water supply, household usage and dengue: a bio-social study in the Brazilian Northeast Abastecimento irregular de água, seu uso domiciliar e dengue: uma pesquisa biossocial no Nordeste do Brasil. Cad Saúde Pública. 2009; 25: S125–S136. PMID:19287857
59. Mulligan K, Dixon J, Joanna Sinn C-L, Elliott SJ. Is dengue a disease of poverty? A systematic review.
Pathog Glob Health. 2015; 109: 10–8. doi:10.1179/2047773214Y.0000000168PMID:25546339
60. Baade PD, Dasgupta P, Aitken JF, Turrell G. Geographic remoteness, area-level socioeconomic dis-avantage and inequalities in colorectal cancer survival in Queensland: a multilevel analysis. BMC Can-cer. 2013;13.
61. Rahaman MM, Aziz KM, Munshi MH, Patwari Y, Rahman M. A diarrhea clinic in rural Bangladesh: influ-ence of distance, age, and sex on attendance and diarrheal mortality. Am J Public Heal. 1982; 72: 11124–11128.
62. De Allegri M, Ridde V, Louis VR, Sarker M, Tiendrebéogo J, Yé M, et al. Determinants of utilisation of maternal care services after the reduction of user fees: A case study from rural Burkina Faso. Health Policy (New York). 2011; 99: 210–218.
63. Aguilera SLVU, França BHS, Moysés ST, Moysés SJ. Intermunicipal inequities in access and use of secondary health services in the metropolitan area of Curitiba. Rev Bras Epidemiol. 2014; 17: 654–667. PMID:25272259
64. Abor PA, Abekah-Nkrumah G, Sakyi K, Adjasi CKD, Abor J. The Socio-economic Determinants of Maternal Health Care Utilisation in Ghana. Int J Soc Econ. 2011; 38: 628–648.
65. Cordeiro R, Donalisio MR, Andrade VR, Mafra a C, Nucci LB, Brown JC, et al. Spatial distribution of the risk of dengue fever in southeast Brazil, 2006–2007. BMC Public Health. BioMed Central Ltd.; 2011; 11: 355.
66. Schmidt W-P, Suzuki M, Thiem V, White RG, Tsuzuki a, Yoshida L-M, et al. Population density, water supply, and the risk of dengue fever in vietnam: Cohort study and spatial analysis. PLoS Med. 2011; 8: e1001082. doi:10.1371/journal.pmed.1001082PMID:21918642
67. Blacksell SD, Jarman RG, Gibbons R V, Tanganuchitcharnchai A, Mammen MP, Nisalak A, et al. Com-parison of seven commercial antigen and antibody enzyme-linked immunosorbent assays for detection of acute dengue infection. Clin Vaccine Immunol. 2012; 19: 804–10. 1 doi:10.1128/CVI.05717-11 PMID:22441389
68. BRASIL. Guia de Vigilância Epidemiológica. da Saúde M, Saúde S de V em, editors. 2009.
69. BRASIL. Assunto: Nova classificação de caso de dengue—OMS [Internet]. SINAN Dengue Online. 2013.http://dtr2004.saude.gov.br/sinanweb/novo/Download/Nova_classificacao_de_caso_de_ dengue_OMS.pdf
70. BRASIL. Diagnóstico Rápido nos Municípios para Vigilência Entomológica do Aedes aegypti no Brasil —LIRAa. Brasilia: Ministério da Saúde; 2005.
72. Ramos MM, Mohammed H, Zielinski-Gutierrez E, Hayden MH, Lopez JLR, Fournier M, et al. Epidemic dengue and dengue hemorrhagic fever at the Texas-Mexico border: Results of a household-based ser-oepidemiologic survey, December 2005. Am J Trop Med Hyg. 2008; 78: 364–369. PMID:18337327 73. Reiter P, Lathrop S, Bunning M, Biggerstaff B, Singer D, Tiwari T, et al. Texas lifestyle limits