ACPD
11, 21995–22032, 2011Formation of semivolatile inorganic aerosols
V. A. Karydis et al.
Title Page
Abstract Introduction
Conclusions References
Tables Figures
◭ ◮
◭ ◮
Back Close
Full Screen / Esc
Printer-friendly Version Interactive Discussion
Discussion
P
a
per
|
Dis
cussion
P
a
per
|
Discussion
P
a
per
|
Discussio
n
P
a
per
|
Atmos. Chem. Phys. Discuss., 11, 21995–22032, 2011 www.atmos-chem-phys-discuss.net/11/21995/2011/ doi:10.5194/acpd-11-21995-2011
© Author(s) 2011. CC Attribution 3.0 License.
Atmospheric Chemistry and Physics Discussions
This discussion paper is/has been under review for the journal Atmospheric Chemistry and Physics (ACP). Please refer to the corresponding final paper in ACP if available.
Formation of semivolatile inorganic
aerosols in the mexico city metropolitan
area during the milagro campaign
V. A. Karydis1,2, A. P. Tsimpidi1,2, W. Lei3,4, L. T. Molina3,4, and S. N. Pandis1,2,5
1
Institute of Chemical Engineering and High Temperature Chemical Processes, Foundation for Research and Technology Hellas, Patras, Greece
2
Dept. of Chemical Engineering, University of Patras, Patras, Greece 3
Dept. of Earth, Atmospheric and Planetary Sciences, Massachusetts Institute of Technology, Cambridge, MA, USA
4
Molina Center for Energy and the Environment (MCE2), La Jolla, CA 92037, USA 5
Department of Chemical Engineering, Carnegie Mellon University, Pittsburgh, PA 15213, USA
Received: 10 June 2011 – Accepted: 18 July 2011 – Published: 4 August 2011
Correspondence to: S. N. Pandis (spyros@chemeng.upatras.gr)
ACPD
11, 21995–22032, 2011Formation of semivolatile inorganic aerosols
V. A. Karydis et al.
Title Page
Abstract Introduction
Conclusions References
Tables Figures
◭ ◮
◭ ◮
Back Close
Full Screen / Esc
Printer-friendly Version Interactive Discussion
Discussion
P
a
per
|
Dis
cussion
P
a
per
|
Discussion
P
a
per
|
Discussio
n
P
a
per
|
Abstract
One of the most challenging tasks for chemical transport models (CTMs) is the predic-tion of the formapredic-tion and partipredic-tioning of the major semi-volatile inorganic aerosol com-ponents (nitrate, chloride, ammonium) between the gas and particulate phases. In this work the PMCAMx-2008 CTM, which includes the recently developed aerosol
thermo-5
dynamic model ISORROPIA-II, is applied in the Mexico City Metropolitan Area in order to simulate the formation of the major inorganic aerosol components. The main sources of SO2(such as the Miguel Hidalgo Refinery and the Francisco Perez Rios Power Plant)
in the Mexico City Metropolitan Area (MCMA) are located in Tula, resulting in high pre-dicted PM1sulfate concentrations (over 25 µg m−3) in that area. The average predicted
10
PM1 nitrate concentrations are up to 3 µg m−3 (with maxima up to 11 µg m−3) in and
around the urban center, mostly produced from local photochemistry. The presence of calcium coming from the Tolteca area (7 µg m−3) as well as the rest of the mineral
cations (1 µg m−3potassium, 1 µg m−3magnesium, 2 µg m−3sodium, and 3 µg m−3
cal-cium) from the Texcoco Lake resulted in the formation of a significant amount of aerosol
15
nitrate in the coarse mode with concentrations up to 3 µg m−3over these areas. PM
1−10
chloride is also high and its concentration exceeds 2 µg m−3in Texcoco Lake. PM
1
am-monium concentrations peak at the center of Mexico City (2 µg m−3) and the Tula
vicin-ity (2.5 µg m−3). The performance of the model for the major inorganic PM components
(sulfate, ammonium, nitrate, chloride, sodium, calcium, and magnesium) is
encour-20
aging. At T0, the average measured values of PM1 sulfate, nitrate, ammonium, and
chloride are 3.6 µg m−3, 3.6 µg m−3, 2.1 µg m−3, and 0.35 µg m−3respectively. The
cor-responding predicted values are 3.7 µg m−3, 2.8 µg m−3, 1.7 µg m−3, and 0.25 µg m−3.
Additional improvements are possible by (i) using a day-dependent emission inventory, (ii) improving the performance of the model regarding the oxidant levels, and (iii)
revis-25
ing the emissions and the chemical composition of the fugitive dust. Sensitivity tests indicate that sulfate concentration in Tula decreases by up to 0.5 µg m−3 after a 50 %
reduction of SO2emissions while it can increase by up to 0.3 µg m− 3
emis-ACPD
11, 21995–22032, 2011Formation of semivolatile inorganic aerosols
V. A. Karydis et al.
Title Page
Abstract Introduction
Conclusions References
Tables Figures
◭ ◮
◭ ◮
Back Close
Full Screen / Esc
Printer-friendly Version Interactive Discussion
Discussion
P
a
per
|
Dis
cussion
P
a
per
|
Discussion
P
a
per
|
Discussio
n
P
a
per
|
sions are reduced by 50 %. Nitrate concentration decreases by up to 1 µg m−3after the
50 % reduction of NOx or NH3 emissions. Ammonium concentration decreases by up
to 1 µg m−3, 0.3 µg m−3, and 0.1 µg m−3after the 50 % reduction of NH
3, NOx, and SO2
emissions respectively.
1 Introduction
5
The rapid growth of megacities has led to serious urban air pollution problems in many developing countries. For example, Mexico City is the largest metropolitan area in North America with a population of 20 million. This megacity is experiencing high aerosol pollutant concentrations from a combination of high anthropogenic emissions, weak winds and intense sunshine (Molina and Molina, 2002). A large part of the PM2.5
10
mass (∼55 %) is inorganic, with sulfates, nitrates, ammonium, sodium and chloride be-ing the dominant species. Nitrate can be found in both fine (particles with diameters less than 1 µm) and coarse (particles with diameters more than 1 µm) modes. Sodium, chloride and the crustal components are mainly found in the coarse mode while am-monium and sulfate are usually in the fine mode (Seinfeld and Pandis, 2006). Mineral
15
dust also plays an important role in Mexico City atmosphere. Analysis of model and observational data in the Mexico City area during the MILAGRO (Megacity Initiative: Local and Global Research Observations) field experiment suggests that the large area of coastal dry lands to the northeast of Mexico City is an important source of dust particles for the entire MCMA. During dust aerosol events, observed from 16 to
20
20 March 2006, dust aerosol mass accounts for about 70 % of the total PM10 aerosol
mass concentrations, with a strong diurnal variation (Ying et al., 2011). These results also suggest that dust aerosols have important effects on actinic fluxes and therefore photochemistry in the MCMA.
The MILAGRO (http://www.eol.ucar.edu/projects/milagro/) field campaign was
de-25
ACPD
11, 21995–22032, 2011Formation of semivolatile inorganic aerosols
V. A. Karydis et al.
Title Page
Abstract Introduction
Conclusions References
Tables Figures
◭ ◮
◭ ◮
Back Close
Full Screen / Esc
Printer-friendly Version Interactive Discussion
Discussion
P
a
per
|
Dis
cussion
P
a
per
|
Discussion
P
a
per
|
Discussio
n
P
a
per
|
megacity. The study was conducted over multiple scales, ranging from ground-based investigations centered in the Mexico City metropolitan area to aircraft sampling over distances of hundreds of kilometres (Molina et al., 2010). A major component of the MILAGRO campaign was the use of the observed data to evaluate the performance of three dimensional chemical transport models and then use them for the design of
5
emission control strategies.
Several atmospheric models have been developed based on thermodynamic equi-librium principles to predict inorganic atmospheric aerosol behavior. These include: EQUIL (Bassett and Seinfeld, 1983), MARS (Saxena et al., 1986), SEQUILIB (Pili-nis and Seinfeld, 1987), AIM (Wexler and Seinfeld, 1991), SCAPE (Kim et al., 1993a,
10
b), SCAPE2 (Kim and Seinfeld, 1995; Meng et al., 1995), EQUISOLV (Jacobson et al., 1996), AIM2 (Clegg et al., 1998a, b), ISORROPIA (Nenes et al., 1998), GFEMN (Ansari and Pandis, 1999a) and EQUISOLV II (Jacobson, 1999). These models have been used in determining emissions control strategies (Watson et al., 1994; Ansari and Pandis, 1998; Kumar et al., 1998), in analyzing ambient measurements (Ansari
15
and Pandis, 1999b, 2000) and directly in large-scale chemical transport models (Pilinis and Seinfeld, 1988; Lurmann et al., 1997; Jacobson et al., 1996; Jacobson, 1997a, b; Meng et al., 1998; Nenes et al., 1999). Several studies have been performed com-paring field measurements of inorganic gaseous species and their particulate forms versus theory (Tanner, 1982; Hildemann et al., 1984). Tanner (1982) compared
theo-20
retical equilibrium calculations versus observed partial pressure products of nitric acid and ammonia under conditions present on Long Island, New York and reported a gen-eral agreement although some differences were found. Hildemann et al. (1984) per-formed a similar comparison between equilibrium-based calculations and observed partial pressure products of nitric acid and ammonia and their particulate forms at
dif-25
ACPD
11, 21995–22032, 2011Formation of semivolatile inorganic aerosols
V. A. Karydis et al.
Title Page
Abstract Introduction
Conclusions References
Tables Figures
◭ ◮
◭ ◮
Back Close
Full Screen / Esc
Printer-friendly Version Interactive Discussion
Discussion
P
a
per
|
Dis
cussion
P
a
per
|
Discussion
P
a
per
|
Discussio
n
P
a
per
|
model, interpretations of these comparisons are often difficult, especially in evaluating the ability of these models to reproduce particulate nitrate concentrations. An analy-sis of model performance against measurements has been performed by Russell et al. (1988), Pilinis and Seinfeld (1987), Wexler and Seinfeld (1991), Kumar et al. (1998), Ansari and Pandis (1999b), and Zhang et al. (2000, 2002). The first multicomponent
5
particulate matter atmospheric models were developed and applied in California. An Eulerian model was used to describe the transport and formation of pollutants in the south California air basin by Russell et al. (1988). A three dimensional Eulerian CTM simulating the major inorganic and organic PM components and their size distribu-tion was developed by Pilinis and Seinfeld (1987). Both of these initial models were
10
evaluated in Los Angeles for the 30–31 August 1982 smog episode. Wexler and Se-infeld (1991) developed a model of the temporal composition of atmospheric aerosol particles based on their transport and thermodynamic properties. Components of the model were tested against measurements of activity coefficients in single- and multi-component aqueous solutions and general agreement was found. Kumar et al. (1998)
15
compared the performance of several equilibrium models against measurements taken during the 1995 Integrated Monitoring Study (Chow and Egami, 1997). In these cases, the mean predictions of PM10nitrate and ammonium agreed within 20–30 % of the
cor-responding measurements. Ansari and Pandis (1999b) compared the performance of SEQUILIB, SCAPE2, ISORROPIA and GFEMN and found a general agreement in
pre-20
dictions for particulate nitrate and total inorganic particulate matter (PM) over a broad range of temperature, relative humidity (RH) and composition. However, they found significant differences in predictions for particulate water concentrations. Against mea-surements from the Southern California Air Quality Study (SCAQS, Lawson, 1990), all models qualitatively reproduced but generally underpredicted PM2.5nitrate
concen-25
ACPD
11, 21995–22032, 2011Formation of semivolatile inorganic aerosols
V. A. Karydis et al.
Title Page
Abstract Introduction
Conclusions References
Tables Figures
◭ ◮
◭ ◮
Back Close
Full Screen / Esc
Printer-friendly Version Interactive Discussion
Discussion
P
a
per
|
Dis
cussion
P
a
per
|
Discussion
P
a
per
|
Discussio
n
P
a
per
|
during the 1999 Atlanta Supersite Experiment was used to test the validity of the as-sumption of thermodynamic equilibrium between the inorganic fine particulate matters and their gas-phase phase precursors (Zhang et al., 2002). The equilibrium gas-phase concentrations were calculated using the ISORROPIA model which was predicting the equilibrium NH3(g) generally less than its observed concentration and the HNO3(g)
5
generally greater than the observed concentration.
Several photochemical modeling studies have been carried out in the MCMA. Among them, Zhang et al. (2009) and Tie et al. (2009) used the fully coupled WRF/CHEM (Weather Research and Forecasting – Chemistry) model to study the origin and evo-lution of the gaseous criteria pollutants (CO, O3, NOx, NOy) during the MILAGRO and
10
MIRAGE-Mex field campaigns respectively. However, there have been rather limited ef-forts to predict particle concentrations in Mexico City by using three-dimensional chem-ical transport models (CTMs). Tsimpidi et al. (2010, 2011) applied PMCAMx-2008 simulating the organic aerosol formation during the MCMA-2003 and MILAGRO-2006 campaigns by using the volatility basis set framework assuming that both primary and
15
secondary organic components are semi-volatile and photochemically reactive. Hodzic et al. (2009, 2010) used CHIMERE to study the contribution of biogenic organic com-pounds and semivolatile primary organic comcom-pounds to the formation of secondary organic aerosols in Mexico City during the MILAGRO field project. Li et al. (2011) sim-ulated the organic aerosol concentrations in Mexico City using the WRF/CHEM model.
20
Even fewer studies have focused on the formation of the inorganic aerosols in Mexico City. Fountoukis et al. (2009) coupled fast measurements of aerosol and gas-phase constituents with the ISORROPIA-II thermodynamic model to study the partitioning of semivolatile inorganic species and phase state of Mexico City aerosol during the MILA-GRO 2006 campaign. Karydis et al. (2010) introduced the ISORROPIA-II model into
25
PMCAMx-2008 and applied it to the MCMA in order to simulate the chemical compo-sition and mass of the major PM1 (fine) and PM1−10 (coarse) inorganic components
ACPD
11, 21995–22032, 2011Formation of semivolatile inorganic aerosols
V. A. Karydis et al.
Title Page
Abstract Introduction
Conclusions References
Tables Figures
◭ ◮
◭ ◮
Back Close
Full Screen / Esc
Printer-friendly Version Interactive Discussion
Discussion
P
a
per
|
Dis
cussion
P
a
per
|
Discussion
P
a
per
|
Discussio
n
P
a
per
|
Mexico City center (in the Tula industrial area) were not included in the model domain resulting in a small underprediction of all semivolatile inorganic components. The Kary-dis et al. (2010) study was also limited by the availability of measurements in Mexico City and the surrounding area (there was just one site with continuous PM composition measurements).
5
The present study adds to these previous efforts to evaluate our current understand-ing of the atmospheric processes responsible for the spatial, temporal, and seasonal variability of fine inorganic PM over the Mexico City Metropolitan Area. The model domain is expanded in order to include major sources from refineries and industries, a more accurate chemical composition of the fugitive dust emissions is used, and the
10
model predictions are evaluated against measurements from two sites; one in the ur-ban area of Mexico City designated as T0 and located in Northeast Mexico City at the Instituto Mexicano del Petroleo (IMP), and T1, located at a suburban location approxi-mately 32 km north of IMP (Querol et al., 2008). The evaluation focuses on the ability of PMCAMx-2008, to reproduce not only daily average concentrations but also the diurnal
15
variation of the major inorganic aerosol components during March 2006.
2 Model description
PMCAMx-2008 uses the framework of CAMx (Environ, 2003), which models the pro-cesses of horizontal and vertical advection, horizontal and vertical dispersion, wet and dry deposition, and gas-phase chemistry. In addition, three detailed aerosol modules
20
are used: inorganic aerosol growth (Gaydos et al., 2003; Koo et al., 2003), aqueous-phase chemistry (Fahey and Pandis, 2001), and secondary organic aerosol formation and growth (Lane et al., 2008). PMCAMx-2008 is the research version of the publicly available CAMx model.
The aerosol species treated are sulfate, nitrate, ammonium, chloride, potassium,
25
ACPD
11, 21995–22032, 2011Formation of semivolatile inorganic aerosols
V. A. Karydis et al.
Title Page
Abstract Introduction
Conclusions References
Tables Figures
◭ ◮
◭ ◮
Back Close
Full Screen / Esc
Printer-friendly Version Interactive Discussion
Discussion
P
a
per
|
Dis
cussion
P
a
per
|
Discussion
P
a
per
|
Discussio
n
P
a
per
|
across 10 size bins with the wet diameter varying from 40 nm to 40 µm. The chemical mechanism used is based on the SAPRC99 mechanism (Carter, 2000; Environ, 2003) which contains 211 reactions with 56 gases and 18 radicals.
The amount of each inorganic species transferred between the gas and aerosol phases is determined by using the hybrid approach (Capaldo et al., 2000) for aerosol
5
thermodynamics along with ISORROPIA II (Fountoukis and Nenes, 2007) which is a computationally efficient code that treats the thermodynamics of K+-Ca2+-Mg2+ -NH+4 -Na+-SO2−
4 -NO
−
3 -Cl
−-H
2O aerosol systems. According to the hybrid method,
the aerosol particles with diameters less than the threshold diameter (1 µm for the pur-poses of this study) are simulated assuming equilibrium while for the particles larger
10
than the threshold diameter the improved MADM model of Pilinis et al. (2000), as ex-tended by Gaydos et al. (2003), is used, which ensures a stable solution, regardless if the particles are completely dry, with an aqueous phase or transition between acidic and neutral conditions. Equilibrium is assumed between the gas and organic aerosol phase based on the Volatility Basis Set approach, VBS (Lane et al., 2008; Murphy
15
and Pandis, 2009). The aerosol mass is distributed over the aerosol size distribution by using a weighting factor for each size section based on the effective surface area (condensational sink) of each size section (Pandis et al., 1993; Lurmann et al., 1997).
3 Model application
PMCAMx-2008 is used to simulate air quality in the Mexico City Metropolitan Area
20
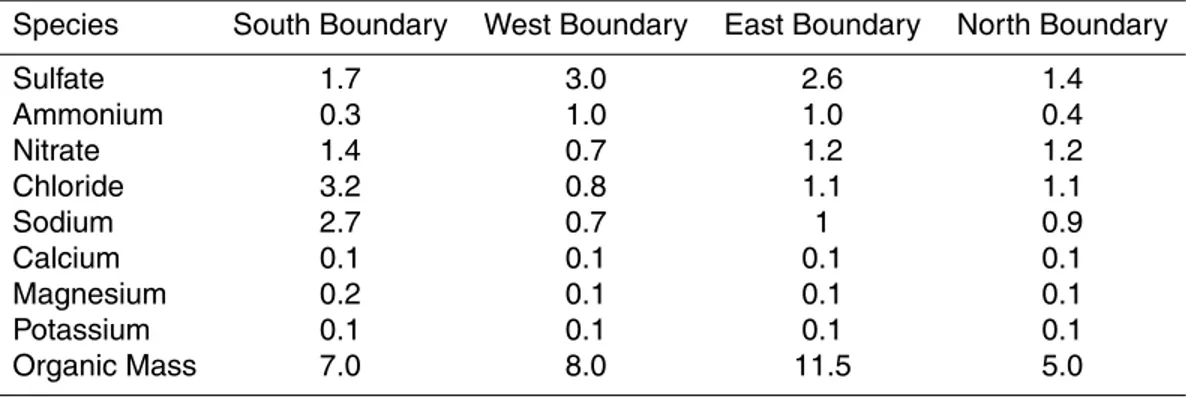
(MCMA) during March of 2006. The first three days of each simulation have been excluded in order to limit the effect the initial conditions have on the results. The con-centrations of the aerosol components at the boundaries of the domain were chosen based on results of the GISS-II’ global CTM (Racherla and Adams, 2006) for the month of March (Table 1). The modeling domain covers a 210×210 km region centered in the
25
wa-ACPD
11, 21995–22032, 2011Formation of semivolatile inorganic aerosols
V. A. Karydis et al.
Title Page
Abstract Introduction
Conclusions References
Tables Figures
◭ ◮
◭ ◮
Back Close
Full Screen / Esc
Printer-friendly Version Interactive Discussion
Discussion
P
a
per
|
Dis
cussion
P
a
per
|
Discussion
P
a
per
|
Discussio
n
P
a
per
|
ter vapor, vertical diffusivity, clouds, and rainfall, all computed offline by the Weather Research and Forecast (WRF) model.
The emission inventory used is based on the MCMA 2006 official emission inventory with improved dust and sodium chloride emissions, as well as new HONO emissions (0.8 % of the NOx emissions based on Aumont et al., 2003). The improved dust
emis-5
sions are the only emissions which are different for each day of simulation and they were calculated based on the algorithm of Draxler et al. (2001). The dust chemi-cal composition including the levels of sodium, chemi-calcium, potassium, and magnesium cations, which are the reactive dust components, are determined based on the ge-ological materials that produce fugitive dust emissions (Vega et al., 2001). Fugitive
10
dust emitters in and around MCMA are considered to be unpaved and paved roads, agricultural soil, dried Lake, asphalt, cement plants, landfill, gravel, and tezontle soil.
4 Overview of model predictions
The predicted average ground-level concentrations of PM1sulfate, nitrate, ammonium, and chloride over the period of March 2006 are shown in Fig. 2. The highest
pre-15
dicted sulfate concentrations are over the Tula vicinity (over 25 µg m−3), coming from
the large SO2sources from the industrial complexes in the area. In the center of Mex-ico City, there are no major SO2 sources, and sulfate concentrations are lower (up to
5 µg m−3). Nitrate is enhanced significantly in the urban area and immediate outflow
(up to 3 µg m−3), mostly produced from local photochemistry, indicating a strong urban
20
source. Nitrate decreases with distance from the city, due to evaporation and deposi-tion (of HNO3vapor), remaining in low levels in the surroundings (lower than 1 µg m−
3
). Ammonium concentrations peak at the center of Mexico City (2 µg m−3) and the Tula
vicinity (2.5 µg m−3) existing mainly in the form of ammonium nitrate and ammonium
sulfate respectively. Predicted PM1chloride concentrations are generally low (less than
25
0.5 µg m−3in the entire model domain) with the highest values in the Texcoco dry Lake
ACPD
11, 21995–22032, 2011Formation of semivolatile inorganic aerosols
V. A. Karydis et al.
Title Page
Abstract Introduction
Conclusions References
Tables Figures
◭ ◮
◭ ◮
Back Close
Full Screen / Esc
Printer-friendly Version Interactive Discussion
Discussion
P
a
per
|
Dis
cussion
P
a
per
|
Discussion
P
a
per
|
Discussio
n
P
a
per
|
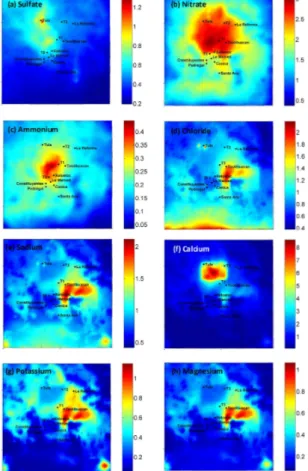
The results for the coarse (PM1−10) sulfate, nitrate, ammonium, chloride, sodium,
cal-cium, potassium, and magnesium are shown in Fig. 3. The Texcoco dry Lake is a signif-icant source of potassium (1 µg m−3), magnesium (1 µg m−3), sodium (2 µg m−3), and
calcium (3 µg m−3). Coarse calcium concentrations peak around Tolteca (7 µg m−3),
which is located around 70 km north of the Mexico City, due to the cement industries in
5
the area. ISORROPIA II along with the hybrid approach assist in simulating the forma-tion of PM1−10 nitrate and chloride describing interactions between these anions and
the cations of mineral dust. The presence of calcium coming from the Tolteca vicinity as well as the rest of the mineral cations from the Texcoco Lake resulted in the formation of a significant amount of aerosol nitrate in the coarse mode with concentrations up to
10
3 µg m−3. PM
1−10 chloride is also high and its concentration exceeds 2 µg m
−3in
Tex-coco Lake. There is also a little ammonium in the coarse mode (less than 0.5 µg m−3),
even if the coarse dust particles are alkaline. The soluble crustal elements increase the PM water content and thus favor the ammonium nitrate formation.
5 Model evaluation
15
The model predictions for PM1 sulfate, nitrate, ammonium, and chloride were
com-pared with measurements obtained during the MILAGRO field campaign at the T0 and T1 measurement sites (Aiken et al., 2009). The T0 monitoring station was located in the northwestern part of the basin of Mexico City. It is an urban background site in-fluenced by road traffic fresh emissions (300 m from four major roads surrounding it),
20
domestic and residential emissions, but also potentially influenced by local industrial emissions and from the Tula industrial area (around 60 km to the north-northwest). The model predictions for PM2.5sulfate, nitrate, ammonium, chloride, sodium, calcium, and magnesium were also compared with measurements that took place at T1 (Fountoukis et al., 2009). This is a suburban background site located around 50 km to the north
25
ACPD
11, 21995–22032, 2011Formation of semivolatile inorganic aerosols
V. A. Karydis et al.
Title Page
Abstract Introduction
Conclusions References
Tables Figures
◭ ◮
◭ ◮
Back Close
Full Screen / Esc
Printer-friendly Version Interactive Discussion
Discussion
P
a
per
|
Dis
cussion
P
a
per
|
Discussion
P
a
per
|
Discussio
n
P
a
per
|
the comparison between the model predictions and the measurements are depicted in Figs. 4–8.
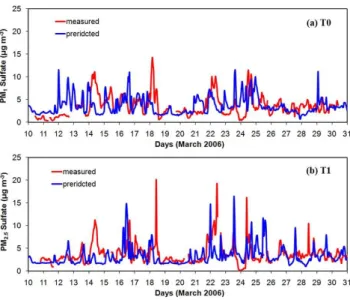
Sulfate: The performance of the model for sulfate is encouraging in both T0 and T1 sites (Fig. 4). In T0 the average predicted PM1sulfate concentration is 3.7 µg m−
3
while the observed average was 3.5 µg m−3. Both the model and the measurements show
5
little variability in the average diurnal sulfate concentration profile. In T1 the measured PM2.5 sulfate concentration was variable with concentration spikes up to 15 µg m
−3as
the location of this station is closer to the Tula vicinity which is the major source of sulfate. The model does reproduce this behavior even if some of the spikes are not at the right times. This discrepancy between the measured and the predicted profiles is
10
partially due to the use of the same emission inventory for SO2 for every day. Errors
in the meteorology were also identified as a major cause of some of the discrepancies between model predictions and measurements. For instance, during the 18 March the model underpredicts sulfate in both measurement sites (Fig. 4a and b). According to the measurements, the sulfate produced in Tula during the early morning of 18 March
15
was transported to the southeast and appeared in T1 (20 µg m−3) and T0 (15 µg m−3)
at around noon of the same day. On the other hand, there was not any peak in the predicted sulfate concentrations in T1 and T0 indicating potential problems during this period in the wind field used as input in PMCAMx-2008. The predicted average PM2.5 sulfate concentration in T1 is 3.3 µg m−3while the measured average is 4.4 µg m−3.
20
Nitrate: Both PMCAMx-2008 and measurements suggest that nitrate peaks dur-ing noon at T0 (Fig. 5a) and a couple of hours later at T1 with a lower concentration (Fig. 5c). During nighttime, predicted nitrate remains low (a few µg m−3) in both sites,
which is consistent with the measurements. During noon, there are several high nitrate concentration (above 10 µg m−3) measurement periods in the dataset during which the
25
par-ACPD
11, 21995–22032, 2011Formation of semivolatile inorganic aerosols
V. A. Karydis et al.
Title Page
Abstract Introduction
Conclusions References
Tables Figures
◭ ◮
◭ ◮
Back Close
Full Screen / Esc
Printer-friendly Version Interactive Discussion
Discussion
P
a
per
|
Dis
cussion
P
a
per
|
Discussion
P
a
per
|
Discussio
n
P
a
per
|
titioning of the available nitric acid (Fountoukis et al., 2007) but to an underprediction of the total nitric acid. In particular, the average value of the measured total nitric acid during its peak hour (at 11:00 LT) is 4.6 ppb (Aiken et al., 2009; Zheng et al., 2008) while the average predicted total nitrate at the same hour is 3.3 ppb. This is probably due to the predicted OH levels as they are slightly underestimated during early
morn-5
ing even though they are reasonably reproduced by the model during the rest of the day (not shown). Therefore the formation of HNO3 during the day from the reaction of
NO2 with OH is limited in the model resulting eventually in an underprediction of the aerosol nitrate. Especially towards the last week of March 2006, the observed nitrate is much higher than the predicted one, so are HONO concentrations. Li et al. (2010) and
10
Tsimpidi et al. (2010) have shown that the HONO production is quite important for the production of OH into the early morning atmosphere in the MCMA, suggesting that a more accurate description of HONO sources is needed. The inclusion of HONO emis-sions, used in this application, resulted in an average increase of 0.3 µg m−3 in PM
1
nitrate concentration at T0 with a daily maximum of 0.9 µg m−3 (at 11:00 LT).
Over-15
all, the average predicted nitrate concentrations are 2.6 µg m−3 and 3.3 µg m−3 in T0
and T1 sites respectively while the observed averages were 3.5 µg m−3and 3.2 µg m−3
respectively.
Ammonium: The ammonium predictions are quite sensitive to the ammonia emis-sions inventory, the predicted sulfate concentrations and the nitrate levels. The
perfor-20
mance of the model is respectable in both sites (Fig. 6) but it underpredicts ammonium concentrations during midday in T0 (Fig. 6b), due to the underprediction in total nitric acid. In T0 the average predicted concentration is 1.7 µg m−3 while the observed
av-erage was 2.1 µg m−3. Some of the di
fficulty in reproducing the hourly fluctuations of ammonium at T1 (Fig. 6c) is due to the sulfate predictions, as part of the ammonium
25
in T1 exists in the aerosol phase in the form of ammonium sulfate. The predicted av-erage PM2
.5ammonium concentration in T1 is 1.3 µg m
−3while the measured average
ACPD
11, 21995–22032, 2011Formation of semivolatile inorganic aerosols
V. A. Karydis et al.
Title Page
Abstract Introduction
Conclusions References
Tables Figures
◭ ◮
◭ ◮
Back Close
Full Screen / Esc
Printer-friendly Version Interactive Discussion
Discussion
P
a
per
|
Dis
cussion
P
a
per
|
Discussion
P
a
per
|
Discussio
n
P
a
per
|
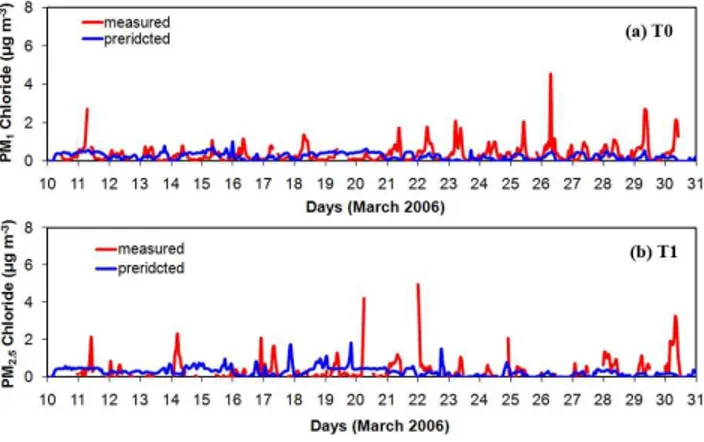
Chloride: Both observations and predictions suggest that chloride concentrations remain at low levels (up to 0.5 µg m−3) most of the time in both the T0 and T1 sites
(Fig. 7). Nevertheless, there are some measured major spikes at T0 site during the morning rush hours that the model is unable to reproduce (Fig. 7a). These spikes were observed mostly in the last week of the campaign. Given that the model uses the same
5
HCl emissions for every week day, it should be investigated if these emissions were, for some reason, higher during this week. During this period there is a clear decrease in the number of fires due to higher precipitation and humidity (Fast et al., 2007). Surpris-ingly enough, measured chloride is higher during this low fire period, which indicates that despite the emission of chloride by fires (DeCarlo et al., 2008), urban sources
10
and/or favorable partitioning conditions may be more important for this species in the MCMA. Comparisons of the predicted and measured diurnal profiles at T0 (Fig. 7b) suggest that the model underpredicts chloride. The average predicted concentration is 0.25 µg m−3while the observed average was 0.35 µg m−3. Given that the AMS
mea-sures only non refractory chloride, the model underprediction of the ambient chloride
15
concentration is probably greater. Aiken et al. (2009) suggest that approximately two thirds of the chloride is due to NH4Cl or species of similarly high volatility, while the rest may be due to more refractory species such as PbCl2 that are not simulated by the
model. In T1, the predicted average PM2.5 chloride concentration is 0.3 µg m
−3 while
the measured average is 0.4 µg m−3.
20
Dust components: Measurements of PM2.5sodium, calcium, and magnesium were only available at T1. PMCAMx-2008 shows on average a reasonable performance for these three dust components (Fig. 8). However, there is a tendency towards over-prediction, especially for calcium (Fig. 8b), indicating a possible overestimation of the dust emissions that PMCAMx-2008 uses and probably errors in the contributions of
25
the individual dust components or their size distribution. The predicted peaks at T1 for sodium, calcium, and magnesium are in the 1 µg m−3, 10 µg m−3, and 0.5 µg m−3
respectively, while the measured peaks are in the range of 0.5 µg m−3 for sodium,
ACPD
11, 21995–22032, 2011Formation of semivolatile inorganic aerosols
V. A. Karydis et al.
Title Page
Abstract Introduction
Conclusions References
Tables Figures
◭ ◮
◭ ◮
Back Close
Full Screen / Esc
Printer-friendly Version Interactive Discussion
Discussion
P
a
per
|
Dis
cussion
P
a
per
|
Discussion
P
a
per
|
Discussio
n
P
a
per
|
the model captures relative well not only the daily average concentrations of the dust components, but also their average diurnal variation, as both the predicted and the measured profiles are flat with almost constant concentration. The daily average pre-dicted concentrations of PM2.5sodium, calcium, and magnesium at T1 are 0.4 µg m
−3,
1 µg m−3, and 0.15 µg m−3respectively, while the average measured concentrations of
5
the same species are 0.3 µg m−3, 0.7 µg m−3and 0.15 µg m−3respectively.
6 Sensitivity to inorganic aerosol dynamics
To estimate the effects of the hybrid aerosol thermodynamic approach on the formation of the semi-volatile inorganic aerosol components, the predictions of the model using the hybrid approach were compared against those using the equilibrium approach for
10
the simulation of the partitioning of semivolatile inorganic PM components. The con-centration difference in the fine and coarse mode between the predictions of these two modeling approaches for nitrate is shown in Fig. 9. Positive concentrations reflect increases due to the use of the hybrid approach.
Assuming bulk equilibrium between the gas and the aerosol phase results in an
in-15
crease of the predicted PM1nitrate up to 2.5 µg m−3while, at the same time, the nitrate
concentration on the coarse mode decreases by an equal amount. This significant change on the results is due to the fact that the bulk equilibrium algorithm distributes most of the total PM nitrate to the fine mode (approximately 90 %) that has most of the surface area. In the hybrid approach, the coarse fraction continues to absorb nitric
20
acid vapors, even after the small particles achieve equilibrium, thus lowering the nitric acid gas-phase concentration. The smallest sections then lose mass as evaporation is required to maintain equilibrium with the gas phase. As a result the predicted coarse nitrate using the hybrid approach represents 55 % on average of the total PM nitrate. Therefore, the hybrid approach is considered essential in order to accurately simulate
25
ACPD
11, 21995–22032, 2011Formation of semivolatile inorganic aerosols
V. A. Karydis et al.
Title Page
Abstract Introduction
Conclusions References
Tables Figures
◭ ◮
◭ ◮
Back Close
Full Screen / Esc
Printer-friendly Version Interactive Discussion
Discussion
P
a
per
|
Dis
cussion
P
a
per
|
Discussion
P
a
per
|
Discussio
n
P
a
per
|
7 Sensitivity to emissions of inorganic aerosol precursors
In order to estimate the response of fine PM components to changes in anthropogenic emissions in Mexico City, three control strategies are examined separately, a 50 % re-duction of SO2, a 50 % reduction of NH3, and a 50 % reduction of NOx emissions.
These should be viewed as sensitivity tests as they do not correspond to actual
emis-5
sion control strategies. The results of these simulations are compared to the results of the base case simulation to examine the effectiveness of these strategies in the reduction of PM1sulfate, nitrate, and ammonium concentrations.
The predicted changes in ground-level concentrations of the inorganic aerosols af-ter a 50 % reduction of SO2 emissions are shown in Fig. 10. Sulfate decreases by
10
approximately 0.5 µg m−3 (less than 5 %) in the Tula vicinity, where it has the highest
concentration, while in the center of Mexico City the reduction of sulfate is approxi-mately 0.3 µg m−3(
∼10 %). The highest reduction on the hourly average concentration is 8 µg m−3 (25 %) in Tula. This extremely non linear response of sulfate
concentra-tion to the reducconcentra-tion of SO2 emissions is in contrast with the findings of Tsimpidi et
15
al. (2007) where sulfate concentration on the Eastern US varied linearly with SO2 emissions, especially during the summer season. The main difference between the atmosphere of Mexico City and the eastern US is the concentration of SO2 which in
MCMA is predicted to be more than 10 times higher than in the eastern US. Therefore, the oxidant concentration in the area is not sufficient for the SO2 oxidation to SO
2−
4
20
and the production of the latter is more controlled by the availability of oxidants than of SO2. Nitrate concentration increases up to 0.1 µg m−3 (10 %) after the reduction of
SO2 emissions while the maximum increase on the hourly average concentration is
0.6 µg m−3 (25 %). This increase is attributed to the increase of free ammonia, after
the reduction of sulfate, which reacted with HNO3to form additional particulate nitrate.
25
Ammonium concentration decreases by 0.1 µg m−3 (5–10 %) in the center of Mexico
City and the hourly maximum concentration decreases by 1 µg m−3(40 %). The
ACPD
11, 21995–22032, 2011Formation of semivolatile inorganic aerosols
V. A. Karydis et al.
Title Page
Abstract Introduction
Conclusions References
Tables Figures
◭ ◮
◭ ◮
Back Close
Full Screen / Esc
Printer-friendly Version Interactive Discussion
Discussion
P
a
per
|
Dis
cussion
P
a
per
|
Discussion
P
a
per
|
Discussio
n
P
a
per
|
represents a small fraction (∼20 %) of total sulfate mass in the area.
The predicted changes in ground-level concentrations of the inorganic aerosols af-ter a 50 % reduction of NH3 emissions are shown in Fig. 11. Sulfate concentration
is not sensitive to changes of ammonia emissions as even in environments with low NH3, sulfate still exists in the aerosol phase in the form of ammonium bisulfate or as
5
H2SO4. In the center of Mexico City, after the 50 % reduction of NH3emissions, nitrate
and ammonium decreases by 1 µg m−3(35 %) and 0.3 µg m−3(20 %) respectively. The
highest reduction of ammonium concentration is predicted in Tula and is up to 1 µg m−3
(35 %). The highest hourly average concentration of nitrate, located in Mexico City center, and ammonium, located in Tula, is reduced by 10 µg m−3 (60 %) and 4 µg m−3
10
(45 %) respectively.
The predicted changes in ground-level concentrations of the inorganic aerosols after a 50 % reduction of NOx emissions are shown in Fig. 12. In the center of Mexico City,
the decrease of NOxemissions results in lower OH radical and ozone concentrations and consequently a decrease of sulfate concentration levels. In particular, sulfate
de-15
creases by up to 0.2 µg m−3 (7 %) with an hourly maximum of 3.5 µg m−3 (35 %). In
Tula, a reduction of NOx concentrations results in an increase of OH and O3 concen-trations and, as a result, sulfate concentration increases by 0.3 µg m−3 (2 %) with an
hourly maximum of 7 µg m−3 (15 %). Nitrate decreases by 1 µg m−3 (35 %), with an
hourly maximum of 7.5 µg m−3 (50 %), as NO
x is the main precursor of HNO3 in the
20
atmosphere. Finally, the simultaneously decrease of both nitrate and sulfate concen-tration levels in Mexico City resulted in a 0.3 µg m−3 (20 %) decrease of ammonium
concentration, with an hourly maximum of 2 µg m−3(45 %).
8 Conclusions
A detailed three-dimensional chemical transport model (PMCAMx-2008), which
con-25
ACPD
11, 21995–22032, 2011Formation of semivolatile inorganic aerosols
V. A. Karydis et al.
Title Page
Abstract Introduction
Conclusions References
Tables Figures
◭ ◮
◭ ◮
Back Close
Full Screen / Esc
Printer-friendly Version Interactive Discussion
Discussion
P
a
per
|
Dis
cussion
P
a
per
|
Discussion
P
a
per
|
Discussio
n
P
a
per
|
City Metropolitan Area. The model predictions were compared against measurements taken from the T0 site, located in the urban area of Mexico City, and from T1 site, located at a suburban area. Overall, PMCAMx-2008 was able to reproduce both the daily average concentrations and the diurnal variation of the major inorganic aerosol components. A number of conclusions arise from our analysis:
5
– Sulfate is regional in nature with clear influences from the large SO2sources in the
industrial complex in Tula, while the urban area is not a major source of sulfate.
– Nitrate is enhanced significantly in the urban area and immediate outflow (up to 3 µg m−3), mostly produced from local photochemistry, indicating a strong urban
source. It decreases with distance from the city, due to evaporation and
deposi-10
tion, remaining in low levels in the surroundings (lower than 1 µg m−3).
– There is significant need for improvement of the simulation of HONO formation in the early morning.
– Ammonium concentrations peak at the center of Mexico City and the Tula vicinity (3 µg m−3) existing mainly in the form of ammonium nitrate and ammonium sulfate
15
respectively.
– The Texcoco dry Lake is a significant source of potassium (up to 1 µg m−3),
mag-nesium (1 µg m−3), sodium (2 µg m−3), and calcium (3 µg m−3) that influences the
PM concentrations in the areas to the east and northeast of the city.
– Calcium concentrations peak near Tolteca (up to 7 µg m−3) as a result of
emis-20
sions from the cement industries in the area.
ACPD
11, 21995–22032, 2011Formation of semivolatile inorganic aerosols
V. A. Karydis et al.
Title Page
Abstract Introduction
Conclusions References
Tables Figures
◭ ◮
◭ ◮
Back Close
Full Screen / Esc
Printer-friendly Version Interactive Discussion
Discussion
P
a
per
|
Dis
cussion
P
a
per
|
Discussion
P
a
per
|
Discussio
n
P
a
per
|
– The use of the same emission inventory for every week day introduces errors in predicting the variations of the concentration of the major inorganic components.
– The model underestimates the OH concentrations and thus the formation of HNO3. The lack of HNO3 results in an underestimation of the ammonium nitrate
during the day.
5
– The predicted unrealistic high peaks of dust components concentrations at T1 site indicate a possible overestimation of the dust emissions.
– A 50 % reduction of SO2 emissions leads to a decrease of average PM1 sulfate and ammonium concentrations up to 0.5 µg m−3and 0.1 µg m−3respectively, and
to an increase of PM1nitrate concentration up to 0.1 µg m− 3
.
10
– A 50 % reduction of NH3 emissions leads to a decrease of PM1 nitrate and
am-monium concentrations up to 1 µg m−3in Mexico City center and 1 µg m−3in Tula
respectively. The ammonium concentration reduction in the center of Mexico City is up to 0.3 µg m−3. Sulfate concentration is not sensitive to changes of ammonia
emissions.
15
– A 50 % reduction of NOx emissions leads to a decrease of PM1 nitrate and
am-monium concentrations up to 1 µg m−3 and 0.3 µg m−3 respectively. PM
1 sulfate
concentration decreases by 0.2 µg m−3in Mexico City and increases by 0.3 µg m−3
in Tula.
Acknowledgements. This research was supported by the European Union and the 7th
frame-20
ACPD
11, 21995–22032, 2011Formation of semivolatile inorganic aerosols
V. A. Karydis et al.
Title Page
Abstract Introduction
Conclusions References
Tables Figures
◭ ◮
◭ ◮
Back Close
Full Screen / Esc
Printer-friendly Version Interactive Discussion
Discussion
P
a
per
|
Dis
cussion
P
a
per
|
Discussion
P
a
per
|
Discussio
n
P
a
per
|
References
Aiken, A. C., Salcedo, D., Cubison, M. J., Huffman, J. A., DeCarlo, P. F., Ulbrich, I. M., Docherty, K. S., Sueper, D., Kimmel, J. R., Worsnop, D. R., Trimborn, A., Northway, M., Stone, E. A., Schauer, J. J., Volkamer, R. M., Fortner, E., de Foy, B., Wang, J., Laskin, A., Shutthanandan, V., Zheng, J., Zhang, R., Gaffney, J., Marley, N. A., Paredes-Miranda, G., Arnott, W. P.,
5
Molina, L. T., Sosa, G., and Jimenez, J. L.: Mexico City aerosol analysis during MILAGRO using high resolution aerosol mass spectrometry at the urban supersite (T0) – Part 1: Fine particle composition and organic source apportionment, Atmos. Chem. Phys., 9, 6633–6653, doi:10.5194/acp-9-6633-2009, 2009.
Ansari, A. S. and Pandis, S. N.: Response of inorganic PM to precursor concentrations,
Envi-10
ron. Sci. Technol., 32, 2706–2714, 1998.
Ansari, A. S. and Pandis, S. N.: Prediction of multicomponent inorganic atmospheric aerosol behavior, Atmos. Environ., 33, 745–757, 1999a.
Ansari, A. S. and Pandis, S. N.: An analysis of four models predicting the partitioning of semivolatile inorganic aerosol components, Aerosol Sci. Technol., 31, 129–153, 1999b.
15
Ansari, A. S. and Pandis, S. N.: The effect of metastable equilibrium states on the partitioning of nitrate between the gas and aerosol phases, Atmos. Environ., 34, 157–168, 2000. Aumont, B., Chervier, F., and Laval, S.: Contribution of HONO sources to the NOx/HOx/O−3
chemistry in the polluted boundary layer, Atmos. Environ., 37, 487–498, 2003.
Bassett, M. and Seinfeld, J. H.: Atmospheric equilibrium-model of sulfate and nitrate aerosols,
20
Atmos. Environ., 17, 2237–2252, 1983.
Capaldo, K. P., Pilinis, C., and Pandis, S. N.: A computationally efficient hybrid approach for dynamic gas/aerosol transfer in air quality models, Atmos. Environ., 34, 3617–3627, 2000. Carter, W. P. L.: Implementation of the SAPRC-99 chemical mechanism into
the models-3 framework: http://citeseerx.ist.psu.edu/viewdoc/download?doi=10.1.1.25.
25
293&rep=rep1&type=pdf, last access: 25 February 2008, 2000.
Chow, J. C. and Egami, R. T.: San Joaquin Valley 1995 integrated monitoring study: Doc-umentation, evaluation, and descriptive data analysis of PM10, PM2
.5, and precursor gas measurements. Technical Support Studies No. 4 and No. 8. Final Report prepared for the Technical Support Division, California Air Resources Board, Sacramento, CA by Desert
Re-30
ACPD
11, 21995–22032, 2011Formation of semivolatile inorganic aerosols
V. A. Karydis et al.
Title Page
Abstract Introduction
Conclusions References
Tables Figures
◭ ◮
◭ ◮
Back Close
Full Screen / Esc
Printer-friendly Version Interactive Discussion
Discussion
P
a
per
|
Dis
cussion
P
a
per
|
Discussion
P
a
per
|
Discussio
n
P
a
per
|
Clegg, S. L., Brimblecombe, P., and Wexler, A. S.: Thermodynamic model of the system H+-NH+4-SO2−4 -NO−
3-H2O at tropospheric temperatures, J. Phys. Chem. A, 102, 2137–2154, 1998a.
Clegg, S. L., Brimblecombe, P., and Wexler, A. S.: Thermodynamic model of the system H+
-5
NH+4-Na+-SO2− 4 -NB
− 3-Cl
−-H
2O at 298.15 K, J. Phys. Chem. A, 102, 2155–2171, 1998b. DeCarlo, P. F., Dunlea, E. J., Kimmel, J. R., Aiken, A. C., Sueper, D., Crounse, J., Wennberg, P.
O., Emmons, L., Shinozuka, Y., Clarke, A., Zhou, J., Tomlinson, J., Collins, D. R., Knapp, D., Weinheimer, A. J., Montzka, D. D., Campos, T., and Jimenez, J. L.: Fast airborne aerosol size and chemistry measurements above Mexico City and Central Mexico during the MILAGRO
10
campaign, Atmos. Chem. Phys., 8, 4027–4048, doi:10.5194/acp-8-4027-2008, 2008. Draxler, R. R., Gillette, D. A., Kirkpatrick, J. S., and Heller, J.: Estimating PM10air
concentra-tions from dust storms in Iraq, Kuwait and Saudi Arabia, Atmos. Environ., 35, 4315–4330, 2001.
Environ: User’s guide to the comprehensive air quality model with extensions (CAMx). Version
15
4.02. Report prepared by ENVIRON International Corporation, Novato, CA, USA, 2003. Fahey, K. M. and Pandis, S. N.: Optimizing model performance: variable size resolution in cloud
chemistry modeling, Atmos. Environ., 35, 4471–4478, 2001.
Fast, J. D., de Foy, B., Rosas, F. A., Caetano, E., Carmichael, G., Emmons, L., McKenna, D., Mena, M., Skamarock, W., Tie, X., Coulter, R. L., Barnard, J. C., Wiedinmyer, C., and
20
Madronich, S.: A meteorological overview of the MILAGRO field campaigns, Atmos. Chem. Phys., 7, 2233–2257, doi:10.5194/acp-7-2233-2007, 2007.
Fountoukis, C. and Nenes, A.: ISORROPIA II: a computationally efficient thermodynamic equilibrium model for K+-Ca2+-Mg2+-NH+4-Na+-SO2−4 -NO−
3-Cl −-H
2O aerosols, Atmos. Chem. Phys., 7, 4639–4659, doi:10.5194/acp-7-4639-2007, 2007.
25
Fountoukis, C., Nenes, A., Sullivan, A., Weber, R., Van Reken, T., Fischer, M., Matias, E., Moya, M., Farmer, D., and Cohen, R. C.: Thermodynamic characterization of Mexico City aerosol during MILAGRO 2006, Atmos. Chem. Phys., 9, 2141–2156, doi:10.5194/acp-9-2141-2009, 2009.
Gaydos, T. M., Koo, B., Pandis, S. N., and Chock, D. P.: Development and application
30
ACPD
11, 21995–22032, 2011Formation of semivolatile inorganic aerosols
V. A. Karydis et al.
Title Page
Abstract Introduction
Conclusions References
Tables Figures
◭ ◮
◭ ◮
Back Close
Full Screen / Esc
Printer-friendly Version Interactive Discussion
Discussion
P
a
per
|
Dis
cussion
P
a
per
|
Discussion
P
a
per
|
Discussio
n
P
a
per
|
Hildemann, L. M., Russell, A. G., and Cass, G. R.: Ammonia and nitric-acid concentrations in equilibrium with atmospheric aerosols – experiment vs theory, Atmos. Environ., 18, 1737– 1750, 1984.
Hodzic, A., Jimenez, J. L., Madronich, S., Aiken, A. C., Bessagnet, B., Curci, G., Fast, J., Lamarque, J. F., Onasch, T. B., Roux, G., Schauer, J. J., Stone, E. A., and Ulbrich, I. M.:
Mod-5
eling organic aerosols during MILAGRO: importance of biogenic secondary organic aerosols, Atmos. Chem. Phys., 9, 6949–6981, doi:10.5194/acp-9-6949-2009, 2009.
Hodzic, A., Jimenez, J. L., Madronich, S., Canagaratna, M. R., DeCarlo, P. F., Kleinman, L., and Fast, J.: Modeling organic aerosols in a megacity: potential contribution of semi-volatile and intermediate volatility primary organic compounds to secondary organic aerosol formation,
10
Atmos. Chem. Phys., 10, 5491–5514, doi:10.5194/acp-10-5491-2010, 2010.
Jacobson, M. Z., Tabazadeh, A., and Turco, R. P.: Simulating equilibrium within aerosols and nonequilibrium between gases and aerosols, J. Geophys. Res.-Atmos., 101, 9079–9091, 1996.
Jacobson, M. Z.: Development and application of a new air pollution modeling system .2.
15
Aerosol module structure and design, Atmos. Environ., 31, 131–144, 1997a.
Jacobson, M. Z.: Numerical techniques to solve condensational and dissolutional growth equa-tions when growth is coupled to reversible reacequa-tions, Aerosol Sci. Technol., 27, 491–498, 1997b.
Jacobson, M. Z.: Studying the effects of calcium and magnesium on size-distributed nitrate and
20
ammonium with EQUISOLV II, Atmos. Environ., 33, 3635-3649, 1999.
Karydis, V. A., Tsimpidi, A. P., Fountoukis, C., Nenes, A., Zavala, M., Lei, W. F., Molina, L. T., and Pandis, S. N.: Simulating the fine and coarse inorganic particulate matter concentrations in a polluted megacity, Atmos. Environ., 44, 608–620, doi:10.1016/j.atmosenv.2009.11.023, 2010.
25
Kim, Y. P. and Seinfeld, J. H.: Atmospheric gas-aerosol equilibrium .3. Thermodynamics of crustal elements Ca2+, K+, and Mg2+, Aerosol Sci. Technol., 22, 93–110, 1995.
Kim, Y. P., Seinfeld, J. H., and Saxena, P.: Atmospheric gas aerosol equilibrium .1. Thermody-namic model, Aerosol Sci. Technol., 19, 157–181, 1993a.
Kim, Y. P., Seinfeld, J. H., and Saxena, P.: Atmospheric gas-aerosol equilibrium .2. Analysis of
30
ACPD
11, 21995–22032, 2011Formation of semivolatile inorganic aerosols
V. A. Karydis et al.
Title Page
Abstract Introduction
Conclusions References
Tables Figures
◭ ◮
◭ ◮
Back Close
Full Screen / Esc
Printer-friendly Version Interactive Discussion
Discussion
P
a
per
|
Dis
cussion
P
a
per
|
Discussion
P
a
per
|
Discussio
n
P
a
per
|
Koo, B. Y., Ansari, A. S., and Pandis, S. N.: Integrated approaches to modeling the or-ganic and inoror-ganic atmospheric aerosol components, Atmos. Environ., 37, 4757–4768, doi:10.1016/j.atmosenv.2003.08.016, 2003.
Kumar, N., Lurmann, F. W., Pandis, S. N., and Ansari, A. S.: Final Report: analysis of atmo-spheric chemistry during 1995 integrated monitoring study. Final Report Prepared for the
5
California Air Resources Board, Sacramento, CA by Sonoma Technology Inc., Santa Rosa, CA, USA, STI-997214-1791-DFR, 1998.
Lane, T. E., Donahue, N. M., and Pandis, S. N.: Simulating secondary organic aerosol formation using the volatility basis-set approach in a chemical transport model, Atmos. Environ., 42, 7439–7451, doi:10.1016/j.atmosenv.2008.06.026, 2008.
10
Lawson, D. R.: The southern california air-quality study, J. Air Waste Manage. Assoc., 40, 156–165, 1990.
Li, G., Lei, W., Zavala, M., Volkamer, R., Dusanter, S., Stevens, P., and Molina, L. T.: Impacts of HONO sources on the photochemistry in Mexico City during the MCMA-2006/MILAGO Campaign, Atmos. Chem. Phys., 10, 6551–6567, doi:10.5194/acp-10-6551-2010, 2010.
15
Li, G., Zavala, M., Lei, W., Tsimpidi, A. P., Karydis, V. A., Pandis, S. N., Canagaratna, M. R., and Molina, L. T.: Simulations of organic aerosol concentrations in Mexico City using the WRF-CHEM model during the MCMA-2006/MILAGRO campaign, Atmos. Chem. Phys., 11, 3789–3809, doi:10.5194/acp-11-3789-2011, 2011.
Lurmann, F. W., Wexler, A. S., Pandis, S. N., Musarra, S., Kumar, N., and Seinfeld, J. H.:
20
Modelling urban and regional aerosols .2. Application to California’s South Coast Air Basin, Atmos. Environ., 31, 2695–2715, 1997.
Meng, Z. Y., Seinfeld, J. H., Saxena, P., and Kim, Y. P.: Atmospheric gas-aerosol equilibrium .4. Thermodynamics of carbonates, Aerosol Sci. Technol., 23, 131–154, 1995.
Meng, Z. Y., Dabdub, D., and Seinfeld, J. H.: Size-resolved and chemically resolved model of
25
atmospheric aerosol dynamics, J. Geophys. Res.-Atmos., 103, 3419–3435, 1998.
Molina, L. T. and Molina, M. J.: Air Quality in the Mexico Megacity: An Integrated Assessment, Kluwer Academic Publishers, The Netherlands, 2002.
Molina, L. T., Madronich, S., Gaffney, J. S., Apel, E., de Foy, B., Fast, J., Ferrare, R., Herndon, S., Jimenez, J. L., Lamb, B., Osornio-Vargas, A. R., Russell, P., Schauer, J. J., Stevens, P.
30
ACPD
11, 21995–22032, 2011Formation of semivolatile inorganic aerosols
V. A. Karydis et al.
Title Page
Abstract Introduction
Conclusions References
Tables Figures
◭ ◮
◭ ◮
Back Close
Full Screen / Esc
Printer-friendly Version Interactive Discussion
Discussion
P
a
per
|
Dis
cussion
P
a
per
|
Discussion
P
a
per
|
Discussio
n
P
a
per
|
Murphy, B. N. and Pandis, S. N.: Simulating the Formation of Semivolatile Primary and Sec-ondary Organic Aerosol in a Regional Chemical Transport Model, Environ. Sci. Technol., 43, 4722–4728, doi:10.1021/es803168a, 2009.
Nenes, A., Pandis, S. N., and Pilinis, C.: ISORROPIA: A new thermodynamic equilibrium model for multiphase multicomponent inorganic aerosols, Aqua. Geochem., 4, 123–152, 1998.
5
Nenes, A., Pandis, S. N., and Pilinis, C.: Continued development and testing of a new ther-modynamic aerosol module for urban and regional air quality models, Atmos. Environ., 33, 1553–1560, 1999.
Pandis, S. N., Wexler, A. S., and Seinfeld, J. H.: Secondary organic aerosol formation and transport .2. Predicting the ambient secondary organic aerosol-size distribution, Atmos.
En-10
viron., 27, 2403–2416, 1993.
Pilinis, C. and Seinfeld, J. H.: Continued development of a general equilibrium-model for inor-ganic multicomponent atmospheric aerosols, Atmos. Environ., 21, 2453–2466, 1987. Pilinis, C. and Seinfeld, J. H.: Development and evaluation of an eulerian photochemical gas
aerosol model, Atmos. Environ., 22, 1985–2001, 1988.
15
Pilinis, C., Capaldo, K. P., Nenes, A., and Pandis, S. N.: MADM – A new multicomponent aerosol dynamics model, Aerosol Sci. Technol., 32, 482–502, 2000.
Racherla, P. N. and Adams, P. J.: Sensitivity of global tropospheric ozone and fine partic-ulate matter concentrations to climate change, J. Geophys. Res.-Atmos., 111, D24103, doi:10.1029/2005jd006939, 2006.
20
Russell, A. G., McCue, K. F., and Cass, G. R.: Mathematical-modeling of the formation of nitrogen-containing air-pollutants .1. Evaluation of an eulerian photochemical model, Envi-ron. Sci. Technol., 22, 263–270, 1988.
Saxena, P., Hudischewskyj, A. B., Seigneur, C., and Seinfeld, J. H.: A comparative-study of equilibrium approaches to the chemical characterization of secondary aerosols, Atmos.
En-25
viron., 20, 1471–1483, 1986.
Seinfeld, J. H., and Pandis, S. N.: Atmospheric Chemistry and Physics: From Air Pollution to Climate Change, Second ed., John Wiley & Sons, Inc., Hoboken, New Jersey, USA, 2006. Tanner, R. L.: An ambient experimental-study of phase-equilibrium in the atmospheric system–
aerosol H+, NH+4,SO2−
4 , NO−3-NH3(g), HNO3(g), Atmos. Environ., 16, 2935–2942, 1982.
30
ACPD
11, 21995–22032, 2011Formation of semivolatile inorganic aerosols
V. A. Karydis et al.
Title Page
Abstract Introduction
Conclusions References
Tables Figures
◭ ◮
◭ ◮
Back Close
Full Screen / Esc
Printer-friendly Version Interactive Discussion
Discussion
P
a
per
|
Dis
cussion
P
a
per
|
Discussion
P
a
per
|
Discussio
n
P
a
per
|
Tsimpidi, A. P., Karydis, V. A., and Pandis, S. N.: Response of inorganic fine particulate matter to emission changes of sulfur dioxide and ammonia: The eastern United States as a case study, J. Air Waste Manage. Assoc., 57, 1489–1498, doi:10.3155/1047-3289.57.12.1489, 2007.
Tsimpidi, A. P., Karydis, V. A., Zavala, M., Lei, W., Molina, L., Ulbrich, I. M., Jimenez, J. L.,
5
and Pandis, S. N.: Evaluation of the volatility basis-set approach for the simulation of organic aerosol formation in the Mexico City metropolitan area, Atmos. Chem. Phys., 10, 525–546, doi:10.5194/acp-10-525-2010, 2010.
Tsimpidi, A. P., Karydis, V. A., Zavala, M., Lei, W., Bei, N., Molina, L., and Pandis, S. N.: Sources and production of organic aerosol in Mexico City: insights from the combination of
10
a chemical transport model (PMCAMx-2008) and measurements during MILAGRO, Atmos. Chem. Phys., 11, 5153–5168, doi:10.5194/acp-11-5153-2011, 2011.
Vega, E., Mugica, V., Reyes, E., Sanchez, G., Chow, J. C., and Watson, J. G.: Chemical composition of fugitive dust emitters in Mexico City, Atmos. Environ., 35, 4033–4039, 2001. Watson, J. G., Chow, J. C., Lurmann, F. W., and Musarra, S. P.: Ammonium-nitrate, nitric-acid,
15
and ammonia equilibrium in wintertime Phoenix, Arizona, J. Air Waste Manage. Assoc., 44, 405-412, 1994.
Wexler, A. S. and Seinfeld, J. H.: 2nd-generation inorganic aerosol model, Atmos. Environ., 25, 2731–2748, 1991.
Ying, Z., Tie, X., Madronich, S., Li, G., and Massie, S.: Simulation of regional dust and its effect
20
on photochemistry in the Mexico City area during MILAGRO experiment, Atmos. Environ., 45, 2549–2558, 2011.
Zhang, J., Chameides, W. L., Weber, R., Cass, G., Orsini, D., Edgerton, E., Jongejan, P., and Slanina, J.: An evaluation of the thermodynamic equilibrium assumption for fine particulate composition: Nitrate and ammonium during the 1999 Atlanta Supersite Experiment, J.
Geo-25
phys. Res.-Atmos., 108, 8414, doi:10.1029/2001jd001592, 2002.
Zhang, Y., Seigneur, C., Seinfeld, J. H., Jacobson, M., Clegg, S. L., and Binkowski, F. S.: A comparative review of inorganic aerosol thermodynamic equilibrium modules: similarities, differences, and their likely causes, Atmos. Environ., 34, 117–137, 2000.
Zhang, Y., Dubey, M. K., Olsen, S. C., Zheng, J., and Zhang, R.: Comparisons of WRF/Chem
30
ACPD
11, 21995–22032, 2011Formation of semivolatile inorganic aerosols
V. A. Karydis et al.
Title Page
Abstract Introduction
Conclusions References
Tables Figures
◭ ◮
◭ ◮
Back Close
Full Screen / Esc
Printer-friendly Version Interactive Discussion
Discussion
P
a
per
|
Dis
cussion
P
a
per
|
Discussion
P
a
per
|
Discussio
n
P
a
per
|
Zheng, J., Zhang, R., Fortner, E. C., Volkamer, R. M., Molina, L., Aiken, A. C., Jimenez, J. L., Gaeggeler, K., Dommen, J., Dusanter, S., Stevens, P. S., and Tie, X.: Measure-ments of HNO3 and N2O5 using ion drift-chemical ionization mass spectrometry during the MILAGRO/MCMA-2006 campaign, Atmos. Chem. Phys., 8, 6823–6838, doi:10.5194/acp-8-6823-2008, 2008.
ACPD
11, 21995–22032, 2011Formation of semivolatile inorganic aerosols
V. A. Karydis et al.
Title Page
Abstract Introduction
Conclusions References
Tables Figures
◭ ◮
◭ ◮
Back Close
Full Screen / Esc
Printer-friendly Version Interactive Discussion
Discussion
P
a
per
|
Dis
cussion
P
a
per
|
Discussion
P
a
per
|
Discussio
n
P
a
per
|
Table 1.Aerosol concentrations (µg m−3) at the boundaries of the domain.
Species South Boundary West Boundary East Boundary North Boundary
Sulfate 1.7 3.0 2.6 1.4
Ammonium 0.3 1.0 1.0 0.4
Nitrate 1.4 0.7 1.2 1.2
Chloride 3.2 0.8 1.1 1.1
Sodium 2.7 0.7 1 0.9
Calcium 0.1 0.1 0.1 0.1
Magnesium 0.2 0.1 0.1 0.1
Potassium 0.1 0.1 0.1 0.1
ACPD
11, 21995–22032, 2011Formation of semivolatile inorganic aerosols
V. A. Karydis et al.
Title Page
Abstract Introduction
Conclusions References
Tables Figures
◭ ◮
◭ ◮
Back Close
Full Screen / Esc
Printer-friendly Version Interactive Discussion
Discussion
P
a
per
|
Dis
cussion
P
a
per
|
Discussion
P
a
per
|
Discussio
n
P
a
per
|
Fig. 3. Predicted average ground level concentrations of PM1−10 (a) sulfate, (b) nitrate, (c)
ACPD
11, 21995–22032, 2011Formation of semivolatile inorganic aerosols
V. A. Karydis et al.
Title Page
Abstract Introduction
Conclusions References
Tables Figures
◭ ◮
◭ ◮
Back Close
Full Screen / Esc
Printer-friendly Version Interactive Discussion
Discussion
P
a
per
|
Dis
cussion
P
a
per
|
Discussion
P
a
per
|
Discussio
n
P
a
per
|
Fig. 4. Comparison of model hourly predictions against measurements for PM1 sulfate taken at T0(a)and PM2