Protein Encoded by the Osteoarthritis Susceptibility
Gene
GDF5
Madhushika Ratnayake1*, Frank Plo¨ger2, Mauro Santibanez-Koref3, John Loughlin1
1Musculoskeletal Research Group, Institute of Cellular Medicine, Newcastle University, Newcastle upon Tyne, United Kingdom,2Biopharm GmbH, Heidelberg, Germany, 3Institute of Genetic Medicine, Newcastle University, Newcastle upon Tyne, United Kingdom
Abstract
A genetic deficit mediated by SNP rs143383 that leads to reduced expression ofGDF5is strongly associated with large-joint osteoarthritis. We speculated that this deficit could be attenuated by the application of exogenous GDF5 protein and as a first step we have assessed what effect such application has on primary osteoarthritis chondrocyte gene expression. Chondrocytes harvested from cartilage of osteoarthritic patients who had undergone joint replacement were cultured with wildtype recombinant mouse and human GDF5 protein. We also studied variants of GDF5, one that has a higher affinity for the receptor BMPR-IA and one that is insensitive to the GDF5 antagonist noggin. As a positive control, chondrocytes were treated with TGF-b1. Chondrocytes were cultured in monolayer and micromass and the expression of genes coding for catabolic and anabolic proteins of cartilage were measured by quantitative PCR. The expression of the GDF5 receptor genes and the presence of their protein products was confirmed and the ability of GDF5 signal to translocate to the nucleus was demonstrated by the activation of a luciferase reporter construct. The capacity of GDF5 to elicit an intracellular signal in chondrocytes was demonstrated by the phosphorylation of intracellular Smads. Chondrocytes cultured with TGF-b1 demonstrated a consistent down regulation ofMMP1,MMP13and a consistent upregulation ofTIMP1and COL2A1with both culture techniques. In contrast, chondrocytes cultured with wildtype GDF5, or its variants, did not show any consistent response, irrespective of the culture technique used. Our results show that osteoarthritis chondrocytes do not respond in a predictable manner to culture with exogenous GDF5. This may be a cause or a consequence of the osteoarthritis disease process and will need to be surmounted if treatment with exogenous GDF5 is to be advanced as a potential means to overcome the genetic deficit conferring osteoarthritis susceptibility at this gene.
Citation:Ratnayake M, Plo¨ger F, Santibanez-Koref M, Loughlin J (2014) Human Chondrocytes Respond Discordantly to the Protein Encoded by the Osteoarthritis Susceptibility GeneGDF5. PLoS ONE 9(1): e86590. doi:10.1371/journal.pone.0086590
Editor:Stuart Raleigh, University of Northampton, United Kingdom
ReceivedSeptember 6, 2013;AcceptedDecember 16, 2013;PublishedJanuary 21, 2014
Copyright:ß2014 Ratnayake et al. This is an open-access article distributed under the terms of the Creative Commons Attribution License, which permits unrestricted use, distribution, and reproduction in any medium, provided the original author and source are credited.
Funding:This Research was funded by the NIHR Newcastle Biomedical Research Centre, by the European Union Seventh Framework Programme (FP7/2007– 2013) under grant agreement number 305815 (D-BOARD), and by Arthritis Research UK. The funders had no role in study design, data collection and analysis, decision to publish, or preparation of the manuscript.
Competing Interests:Frank Plo¨ger is an employee of the company Biopharm GmbH. Biopharm GmbH is a 100% privately owned company. This does not alter the authors’ adherence to all the PLOS ONE policies on sharing data and materials.
* E-mail: madhushika.ratnayake@ncl.ac.uk
Introduction
Growth differentiation factor 5 (GDF5) is closely related to the bone morphogenetic proteins (BMPs) and is a member of the transforming growth factor- b (TGF-b) superfamily. GDF5 is involved in bone and cartilage development, maintenance and repair and is a marker for early joint formation [1].
GDF5 signalling requires both BMP receptor type II (BMPR-II) and BMP receptor type IB (BMPR-IB). BMPR-II is constitutively active and upon ligand binding, transphosphorylates BMPR-IB [2]. This leads to the phosphorylation of the downstream Smad1/ 5/8 signalling molecules. Although GDF5 shows binding affinity towards BMP receptor type IA (BMPR-IA), GDF5 has been shown to exhibit a 17-fold higher affinity towards BMPR-IB, compared to BMPR-IA [2]. The phosphorylated Smad 1/5/8 then complexes with Smad 1/4, and the complex translocates into the nucleus and regulates transcription of target genes [3]. These targets includeCOL2A1andACAN, which encode type II collagen and aggrecan, the principal structural proteins of cartilage [4].
GDF5 signalling can be negatively regulated by soluble proteins including noggin, which binds to GDF5 extracellularly and blocks its interaction with the cell surface receptors [5,6].
The importance of GDF5 in the development of synovial joints has been shown in mouse models and human diseases. The presence of a frame shift mutation inGdf5 in the brachypodism mouse results in the inability to form (homozygote) or to maintain (heterozygote) normal synovial joint function [7]. Human chon-drodysplasias caused by mutations in GDF5 include Hunter-Thompson syndrome, Grebe syndrome and Brachydactyly type C, which are associated with various skeletal abnormalities [8].
As the role of GDF5 in skeletogenesis is well established,GDF5
(UTR) of GDF5 (rs143383, C/T) as being associated with OA. The Asian report of OA association to rs143383 was quickly replicated in a European study [10]. Cartilage is synthesised and maintained by a single cell type, the chondrocyte, and reduced transcription in the chondrocytes of OA patients of the T-allele of rs143383 relative to its C- allele has been demonstrated [11]. Overall, these results suggest that theGDF5OA susceptibility is mediated through a reduction in expression of the gene.
Several animal studies have reported on the use of GDF5 in therapeutics. Studies in rats have shown that GDF5 can be used to stimulate tendon healing [12,13]. GDF5 has also been shown to be effective in repair or slowing down the degeneration of interver-tebral discs in mouse, rabbit and bovine models [14–17]. Also, it has been reported that GDF5 enhanced chondrogenic differenti-ation and hypertrophy of human MSCs, thus showing potential to be used as a therapeutic in fracture repair [18].
Two publications have shown promising results of the stimulatory effects of GDF5 on matrix synthesis in human articular chondrocytes in vitro. Bobacz et al. [19] showed an increase in glycosaminoglycan (GAG) synthesis in normal and OA chondrocytes cultured with GDF5, and an increase inACAN
mRNA levels. Chubinskaya et al. [20] observed an increase in GAG synthesis in alginate bead cultures of chondrocytes in the presence of GDF5.
The fact that the OA associated T-allele of rs143383 mediates reduced expression ofGDF5has led to us hypothesising that one means of alleviating this genetic deficit could be via the supply of exogenous GDF5 to chondrocytes. Investigating the logistics of this is the aim of this report. Chondrocytes harvested from OA patients that had undergone total hip or total knee replacement surgery were cultured with or without recombinant GDF5. We then assessed whether this triggers expression changes of genes involved in metabolic processes in chondrocytes.
Materials and Methods
Ethics Statement and Cartilage Samples from OA Patients The Newcastle and North Tyneside research ethics committees granted ethical approval for the collection of cartilage from patients undergoing hip or knee joint replacement for primary OA (REC reference number 09/H0906/72). Each donor provided informed consent. The project was discussed with the donor verbally by a trained research nurse and if the donor agreed to participate written consent was then taken. This consent procedure was approved by the ethics committee and the written consent was then filed by the consenting nurse. OA status was confirmed using pre-operative records. All patients had full-thickness cartilage lesions.
Cartilage Digestion and Chondrocyte Culture with Exogenous GDF5
Chondrocytes were isolated by enzymatic digestion of cartilage as previously described [21]. The cells were cultured in DMEM culture media supplemented with 10% FBS, 2 mM glutamine, 100 U/ml penicillin, 100mg/ml streptomycin and 50 U/ml nyastatin.
For western blot analysis, chondrocytes were cultured at 350,000 cells/well in 6-well cell culture plates in 2 ml of culture media. Once 80% confluent, the cells were cultured in serum-free media overnight, before stimulation with 100 ng/ml of each of the GDF5 proteins. Cells were isolated at four different time points after stimulation (15 minutes, 30 minutes, 1 hour and 2 hours). TGF-b1 (5 ng/ml) stimulation for one hour was used as a positive control.
For gene expression analysis, chondrocytes were cultured in monolayer and as high-density micromass. For monolayer culture, chondrocytes were cultured at 10,000 cells/well in 96-well cell culture plates in 200ml of DMEM culture media until 80% confluent. Cells were then cultured in serum-free media overnight. Five plates were established since the cells were to be isolated at five different time points (0 hours, 6 hours, 12 hours, 24 hours and 48 hours). Six wells per time point were used for each treatment group (untreated, mouse GDF5, human wild type GDF5 and the two variants A and B). For micromass culture, chondrocytes were cultured in wells of a 24-well culture plate at a density of 400,000 cells/well in 20ml droplets of media. Four replicates were prepared for each treatment group (untreated, 100 ng/ml mouse, human wildtype GDF5, human GDF5 variants A and B, and 5 ng/ml human TGF-b1). The cells were incubated at 37uC for 2 hours and 400ml of media containing the growth factors was then added and the cells were incubated for 5 days. In all experiments, untreated control wells received serum-free media and cells were incubated at 37uC until the time points were reached. Details regarding the 25 patients studied using monolayer analysis and the 19 patients studied using micromass analysis are listed in supplementary Tables S1 and S2 respectively.
Gene Expression Analysis Using Quantitative Real Time PCR
TaqMan primers and probes were used to analyse gene expression changes in a panel of genes (Table S3). Gene expression was measured relative to the housekeeping genesGAPDH,HPRT1
and18S. Reactions were performed on an ABI PRISM 7900HT Real Time PCR System. The relative expression for each gene was analysed using the comparative cycle threshold (Ct) method using SDS 2.3 software (Applied Biosystems).
For gene expression analysis directly from cartilage tissues, 1mg of RNA was extracted from the tissues as described previously [11]. cDNA was then synthesised using a SuperScript First-Strand cDNA Synthesis kit (Invitrogen) according to the manufacturer’s instructions.
For gene expression analysis of chondrocytes cultured in monolayer, at appropriate time points the cells were lysed using 30ml of Cells-to-cDNA II Cell Lysis Buffer (Ambion) at 75uC for 15 minutes. Eightml of the cell lysate was reverse transcribed using First-Strand cDNA Synthesis kit using M-MLV reverse transcrip-tase (Invitrogen) according to the manufacturer’s instructions.
For gene expression analysis of chondrocytes cultured in micromass, the cells were washed in PBS and scraped off the surface of the well using a pipette tip. The cells in PBS were centrifuged at 13,000 rpm for 5 minutes to obtain a cell pellet. RNAs were isolated from the cell pellets using the Trizol/ chloroform method according to manufacturer’s guidelines (Invitrogen) and were taken forward for cDNA synthesis.
Western Blot Analysis
Signalling, cat no. 9511), overnight. Anti-b-actin (Sigma, cat no. A5316) antibody was used as a loading control. Enhanced chemiluminescent reagent (GE Healthcare) was used for visual-isation of the proteins using a G:BOX gel doc system (Syngene).
Transfection of SW1353 Cells with Smad 1/5/8 Luciferase Reporter Vector
Cells from the human chondrosarcoma cell line SW1353 [22] were cultured at 17, 500 cells/well in 48-well cell culture plates in 300ml of DMEM/F-12 media (Gibco) containing 10% FBS to 80% confluence. Cells were co-transfected with 15 ng of Renilla
vector DNA (Promega) as an internal control and 500 ng of basic
pGL3-Smad responsive reporter vector DNA using ExGen 500in -vitro transfection reagent (Fermentas) following the manufacturer’s protocol. The Smad responsive reporter vector contains six consecutive copies of the Smad-binding element, 59 -CCCGTC-TGCCCCAGCCCAGACACCGTCGACCAAC-39[23]. The cells were incubated at 37uC for 24 hours.
Stimulation of Cells with Exogenous Growth Factors (GDF5, TGF-b1 and BMP-2) Post Transfection
Twenty-four hours post transfection, the cells were incubated in 150ml of serum-free media at 37uC overnight. The cells were stimulated with four different recombinant GDF5 proteins (mouse GDF5, R&D Systems; human wild type GDF5 and two variants A and B, Biopharm GmbH) at 10 ng/ml, 30 ng/ml, 100 ng/ml and 300 ng/ml. Recombinant human TGF-b1 (5 ng/ml; R&D Systems) and BMP2 (100 ng/ml; R&D Systems) were also used as positive controls. The experiment was performed in four replicates. The plates were incubated at 37uC and lysed at 6 hours, 12 hours, 24 hours and 48 hours post stimulation. All of the proteins are the active forms of the signalling molecules, free of the latency-associated peptides.
Luciferase Reporter Assay
The cells were lysed at each time point using 65ml of 16Passive Lysis Buffer (Promega). Dual-Luciferase Reporter assay system (Promega) was used to measure luciferase activity in the transfected cells, following manufacturer’s instructions.
Figure 1. GDF5 receptor gene expression.Gene expression was measured in cartilage (A), in monolayer culture (B) and in micromass culture (C) relative to the housekeepers,18S,GAPDHandHPRT1. The error bars represent the standard error of the mean.
doi:10.1371/journal.pone.0086590.g001
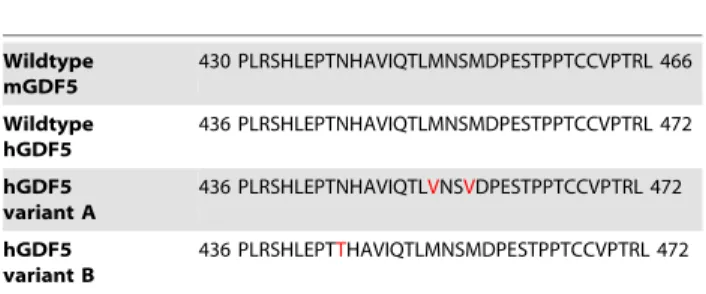
Table 1.The amino acid substitutions of GDF5 variants A and B.
Wildtype mGDF5
430 PLRSHLEPTNHAVIQTLMNSMDPESTPPTCCVPTRL 466
Wildtype hGDF5
436 PLRSHLEPTNHAVIQTLMNSMDPESTPPTCCVPTRL 472
hGDF5 variant A
436 PLRSHLEPTNHAVIQTLVNSVDPESTPPTCCVPTRL 472
hGDF5 variant B
436 PLRSHLEPTTHAVIQTLMNSMDPESTPPTCCVPTRL 472
Statistical Analysis
GraphPad Prism software was used for generating graphs and performing statistical analyses. A P-value of less than 0.05 was considered significant.
For luciferase activity measurements, the absorbance for firefly luciferase was divided by that for Renilla luciferase. A two tailed student’s t-test was used to compare the normalised values for untreated cells versus cells stimulated with exogenous growth factors.
For gene expression analyses, the gene expression relative to housekeeping genes (2‘-(Ct of target gene – average Ct of housekeeping genes)) was calculated for each treatment. A two tailed student’st-test was performed to compare the untreated cells
against the treated cells. The fold change in gene expression between the treated and untreated cells was calculated for each patient. A Wilcoxon signed rank test was then performed on the fold change in gene expression for each gene analysed, to determine if the data deviate significantly from a hypothetical value of 1, which signifies no change in gene expression.
Results
GDF5 Receptor Genes are Expressed in OA Cartilage and in Cultured OA Chondrocytes
In order to investigate the effect of adding exogenous GDF5 to chondrocytes, it was important to first assess whether chondrocytes Figure 2. Dose response analysis using a Smad responsive reporter assay.Y-axis represents the luciferase activity readings generated in SW1353 cells in response to exogenous growth factor. Cells were stimulated for 6, 12, 24 and 48 hours with wildtype mouse GDF5 (A), wildtype human GDF5 (B), human GDF5 variant A (C) and human GDF5 variant B (D). BMP2 and TGF-b1 stimulations were used as positive controls. Error bars represent the standard error of the mean. GDF5 10, 10 ng/ml; GDF 30, 30 ng/ml; GDF5 100, 100 ng/ml; GDF5 300, 300 ng/ml. *P,0.05, **P,0.01, ***P,0.001, ****P,0.0001, *****P,0.00001, two-tailed Student’s t-test.
doi:10.1371/journal.pone.0086590.g002
from OA patients expressed the genes BMPR-II, BMPR-IA and
BMPR-IB, which encode the receptors that GDF5 binds to. We therefore measured the expression of these receptor genes by quantitative real time PCR (qPCR) using cDNA synthesised from RNA extracted directly from the cartilage tissue of 10 OA patients (3 hip and 7 knee). All three receptor genes, in particularBMPR-II
and BMPR-IA, were expressed (Figure 1A). The expression of
BMPR-IA, which encodes the alternative type I receptor that GDF5 binds to, was 60 fold (P = 7.261027) higher compared to
BMPR-IB, which encodes the receptor towards which GDF5 shows preferential activity. There was no significant difference (P,0.05) in the expression of BMPR-II, BMPR-IA orBMPR-IB
between hip and knee cartilage.
We next measured the gene expression ofBMPR-II,BMPR-IA
andBMPR-IB in chondrocytes that had been extracted from the cartilage of 5 OA patients and then cultured in monolayer (Figure 1B), and in chondrocytes that had been extracted from the cartilage of 8 OA patients and then cultured in micromass (Figure 1C). In both instances the cells showed a similar gene expression pattern to that observed in cartilage tissue, with a 22 fold (P = 0.02) higherBMPR-IAexpression compared toBMPR-IB
expression in monolayer and a 65 fold (P = 1.361025) higher
BMPR-IA expression compared to BMPR-IB expression in micromass.
Protein extracted from chondrocytes from the cartilage of 3 OA patients were analysed by western blot to determine if BMPR-II, BMPR-IA and BMPR-IB proteins were expressed in these cells. The receptor expression pattern correlated with gene expression analyses, such that the cells showed higher levels of expression of BMPR-II and BMPR-IA compared to BMPR-IB (Figure S1).
Four GDF5 Proteins were Examined
The above results demonstrated that the expression ofBMPR-IA
and its protein product was higher in chondrocytes compared to expression of BMPR-IB and its protein product. Therefore, we chose to include in our study a recombinant human variant form of GDF5 that was designed by Biopharm GmbH (Heidelberg, Germany) to show increased specificity for BMPR-IA compared to BMPR-IB (variant A). In addition, we used a second variant form of GDF5, also designed by Biopharm that is insensitive to the GDF5 antagonist noggin (variant B). Therefore, we used four different recombinant GDF5 proteins in total: wildtype mouse (R&D Systems), wildtype human (Biopharm) and the two variants, A and B. All four are the mature form of GDF5. The amino acid sequence difference between the mouse and human GDF5 is a single amino acid: asparagine at position 380 in mouse is a threonine at the comparable position (386) in human. Table 1 shows the sequence of the four GDF5 proteins encompassing the changes introduced in variants A and B. Variant A was designed by introducing two point mutations in GDF5 to swap two methionine residues to valine residues at positions 453 and 456 [24,25]. Variant B was designed by exchanging the asparagine residue at position 445 in GDF5 with threonine [26].
All Four GDF5 Proteins Elicit Smad Signalling at 100 ng/ ml
5 ng/ml) [28] treatments were used as positive controls. We initially performed these experiments in OA chondrocytes, but were unsuccessful at transfecting these cells with the reporter. We therefore used instead the human SW1353 chondrosarcoma cell line [22] to carry out the dose response analyses. These cells show a similar GDF5 receptor gene expression profile to that observed in cartilage and in cultured chondrocytes, with a 15 fold (P = 0.0005) higher expression ofBMPR-IA compared to BMPR-IB(Figure S2).
The cells stimulated with 10 ng/ml and 30 ng/ml of mouse GDF5 showed a significant increase in luciferase activity at 6 hours after stimulation, compared to untreated cells. However a significant effect was not seen at these doses at the two other time points analysed. The cells treated with 100 ng/ml and
300 ng/ml of mouse GDF5 showed a significant increase in luciferase activity compared to untreated cells at all time points analysed (Figure 2A).
Stimulation of cells with 10 ng/ml of wildtype human GDF5 did not increase luciferase activity compared to untreated cells at any of the time points analysed. Stimulation with 30 ng/ml increased luciferase activity only at 6 hours after stimulation. Cells cultured with 100 ng/ml GDF5 showed a significant increase in luciferase readings at all time points. Treatment with 300 ng/ml of wildtype human GDF5 resulted in a significant increase in luciferase activity at 6, 12 and 48 hour time points, but not at 24 hours (Figure 2B).
Stimulation of cells with 10 ng/ml of human GDF5 variant A did not result in a significant increase in luciferase activity, and Figure 4. Gene expression changes in monolayer chondrocytes treated with GDF5 or TGF-b1 compared to untreated cells. Chondrocytes were stimulated for 6, 12, 24 and 48 hours with wildtype mouse GDF5 (A), wildtype human GDF5 (B), human GDF5 variant A (C), human GDF5 variant B (D) and TGF-b1 (E). Each cross represents a significant (P,0.05, two-tailed Student’s t-test) up/down regulation of gene expression relative to untreated cells in one patient. Twelve patients were studied for each of the GDF5 growth factor treatments and ten patients for the TGF-b1 treatments.
doi:10.1371/journal.pone.0086590.g004
cells stimulated with 30 ng/ml of variant A showed a significant increase only at 6 hours post stimulation. Cells cultured with 100 ng/ml of variant A showed a significant increase in luciferase readings at all time points. Stimulation with 300 ng/ml of variant A resulted in a significant increase in luciferase at 6, 24 and 48 hours post stimulation, but not at 12 hours (Figure 2C).
The cells cultured with 10 ng/ml of GDF5 variant B showed an increase in luciferase activity at 6 and 12 hours, but not at 24 or 48 hours after stimulation. The cells cultured with 30 ng/ml, 100 ng/ ml and 300 ng/ml of this variant showed significantly higher luciferase activity at all time points (Figure 2D).
At all four time points, stimulation with BMP2 and TGF-b1 resulted in a significant increase in luciferase activity. Further-more, BMP2 and TGF-b1 stimulations clearly elicited a greater response at all time points than any of the GDF5 proteins. Stimulation with 100 ng/ml of each of the four recombinant GDF5 proteins consistently and significantly increased luciferase activity at all time points. Furthermore, there was no significant difference between the luciferase readings generated in cells stimulated with 100 ng/ml and 300 ng/ml of GDF5 protein. As noted above, it has been shown that 100 ng/ml is the optimal concentration of recombinant GDF5 to be used in chondrocyte culture [27]. Based on our results and this previous data, we therefore chose to use 100 ng/ml GDF5 for the stimulation of OA chondrocytes in subsequent experiments.
All Four GDF5 Proteins Activate Smad Signalling in OA Chondrocytes
Protein was extracted from chondrocytes that had been grown in monolayer and stimulated with 100 ng/ml of each of the four GDF5 proteins for between 15 minutes and two hours. The protein was then subjected to western blot analysis using an antibody against phosphorylated Smad 1/5/8, with anti-b-actin antibody used as a loading control. The cells were also stimulated with TGF-b1 for 1 hour as a positive control. The Smad 1/5/8 signalling pathway was clearly activated in response to each GDF5 protein at all time points analysed (Figure 3).
None of the GDF5s Elicit a Consistent Target Gene Response by OA Chondrocytes in Monolayer
Chondrocytes harvested from 25 OA patients (Table S1) were cultured in monolayer with (treated) or without (untreated) 100 ng/ ml of the GDF5 proteins. Twleve of the 25 patients were cultured with wildtype mouse GDF5 (patients 1–9 and 21–23), three of whom were also separately cultured with human GDF5 and its two variants and with 5 ng/ml TGF-b1 (patients 21–23) and three
separately with TGF-b1 (patients 7–9). Twelve of the 25 were cultured with wildtype human GDF5 (patients 10, 11,14–18 and 21–25), five of whom were also separately cultured with variant A and separately with variant B (patients 14–18) and two with human GDF5 variants and TGF-b1 (patients 24–25). Two of the 25 were cultured with variant A and separately with variant B (patients 12 and 13). Finally, two of the 25 were cultured only with TGF-b1 (patients 19 and 20). None of the culturing was performed with two or more of the growth factor proteins in the same culture mix.
The cells were lysed at four time points after stimulation (6, 12, 24 and 48 hours). Changes in the expression of the six target genes
MMP13,MMP1,TIMP1,COL2A1,ACAN, andSOX9, which code for proteins that have key catabolic and anabolic roles in chondrocyte biology, were then measured by qPCR. The relative gene expression of the test genes was compared between the treated and the untreated cells using a student’s two-tailedt-test. The significant (P,0.05) up/down changes in gene expression in response to stimulation with GDF5 proteins and with TGF-b1 are plotted in Figure 4. The actual values of these gene expression changes are listed in Tables S4–S8. A Wilcoxon signed rank test was performed to assess whether the chondrocytes showed a significant trend in response to each GDF5 and to TGF-b1. P-values are listed in Table 2.
Our results show that OA chondrocytes can respond to exogenous GDF5, with P-values greater than 0.05 for each of the six target genes analysed (Tables S4–S7), but not in a consistent manner. Some patients did not show a significant response to GDF5 stimulation at all (for example, patient 2), and where a response was observed at one time point, this did not necessarily persist through to further time points. For example, patient 9 showed a 1.64 fold significant upregulation ofMMP13, 6 hours post stimulation with wildtype mouse GDF5, but with no change inMMP13expression at 12, 24 or 48 hours post stimulation (Table S4). Also, the changes in gene expression observed were not at all predictable, in that they were not always in the same direction. For example,MMP13was both up and down regulated in response to mouse, human and the variant A form of GDF5.
All ten patients cultured with TGF-b1 did however respond in a clearly consistent manner, showing an upregualtion of TIMP1
(P,0.0001) and COL2A1 (P,0.0001) and a down regulation of
MMP13(P = 0.0002),MMP1(P,0.0001),ACAN(P,0.0001) and
SOX9(P,0.0001; Figure 4E, Table 2 and Table S8).
We also harvested cells at 0 hours, prior to growth factor stimulation and were used for cDNA synthesis to measure the gene expression levels of the three GDF5 receptor genes (BMPR-II,
BMPR-IAandBMPR-IB) and of the two TGF-b1 receptor genes Table 2.P-values calculated using the Wilcoxon signed rank test for each target gene following growth factor stimulation in monolayer culture.
Target gene Growth factor
Wildtype mGDF5 Wildtype hGDF5 hGDF5 A hGDF5 B TGF-b1
MMP13 0.4849 0.0735 0.0598 0.1725 0.0002
MMP1 0.735 0.2884 0.6929 0.8697 ,0.0001
TIMP1 0.2535 0.0561 0.5393 0.2827 ,0.0001
COL2A1 0.4243 0.9755 0.2528 0.4823 ,0.0001
ACAN 0.1236 0.0663 0.3942 0.9632 ,0.0001
SOX9 0.7269 0.1961 0.2613 0.364 ,0.0001
(TGFBR-IIand TGFBR-I; Figure S3). All of the patients studied demonstrated expression of the receptors, whilst for each receptor tested the levels of expression were comparable between patients. The lack of a consistent response following exogenous GDF5 treatment cannot therefore be due to an absence of receptor or to a relatively low level of receptor gene expression.
None of the GDF5s Elicit a Consistent Target Gene Response by OA Chondrocytes in Micromass
Chondrocytes harvested from 19 OA patients (Table S2) were cultured with (treated) or without (untreated) 100 ng/ml of each of the GDF5 proteins. One of the 19 was cultured separately with wildtype human GDF5 and its variants (patient 21). Five of the 19 were cultured with wildtype mouse GDF5 and separately with 5 ng/ ml of TGF-b1 (patients 22, 28–31). Another four were cultured with wildtype human GDF5 (patients 32–35). Four more were cultured with variant A and separately with variant B (patients 36–39). The remaining seven were cultured separately with wildtype mouse GDF5, wildtype human GDF5, variant A, variant B and with TGF-b1 (patients 23–27). As for the monolayer analysis, none of the culturing was performed with two or more of the growth factor proteins in the same culture mix.
The cells were lysed 5 days after stimulation, which is a time period sufficient for the cells to produce an extracellular matrix in culture, as determined by Alcian blue staining (data not shown). qPCR was used to measure any changes in the expression of the panel of six target genes. The relative gene expression of the target genes was compared between the treated and the untreated cells by performing a student’s two-tailedt-test.
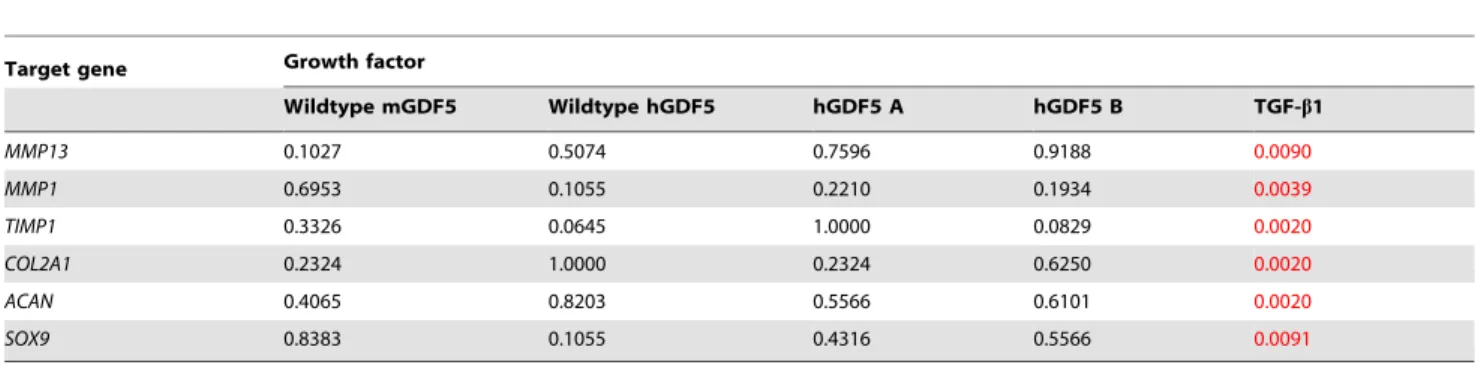
The significant (P,0.05) up/down changes in gene expression in response to stimulation with GDF5 proteins and with TGF-b1 are plotted in Figure 5. The actual values of these gene expression changes are listed in Tables S9–S13. A Wilcoxon signed rank test was performed to assess whether the chondrocytes showed a significant trend in response to each GDF5 and to TGF-b1. P-values are listed in Table 3.
As for the monolayer analysis, there was a limited and discordant response of the micromasses to GDF5, with any change in gene expression often not in the same direction. For
example, in response to human GDF5 variant B, patients 24 and 38 showed a 0.78 and 0.69 fold significant down regulation of
MMP13whereas patients 26 and 27 showed a 1.98 and 1.52 fold significant upregulation of this gene.
However, and was observed for monolayer analysis, the patients cultured with TGF-b1 did respond in a clearly consistent manner (Table S13 and Figure 5E). TGF-b1resulted in a down regulation ofMMP13(P = 0.0090) andMMP1(P = 0.0039) and an upregula-tion of TIMP1 (P = 0.0020) and COL2A1 (P = 0.0020), SOX9
(P = 0.0091) andACAN(P = 0.002). The direction of the responses forMMP13,MMP1,TIMP1andCOL2A1were the same as those seen for the monolayer chondrocytes. However, the upregulation observed forSOX9andACANin micromass culture was opposite to what was observed in monolayer. This probably reflects differences between the two culture conditions [28].
We measured the expression of GDF5 and TGF-b1 receptor genes in chondrocytes from patients 21–39 after 5 days of culture in micromass without growth factor stimulation (Figure S4). As in the monolayer analysis (Figure S3) all of the patients demonstrated expression of the receptors, whilst for each receptor tested the levels of expression were comparable between the patients. There was therefore no link between receptor gene expression and response to growth factor stimulation.
Discussion
We initially demonstrated the expression of all three GDF5 receptor genes in RNA extracted directly from cartilage chondro-cytes and in RNA derived from the chondrocyte monolayer and micromass cultures. In all three cases BMPR-IB, which encodes the type I receptor that GDF5 preferentially binds to, showed a lower level of expression relative to BMPR-II and BMPR-IA. Western blot analysis confirmed lower levels of the BMPR-IB protein. Others have also previously noted a difference in the expression of the proteins encoded by these genes in OA cartilage [29]. We therefore chose to study, in addition to wildtype mouse and human GDF5, a variant form of human GDF5 that was designed by Biopharm to preferentially bind to BMPR-IA. Also, we included in our study another variant form of GDF5 that was Figure 5. Gene expression changes in micromass chondrocytes treated with GDF5 or TGF-b1 compared to untreated cells. Chondrocytes were stimulated for 5 days with wildtype mouse GDF5 (A), wildtype human GDF5 (B), human GDF5 variant A (C), human GDF5 variant B (D) and TGF-b1 (E). Each cross represents a significant (P,0.05, two-tailed Student’s t-test) up/down regulation of gene expression relative to untreated cells in one patient. Ten patients were studied for each of the growth factor treatments.
doi:10.1371/journal.pone.0086590.g005
Table 3.P-values calculated using the Wilcoxon signed rank test for each target gene following growth factor stimulation in micromasss culture.
Target gene Growth factor
Wildtype mGDF5 Wildtype hGDF5 hGDF5 A hGDF5 B TGF-b1
MMP13 0.1027 0.5074 0.7596 0.9188 0.0090
MMP1 0.6953 0.1055 0.2210 0.1934 0.0039
TIMP1 0.3326 0.0645 1.0000 0.0829 0.0020
COL2A1 0.2324 1.0000 0.2324 0.6250 0.0020
ACAN 0.4065 0.8203 0.5566 0.6101 0.0020
SOX9 0.8383 0.1055 0.4316 0.5566 0.0091
designed by Biopharm to be insensitive to the GDF5 antagonist noggin.
Each of the four forms of GDF5 increased luciferase activity of a Smad responsive vector and they also phosphorylated Smad 1/5/ 8, confirming that they were able to bring about translocation of a growth factor signal. They were also able to stimulate a change in the expression of a panel of target genes in both monolayer and micromass chondrocytes. However, and unlike TGF-b1, the response of chondrocytes was not at all consistent for any of the four different forms of GDF5. The response to TGF-b1 demonstrates that chondrocytes from OA patients are clearly capable of responding to growth factors of the TGF-bsuperfamily in a predictable manner; the inconsistency with regards to GDF5 is not therefore a systemic characteristic of these cells. We also measured the gene expression levels of GDF5 and TGF-b1 receptor genes in chondrocytes from each patient and did not find any link between their response to exogenous growth factors and the their receptor gene expression levels. However, it is possible that the GDF5 receptor expression levels may change during the course of the experiment, which may account for some of the inconsistencies in response seen between time points and among patients. Also, the dose of exogenous GDF5 that we used may be suboptimal or inhibitory for some samples, and may generate inconsistent results between patients.
Guerne et al. [30] have shown a reduction in proliferative response with increasing age in chondrocytes in response to the growth factors PDGF-AA, FGF-2, IGF-1 and TGF-b1. Interest-ingly, the authors observed that TGF-b1 was the most potent stimulant analysed, and was the only factor that consistently and significantly increased the proliferation rate in chondrocytes from older donors. Loeseret al. [31] have also reported on a reduction in the chondrocyte response to IGF-1 with increasing age and histologic OA score in cynomolgus monkeys that have naturally occurring OA. However, our principal observation was that where there was a response to GDF5, this response was inconsistent between the chondrocytes of OA patients.
The association of theGDF5SNP rs143383 with OA is one of the most robust reported to-date, with replication observed in Asians and Europeans, despite the different polymorphic archi-tecture of the gene between these two ethnics groups, and with a variety of supporting functional data, much of which directly targets the SNP itself (reviewed in [32]). The prevailing data therefore strongly supports further investigation of this gene and its protein in the context of OA.
Whether the discordant response of chondrocytes to GDF5 that we have observed is a cause or a consequence of the OA disease process we cannot say. A loss of consistent response to growth factors during ageing may contribute to the development and progression of OA, resulting in an altered balance between anabolism and catabolism in some patients. Hence, it is important to develop a means to enhance the responsive capacity of chondrocytes if GDF5 can potentially be used as a therapeutic to overcome the genetic deficit mediated by the OA risk allele at rs143383.
Supporting Information
Figure S1 GDF5 receptor protein expression in cultured chondrocytes. The figure is representative of three separate experiments.
(DOCX)
Figure S2 GDF5 receptor gene expression in SW1353 chondrosarcoma cells.Gene expression was measured relative to the housekeepers, 18S, GAPDH and HPRT1. Five technical
replicates were performed for each gene. The error bars represent the standard error of the mean.
(DOCX)
Figure S3 GDF5 and TGF-b1 receptor gene expression.
Gene expression ofBMPR-II(A),BMPR-IA(B) andBMPR-IB(C) was measured in chondrocytes from 25 patients that were cultured in monolayer prior to stimulation with exogenous GDF5. Gene expression ofTGFBR-II (D) andTGFBR-I (E) was measured in chondrocytes from 10 patients that were cultured in monolayer prior to stimulation with exogenous TGF-b1. Gene expression was measured relative to the housekeepers,18S,GAPDHandHPRT1. The error bars represent the standard error of the mean of six biological replicates. Dotted lines represent the average gene expression across all patients studied.
(DOCX)
Figure S4 GDF5 and TGF-b1 receptor gene expression.
Gene expression of BMPR-II (A), BMPR-IA (B) and BMPR-IB (C) was measured in untreated chondrocytes from 19 patients that were cultured in micromass which were used to analyse the response to exogenous GDF5. Gene expression ofTGFBR-II(D) andTGFBR-I(E) was measured in chondrocytes from 10 patients that were cultured in micromass which were used to analyse the response to exogenous TGF-b1. Gene expression was measured relative to the housekeepers,18S,GAPDHandHPRT1. The error bars represent the standard error of the mean of four biological replicates. Dotted lines represent the average gene expression across all patients studied.
(DOCX)
Table S1 Details of the OA patients and of the growth factors used to stimulate their chondrocytes in the monolayer culture experiment.F, female; M, male; mGDF5, mouse GDF5; hGDF5, human GDF5.
(DOCX)
Table S2 Details of the OA patients and of the growth factors used to stimulate their chondrocytes in the micromass culture experiment. F, female; M, male; mGDF5, mouse GDF5; hGDF5, human.
(DOCX)
Table S3 Primer and probe sequences for the TaqMan assays used for quantitative real time PCR.
(DOCX)
Table S4 The changes in expression of the target genes following OA chondrocyte monolayer culturing and stimulation with wildtype mouse GDF5.The chondrocytes from twelve OA patients were cultured with or without wildtype mouse GDF5 and gene expression was measured at 6, 12, 24 and 48 hours post stimulation. The actual values of any significant (P#0.05, two-tailed Student’s t-test) fold changes in expression of the six target genes in response to the stimulation are shown in bold text. A value greater than 1 denotes an up regulation of gene expression and a value less than 1 denotes a down regulation of gene expression.
(DOCX)
bold text. A value greater than 1 denotes an up regulation of gene expression and a value less than 1 denotes a down regulation of gene expression.
(DOCX)
Table S6 The changes in expression of the target genes following OA chondrocyte monolayer culturing and stimulation with human GDF5 variant A.The chondrocytes from twelve OA patients were cultured with or without variant A and gene expression was measured at 6, 12, 24 and 48 hours post stimulation. The actual values of any significant (P#0.05, two-tailed Student’s t-test) fold changes in expression of the six target genes in response to the stimulation are shown in bold text. A value greater than 1 denotes an up regulation of gene expression and a value less than 1 denotes a down regulation of gene expression.
(DOCX)
Table S7 The changes in expression of the target genes following OA chondrocyte monolayer culturing and stimulation with human GDF5 variant B. The chondro-cytes from twelve OA patients were cultured with or without variant B and gene expression was measured at 6, 12, 24 and 48 hours post stimulation. The actual values of any significant (P#0.05, two-tailed Student’s t-test) fold changes in expression of the six target genes in response to the stimulation are shown in bold text. A value greater than 1 denotes an up regulation of gene expression and a value less than 1 denotes a down regulation of gene expression.
(DOCX)
Table S8 The changes in expression of the target genes following OA chondrocyte monolayer culturing and stimulation with TGF-b1. The chondrocytes from ten OA patients were cultured with or without TGF-b1 and gene expression was measured at 6, 12, 24 and 48 hours post stimulation. The actual values of any significant (P#0.05, two-tailed Student’s t-test) fold changes in expression of the six target genes in response to the stimulation are shown in bold text. A value greater than 1 denotes an up regulation of gene expression and a value less than 1 denotes a down regulation of gene expression.
(DOCX)
Table S9 The changes in expression of the target genes following OA chondrocyte micromass culturing and stimulation with wildtype mouse GDF5.The chondrocytes from ten OA patients were cultured with or without wildtype mouse GDF5 and gene expression was measured 5 days post stimulation. The actual values of any significant (P#0.05, two-tailed Student’s t-test) fold changes in expression of the six target genes in response to the stimulation are shown in bold text. A value greater than 1 denotes an up regulation of gene expression and a value less than 1 denotes a down regulation of gene expression.
(DOCX)
Table S10 The changes in expression of the target genes following OA chondrocyte micromass culturing and stim-ulation with wildtype human GDF5.The chondrocytes from ten OA patients were cultured with or without wildtype human
GDF5 and gene expression was measured 5 days post stimulation. The actual values of any significant (P#0.05, two-tailed Student’s t-test) fold changes in expression of the six target genes in response to the stimulation are shown in bold text. A value greater than 1 denotes an up regulation of gene expression and a value less than 1 denotes a down regulation of gene expression.
(DOCX)
Table S11 The changes in expression of the target genes following OA chondrocyte micromass culturing and stimulation with human GDF5 variant A.The chondrocytes from ten OA patients were cultured with or without variant A and gene expression was measured 5 days post stimulation. The actual values of any significant (P#0.05, two-tailed Student’s t-test) fold changes in expression of the six target genes in response to the stimulation are shown in bold text. A value greater than 1 denotes an up regulation of gene expression and a value less than 1 denotes a down regulation of gene expression.
(DOCX)
Table S12 The changes in expression of the target genes following OA chondrocyte micromass culturing and stimulation with human GDF5 variant B. The chondro-cytes from ten OA patients were cultured with or without variant B and gene expression was measured 5 days post stimulation. The actual values of any significant (P#0.05, two-tailed Student’s t-test) fold changes in expression of the six target genes in response to the stimulation are shown in bold text. A value greater than 1 denotes an up regulation of gene expression and a value less than 1 denotes a down regulation of gene expression.
(DOCX)
Table S13 The changes in expression of the target genes following OA chondrocyte micromass culturing and stimulation with TGF-b1. The chondrocytes from ten OA patients were cultured with or without TGF-b1 and gene expression was measured 5 days post stimulation. The actual values of any significant (P#0.05, two-tailed Student’s t-test) fold changes in expression of the six target genes in response to the stimulation are shown in bold text. A value greater than 1 denotes an up regulation of gene expression and a value less than 1 denotes a down regulation of gene expression.
(DOCX)
Acknowledgments
We thank Dr Mark Birch (Newcastle University, Institute of Cellular Medicine) for gifting us with the Smad responsive reporter construct and Dr Matt Barter (Newcastle University, Institute of Cellular Medicine) for providing us with recombinant TGF-b1. We also thank Lucy Gentles for her assistance with cartilage digestion and chondrocyte culture. We are grateful for the surgeons at the Newcastle upon Tyne Hospitals NHS Foundation Trust for providing us with access to patient tissue samples. We thank the patients for donating their tissue samples.
Author Contributions
Conceived and designed the experiments: MR MSK JL. Performed the experiments: MR. Analyzed the data: MR MSK JL. Contributed reagents/ materials/analysis tools: FP. Wrote the paper: MR JL. Participated in the design of the wildtype human GDF5 and the two variant forms of GDF5 proteins used in this study: FP.
References
1. Luyten FP. (1997) Cartilage-derived morphogenetic protein-1. Int J Biochem Cell Biol 11: 1241–4.
3. Massague J. (1998) TGF-bsignal transduction. Annu.Rev.Biochem. 67: 753– 791.
4. Mikic B. (2004) Multiple effects of GDF-5 deficiency on skeletal tissues: implications for therapeutic bioengineering. Ann Biomed Eng 32: 466–476. 5. Smith WC, Harland RM. (1992) Expression cloning of noggin, a new dorsalizing
factor localized to the Spemann organizer in Xenopus embryos. Cell 70(5): 829– 40.
6. Zimmerman LB, De Jesu´s-Escobar JM, Harland RM. (1996) The Spemann organizer signal noggin binds and inactivates bone morphogenetic protein 4. Cell 86(4): 599–606.
7. Daans M, Luyten FP, Lories RJ. (2011) GDF5 deficiency in mice is associated with instability-driven joint damage, gait and subchondral bone changes. Ann Rheum Dis 70: 208–213.
8. Polinkovsky A, Robin NH, Thomas JT, Irons M, Lynn A, et al. (1997) Mutations in CDMP1 cause autosomal dominant brachydactyly type C. Nat Genet 17: 18– 19.
9. Miyamoto Y, Mabuchi A, Shi D, Kubo T, Takatori Y, et al. (2007) A functional polymorphism in the 59 UTR of GDF5 is associated with susceptibility to osteoarthritis. Nat Genet 39: 529–533.
10. Chapman K, Takahashi A, Meulenbelt I, Watson C, Rodriguez-Lopez J, et al. (2008) A meta-analysis of European and Asian cohorts reveals a global role of a functional SNP in the 59UTR of GDF5 with osteoarthritis susceptibility. Hum Mol Genet 17: 1497–1504.
11. Southam L, Rodriguez-Lopez J, Wilkins JM, Pombo-Suarez M, Snelling S, et al. (2007) An SNP in the 59-UTR of GDF5 is associated with osteoarthritis susceptibility in Europeans and with in vivo differences in allelic expression in articular cartilage. Hum Mol Genet 16: 2226–2232.
12. Forslund C, Rueger D, Aspenberg P. (2003) A comparative dose-response study of cartilage-derived morphogenetic protein (CDMP)-1, -2 and -3 for tendon healing in rats. J Orthop Res 21(4): 617–21.
13. Rickert M, Wang H, Wieloch P, Lorenz H, Steck E, et al. (2005) Adenovirus-mediated gene transfer of growth and differentiation factor-5 into tenocytes and the healing rat Achilles tendon. Connect Tissue Res 46(4–5): 175–83. 14. Walsh AJ, Bradford DS, Lotz JC. (2004) In vivo growth factor treatment of
degenerated intervertebral discs. Spine (Phila Pa 1976) 29(2): 156–63. 15. Liang H, Ma SY, Feng G, Shen FH, Joshua LX. (2010) Therapeutic effects of
adenovirus-mediated growth and differentiation factor-5 in a mice disc degeneration model induced by annulus needle puncture. Spine J. 10(1): 32–41. 16. Zhang Y, Chee A, Thonar EJ, An HS. (2011) Intervertebral disk repair by protein, gene, or cell injection: a framework for rehabilitation-focused biologics in the spine. PM R. 3(6 Suppl 1): S88–94.
17. Chujo T, An HS, Akeda K, Miyamoto K, Muehleman C, et al. (2006) Effects of growth differentiation factor-5 on the intervertebral disc–in vitro bovine study and in vivo rabbit disc degeneration model study. Spine (Phila Pa 1976) 31(25): 2909–17.
18. Coleman CM, Vaughan EE, Browe DC, Mooney E, Howard L, et al. (2013) Growth differentiation factor-5 enhances in vitro mesenchymal stromal cell chondrogenesis and hypertrophy. Stem Cells Dev 22(13): 1968–76.
19. Bobacz K, Gruber R, Soleiman A, Graninger WB, Luyten FP, et al. (2002) Cartilage-derived morphogenetic protein-1 and -2 are endogenously expressed in healthy and osteoarthritic human articular chondrocytes and stimulate matrix synthesis. Osteoarthritis Cartilage 10 (5): 394–401.
20. Chubinskaya S, Segalite D, Pikovsky D, Hakimiyan AA, Rueger DC. (2008) Effects induced by BMPs in cultures of human articular chondrocytes: comparative studies. Growth Factors 26 (5): 275–283.
21. Cawston TE, Curry VA, Summers CA, Clark IM, Riley GP, et al. (1998) The role of oncostatin M in animal and human connective tissue collagen turnover and its localization within the rheumatoid joint. Arthritis Rheum 41: 1760–71. 22. Vincenti MP, Brinckerhoff CE. (2001) Early response genes induced in chondrocytes stimulated with the inflammatory cytokine interleukin-1b. Arthritis Res 3: 381–388.
23. Mitchell EA, Chaffey BT, McCaskie AW, Lakey JH, Birch MA. (2010) Controlled spatial and conformational display of immobilised bone morphoge-netic protein-2 and osteopontin signalling motifs regulates osteoblast adhesion and differentiation in vitro. BMC Biol 10; 8: 57.
24. Kasten P, Beyen I, Bormann D, Luginbu¨hl R, Plo¨ger F, et al. (2010) The effect of two point mutations in GDF-5 on ectopic bone formation in a beta-tricalciumphosphate scaffold. Biomaterials 31(14): 3878–84.
25. Kleinschmidt K, Plo¨ger F, Nickel J, Glockenmeier J, Kunz P, et al. (2013) Enhanced reconstruction of long bone architecture by a growth factor mutant combining positive features of GDF-5 and BMP-2. Biomaterials 34(24): 5926– 36.
26. Seemann P, Brehm A, Ko¨nig J, Reissner C, Stricker S, et al. (2009) Mutations in GDF5 reveal a key residue mediating BMP inhibition by NOGGIN. PLoS Genet 5(11): e1000747.
27. Erlacher L, McCartney J, Piek E, ten Dijke P, Yanagishita M, et al. (1998) Cartilage-derived morphogenetic proteins and osteogenic protein-1 differentially regulate osteogenesis. J Bone Miner Res 13(3): 383–92.
28. Bauge´ C, Cauvard O, Leclercq S, Gale´ra P, Boume´diene K. (2011) Modulation of transforming growth factor beta signalling pathway genes by transforming growth factor beta in human osteoarthritic chondrocytes: involvement of Sp1 in both early and late response cells to transforming growth factor beta. Arthritis Res Ther. 13(1): R23.
29. Bobinac D, Spanjol J, Marinovic´ M, Cvek SZ, Maric´ I, et al. (2008) Expression of bone morphogenetic proteins, cartilage-derived morphogenetic proteins and related receptors in normal and osteoarthritic human articular cartilage. Coll Antropol 32 Suppl 2: 83–7.
30. Guerne PA, Blanco F, Kaelin A, Desgeorges A, Lotz M. (1995) Growth factor responsiveness of human articular chondrocytes in aging and development. Arthritis Rheum. 38(7): 960–8.
31. Loeser RF, Shanker G, Carlson CS, Gardin JF, Shelton BJ, et al. (2000) Reduction in the chondrocyte response to insulin-like growth factor 1 in aging and osteoarthritis: studies in a non-human primate model of naturally occurring disease. Arthritis Rheum 43(9): 2110–20.
32. Reynard LN, Loughlin J. (2013) The genetics and functional analysis of primary osteoarthritis susceptibility. Expert Rev Mol Med 15: e2.