ACPD
15, 6277–6335, 2015Evaluation of the MACC operational
forecast system
A. Wagner et al.
Title Page
Abstract Introduction
Conclusions References
Tables Figures
◭ ◮
◭ ◮
Back Close
Full Screen / Esc
Printer-friendly Version
Interactive Discussion
Discussion
P
a
per
|
Discussion
P
a
per
|
Discussion
P
a
per
|
Discussion
P
a
per
|
Atmos. Chem. Phys. Discuss., 15, 6277–6335, 2015 www.atmos-chem-phys-discuss.net/15/6277/2015/ doi:10.5194/acpd-15-6277-2015
© Author(s) 2015. CC Attribution 3.0 License.
This discussion paper is/has been under review for the journal Atmospheric Chemistry and Physics (ACP). Please refer to the corresponding final paper in ACP if available.
Evaluation of the MACC operational
forecast system – potential and
challenges of global near-real-time
modelling with respect to reactive gases
in the troposphere
A. Wagner1, A.-M. Blechschmidt2, I. Bouarar3,*, E.-G. Brunke4, C. Clerbaux3, M. Cupeiro5, P. Cristofanelli6, H. Eskes7, J. Flemming8, H. Flentje1, M. George3, S. Gilge1, A. Hilboll2, A. Inness8, J. Kapsomenakis9, A. Richter2, L. Ries10, W. Spangl11, O. Stein12, R. Weller13, and C. Zerefos9
1
Deutscher Wetterdienst, Meteorologisches Observatorium Hohenpeissenberg, Hohenpeissenberg, Germany
2
Institute of Environmental Physics, University of Bremen, Bremen, Germany
3
Sorbonne Universités, UPMC Univ. Paris 06; Université Versailles St-Quentin; CNRS/INSU, LATMOS-IPSL, Paris, France
4
South African Weather Service, Stellenbosch, South Africa
5
ACPD
15, 6277–6335, 2015Evaluation of the MACC operational
forecast system
A. Wagner et al.
Title Page
Abstract Introduction
Conclusions References
Tables Figures
◭ ◮
◭ ◮
Back Close
Full Screen / Esc
Printer-friendly Version
Interactive Discussion
Discussion
P
a
per
|
Discussion
P
a
per
|
Discussion
P
a
per
|
Discussion
P
a
per
6
National Research Council of Italy, ISAC, Bologna, Italy
7
Royal Netherlands Meteorological Institute, De Bilt, the Netherlands
8
European Centre for Medium-range Weather Forecasts, Reading, UK
9
Academy of Athens, Research Centre for Atmospheric Physics and Climatology, Athens, Greece
10
Federal Environment Agency, GAW Global Station Zugspitze/Hohenpeissenberg, Zugspitze 5, 82475 Zugspitze, Germany
11
Umweltbundesamt GmbH, Air Pollution Control and Climate Change Mitigation, Vienna, Austria
12
Forschungszentrum Jülich, IEK-8 (Troposphere), Jülich, Germany
13
Alfred Wegener Institute, Bremerhaven, Germany
*
now at: Max-Planck-Institut for Meteorology, Hamburg, Germany
Received: 7 October 2014 – Accepted: 25 January 2015 – Published: 4 March 2015 Correspondence to: A. Wagner ([email protected])
ACPD
15, 6277–6335, 2015Evaluation of the MACC operational
forecast system
A. Wagner et al.
Title Page
Abstract Introduction
Conclusions References
Tables Figures
◭ ◮
◭ ◮
Back Close
Full Screen / Esc
Printer-friendly Version
Interactive Discussion
Discussion
P
a
per
|
Discussion
P
a
per
|
Discussion
P
a
per
|
Discussion
P
a
per
|
Abstract
Monitoring Atmospheric Composition and Climate (MACC/MACCII) currently repre-sents the European Union’s Copernicus Atmosphere Monitoring Service (CAMS) (http://www.copernicus.eu/), which will become fully operational in the course of 2015. The global near-real-time MACC model production run for aerosol and reactive gases 5
provides daily analyses and 5 day forecasts of atmospheric composition fields. It is the only assimilation system world-wide that is operational to produce global analyses and forecasts of reactive gases and aerosol fields. We have investigated the ability of the MACC analysis system to simulate tropospheric concentrations of reactive gases (CO, O3, and NO2) covering the period between 2009 and 2012. A validation was performed 10
based on CO and O3surface observations from the Global Atmosphere Watch (GAW)
network, O3 surface observations from the European Monitoring and Evaluation
Pro-gramme (EMEP) and furthermore, NO2tropospheric columns derived from the satellite sensors SCIAMACHY and GOME-2, and CO total columns derived from the satellite sensor MOPITT. The MACC system proved capable of reproducing reactive gas con-15
centrations in consistent quality, however, with a seasonally dependent bias compared to surface and satellite observations: for northern hemispheric surface O3mixing ratios,
positive biases appear during the warm seasons and negative biases during the cold parts of the years, with monthly Modified Normalised Mean Biases (MNMBs) ranging between−30 and 30 % at the surface. Model biases are likely to result from diffi
cul-20
ties in the simulation of vertical mixing at night and deficiencies in the model’s dry deposition parameterization. Observed tropospheric columns of NO2and CO could be reproduced correctly during the warm seasons, but are mostly underestimated by the model during the cold seasons, when anthropogenic emissions are at a highest, espe-cially over the US, Europe and Asia. Monthly MNMBs of the satellite data evaluation 25
range between−110 and 40 % for NO2and at most−20 % for CO, over the investigated
concern-ACPD
15, 6277–6335, 2015Evaluation of the MACC operational
forecast system
A. Wagner et al.
Title Page
Abstract Introduction
Conclusions References
Tables Figures
◭ ◮
◭ ◮
Back Close
Full Screen / Esc
Printer-friendly Version
Interactive Discussion
Discussion
P
a
per
|
Discussion
P
a
per
|
Discussion
P
a
per
|
Discussion
P
a
per
ing the dry deposition parameterization and certain limitations in the current emission inventories, together with an insufficiently established seasonality in the emissions.
1 Introduction
Reactive gases play an important role in tropospheric chemistry.
Carbon monoxide (CO) is part of a photo-chemically driven reaction sequence that 5
links methane (CH4), formaldehyde (HCHO), ozone (O3), and the hydroxyl radical
(OH). It also is a precursor of tropospheric ozone. Carbon monoxide has natural and anthropogenic sources (Seinfeld and Pandis, 2006). Its main sources are incomplete fossil fuel and biomass burning, but also the oxidation of anthropogenic and biogenic volatile organic compounds (VOCs).
10
High CO concentrations in the troposphere are found especially over the industrial regions of Europe, Asia and North America as well as over biomass burning regions in Africa. In the Northern Hemisphere the surface CO concentration peak appears around March with typical mixing ratios of around 150 parts per billion (ppb) measured at back-ground stations (e.g., Stein et al., 2014). The Northern Hemisphere winter CO maxi-15
mum results largely from a build-up of anthropogenic emissions, while in the Southern Hemisphere, biomass burning is the dominant contributor of CO in the boreal summer (July–October). In both hemispheres, reaction with OH leads to a minimum of CO in the summer months. In areas with large biogenic emissions (e.g., tropical rain forests), the oxidation of biogenic VOCs contributes strongly to the production of CO (Griffin 20
et al., 2007).
Ozone in the troposphere is highly relevant for the Earth’s climate, ecosystems, and human health (e.g., Cape, 2008; Mohnen et al., 2013; Selin et al., 2009). Due to its rela-tively short lifetime in the atmosphere when compared to carbon dioxide, ozone is often referred to as “short-lived climate forcer”. It is the third largest contributor of anthro-25
precur-ACPD
15, 6277–6335, 2015Evaluation of the MACC operational
forecast system
A. Wagner et al.
Title Page
Abstract Introduction
Conclusions References
Tables Figures
◭ ◮
◭ ◮
Back Close
Full Screen / Esc
Printer-friendly Version
Interactive Discussion
Discussion
P
a
per
|
Discussion
P
a
per
|
Discussion
P
a
per
|
Discussion
P
a
per
|
sor of the OH radical which determines the oxidation capacity of the troposphere (e.g., Seinfeld and Pandis, 2006; Cooper et al., 2014). As a toxic air pollutant, higher con-centrations of O3can also affect human health (Bell et al., 2006). O3formation occurs
in the troposphere mainly when nitric oxide (NO) and nitrogen dioxide (NO2) (the sum of which is referred to as NOx), CO, and VOCs react in the presence of sunlight. Thus,
5
during spring and summer, high O3 concentrations usually occur downwind of urban
areas or over regions with intense biomass burning activity.
Nitric oxide (NO) and nitrogen dioxide (NO2), exert a major influence on oxidation
processes in the troposphere. NO rapidly reacts with O3to form NO2. Nitrogen oxides
have their sources in both anthropogenic processes (e.g., fossil fuel combustion) and 10
natural processes (e.g., soil emissions and lightning). The lifetime of NOx comprises a few days in the free troposphere and less in the boundary layer. Concentrations are typically larger over land than over the oceans. The largest concentrations are found over industrial and urban regions of the Eastern US, California, Europe, China and Japan (e.g., Leue et al., 2001; Velders et al., 2001; Richter et al., 2005). Major sinks of 15
NOxare reactions of NO2with OH to HNO3, with O3to NO3at night and the formation
of peroxyacyl nitrates as well as dry deposition (Inness et al., 2013; Penkett et al., 2011).
The EU-funded research project MACC/MACC-II – Monitoring Atmospheric Compo-sition and Climate – is the basis of the Copernicus Atmosphere Monitoring Service. 20
This service has been established by the EU to provide a range of products of so-cietal and environmental value with the aim to help European governments respond to climate change and air quality problems. For the generation of atmospheric prod-ucts, state-of-the-art atmospheric modelling is combined with assimilated satellite data (Hollingsworth et al., 2008, more general information about data assimilation can be 25
found in e.g. Ballabrera-Poy et al., 2009 or Kalnay, 2003).
ACPD
15, 6277–6335, 2015Evaluation of the MACC operational
forecast system
A. Wagner et al.
Title Page
Abstract Introduction
Conclusions References
Tables Figures
◭ ◮
◭ ◮
Back Close
Full Screen / Esc
Printer-friendly Version
Interactive Discussion
Discussion
P
a
per
|
Discussion
P
a
per
|
Discussion
P
a
per
|
Discussion
P
a
per
a global and on European-scale level, and derived products such as solar radia-tion. An important aim of the MACC system is to describe the occurrence, magni-tude and transport pathways of disruptive events, e.g., volcanoes (Flemming and In-ness, 2013), major fires (Huijnen et al., 2012; Kaiser et al., 2012) and dust storms (Cuevas et al., 2014). The product catalogue can be found on the MACC website, 5
http://copernicus-atmosphere.eu. Within the MACC project there is a dedicated vali-dation activity to provide up-to-date information on the quality of the reanalysis, daily analyses and forecasts. Validation reports are updated regularly and are available on the MACC websites.
The MACC global near-real-time (NRT) production model for reactive gases and 10
aerosol has operated with data assimilation from September 2009 onwards, providing boundary conditions for the MACC regional air quality products (RAQ), and other down-stream users. The model simulations also provide input for the stratospheric ozone analyses delivered in near-real-time by the MACC stratospheric ozone system (Lefever et al., 2014).
15
This paper investigates the potential and challenges of near-real-time modelling with the MACC analysis system between 2009 and 2012. We concentrate on this period because of the availability of validated independent observations (namely surface ob-servations from the Global Atmosphere Watch Programme GAW, the European Moni-toring and Evaluation Programme EMEP, as well as total column satellite data from the 20
MOPITT, SCIAMACHY and GOME-2 sensors) that are used for comparison. In partic-ular, we study the model’s ability to reproduce the seasonality and absolute values of tropospheric CO and NO2 as well as surface O3 and CO. The impact of changes in
model version, data assimilation and emission inventories on the model performance are examined and discussed.
25
The paper is structured in the following way: Sect. 2 contains a description of the model and the validation data sets as well as the applied validation metrics. Section 3 presents the validation results for CO, NO2and O3. Section 4 encloses the discussion
ACPD
15, 6277–6335, 2015Evaluation of the MACC operational
forecast system
A. Wagner et al.
Title Page
Abstract Introduction
Conclusions References
Tables Figures
◭ ◮
◭ ◮
Back Close
Full Screen / Esc
Printer-friendly Version
Interactive Discussion
Discussion
P
a
per
|
Discussion
P
a
per
|
Discussion
P
a
per
|
Discussion
P
a
per
|
2 Data and methods
2.1 The MACC model system in the 2009–2012 period
The MACC global products for reactive gases consist of a reanalysis performed for the years 2003–2012 (Inness et al., 2013) and the near-real-time analysis and forecast, largely based on the same assimilation and forecasting system, but targeting different 5
user groups. The MOZART chemical transport model (CTM) is coupled to the Inte-grated Forecast System (IFS) of the European Centre for Medium–Range Weather forecast (ECMWF), which together represent the MOZART-IFS model system (Flem-ming et al., 2009 and Stein et al., 2012). An alternative analysis system has been set up based on the global CTM TM5 (Huijnen et al., 2010). Details of the MOZART ver-10
sion used in the MACC global products can be found in Kinnison et al., 2007 and Stein et al. (2011, 2012). In the simulation, the IFS and the MOZART model run in paral-lel and exchange several two- and three-dimensional fields every model hour using the OASIS4 coupling software (Valcke and Redler, 2006), thereby producing three-dimensional IFS fields for O3, CO, SO2, NOx, HCHO, sea salt aerosol, desert dust, 15
black carbon, organic matter, and total aerosol. The IFS provides meteorological data to MOZART. Data assimilation and transport of the MACC species takes place in IFS, while the whole chemical reaction system is calculated in MOZART.
The MACC_osuite is the global near-real-time MACC model production run for aerosol and reactive gases. Here, we have investigated only the MACC analysis. In 20
contrast to the reanalysis, the MACC_osuite is a near-real-time run, which implies that it is only run once in near-real-time and may thus contain inconsistencies in e.g. the assimilated data. The MACC_osuite was based on the IFS cycle CY36R1 with IFS model resolution of approximately 100 km at 60 levels (T159L60) from Septem-ber 2009 until July 2012. The gas-phase chemistry module in this cycle is based on 25
on-ACPD
15, 6277–6335, 2015Evaluation of the MACC operational
forecast system
A. Wagner et al.
Title Page
Abstract Introduction
Conclusions References
Tables Figures
◭ ◮
◭ ◮
Back Close
Full Screen / Esc
Printer-friendly Version
Interactive Discussion
Discussion
P
a
per
|
Discussion
P
a
per
|
Discussion
P
a
per
|
Discussion
P
a
per
wards, the MACC_osuite has run with a change of the meteorological model to a new IFS cycle (version CY37R3), with an IFS model resolution of approximately 80 km at 60 levels (T255L60) and an upgrade of the MOZART version 3.5 (Kinnison et al., 2007; Emmons et al., 2011; Stein et al., 2013). This includes, amongst others, updated ve-locity fields for the dry deposition of O3over ice, as described in Stein et al. (2013).
5
A detailed documentation of system changes can be found at: http://www. copernicus-atmosphere.eu/oper_info/nrt_info_for_users/.
2.1.1 Emission inventories and assimilated data sets
In the MACC_osuite, anthropogenic emissions go back to a merged RETRO-REAS inventory; biogenic emissions are taken from GEIA, both available in monthly resolution 10
(Schultz et al., 2007). Fire emissions are based on a climatology derived from GFEDv2 (van der Werf et al., 2006) until April 2010, when fire emissions change to GFAS fire emissions (Kaiser et al., 2012). Between January 2011 and October 2011 there has been a fire emission reading error in the model, where, instead of adjusting emissions to the appropriate month, the same set of emissions have been read throughout this 15
period.
After the model upgrade to the new cycle version CY37R3, in July 2012, the emission inventories changed from the merged RETRO-REAS and GEIA inventories, used in the previous cycle, to the MACCity anthropogenic and biogenic emissions (Granier et al., 2011) and (climatological) MEGAN-v2 (Guenther et al., 2006) emission inventories. 20
Wintertime anthropogenic CO emissions are scaled up over Europe and North America (see Stein et al., 2014). Near-real-time fire emissions are taken from GFASv1.0 (Kaiser et al., 2012), for both gas-phase and aerosol.
In the MACC_osuite, the initial conditions for some of the chemical species are pro-vided by data assimilation of atmospheric composition observations from satellites (see 25
ACPD
15, 6277–6335, 2015Evaluation of the MACC operational
forecast system
A. Wagner et al.
Title Page
Abstract Introduction
Conclusions References
Tables Figures
◭ ◮
◭ ◮
Back Close
Full Screen / Esc
Printer-friendly Version
Interactive Discussion
Discussion
P
a
per
|
Discussion
P
a
per
|
Discussion
P
a
per
|
Discussion
P
a
per
|
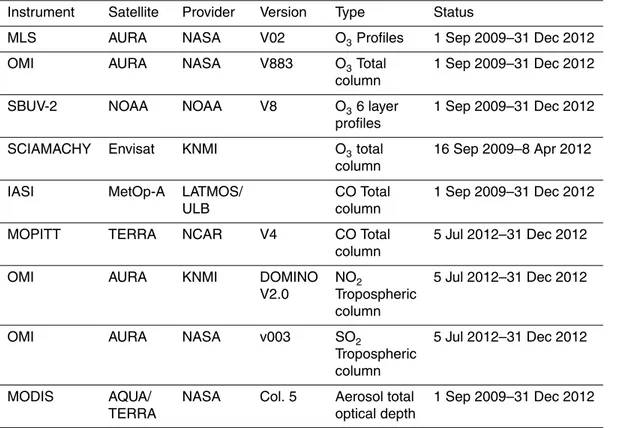
total columns (the latter only until March 2012, when the European Space Agency lost contact with the ENVIronmental SATellite ENVISAT). CO total columns are assimilated from the IASI sensor and aerosol total optical depth is assimilated from the MODIS instrument. After the model cycle update in July 2012, data assimilation also contains OMI tropospheric columns of NO2and SO2, as well as CO MOPITT total columns. The
5
CO total columns retrieved by MOPITT and IASI instruments have a relatively similar seasonality, but there is a systematic difference with MOPITT CO being higher over most regions in the Northern Hemisphere, especially during winter and spring. George et al. (2015) investigated the differences between MOPITT and IASI, and showed the impact of a priori information on the retrieved measurements.
10
Tables 1 and 2 summarize the setup and data assimilation of the MACC_osuite.
2.2 Validation data and methodology
In this study, mainly the same evaluation data sets have been used as during the MACC near-real-time validation exercise. This implies some discontinuities in the evaluations, e.g. the substitution of SCIAMACHY data with GOME-2 data after the loss of the EN-15
VISAT sensor or an exclusion of MOPITT satellite data after the start of its assimilation into the model. The continuous process of updating and complementation of data sets in databases requires the selection and definition of an evaluation data set at some point. The comparatively small inconsistencies between our data sets are considered to have a negligible impact on the overall evaluation results.
20
2.2.1 GAW surface O3and CO observations
The Global Atmosphere Watch (GAW) programme of the World Meteorological Orga-nization (WMO) has been established to provide reliable long-term observations of the chemical composition and physical properties of the atmosphere, which are relevant for understanding atmospheric chemistry and climate change (WMO, 2013). GAW tro-25
ACPD
15, 6277–6335, 2015Evaluation of the MACC operational
forecast system
A. Wagner et al.
Title Page
Abstract Introduction
Conclusions References
Tables Figures
◭ ◮
◭ ◮
Back Close
Full Screen / Esc
Printer-friendly Version
Interactive Discussion
Discussion
P
a
per
|
Discussion
P
a
per
|
Discussion
P
a
per
|
Discussion
P
a
per
of long-term regional and global changes. Furthermore, the GAW measurement pro-gramme focuses on observations, which are regionally representative and should be free from influence of significant local pollution sources and suited for the validation of global chemistry climate models (WMO 2007a). Detailed information on GAW and GAW related O3and CO measurements can be found in WMO (2007b, 2010, 2013).
5
Tropospheric hourly O3 and CO data have been downloaded from the WMO/GAW
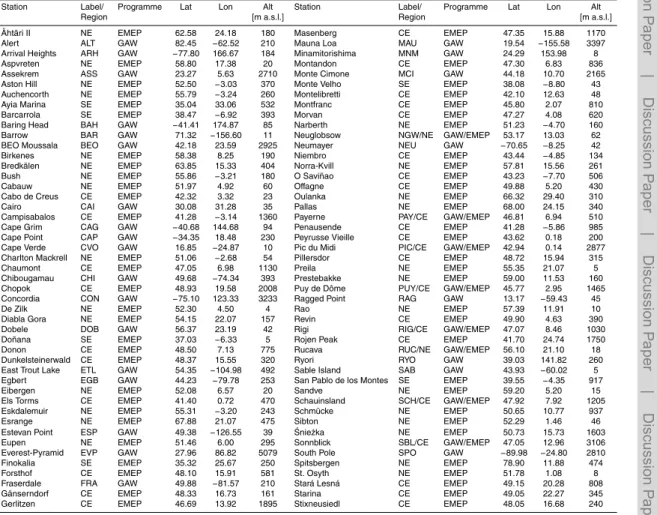
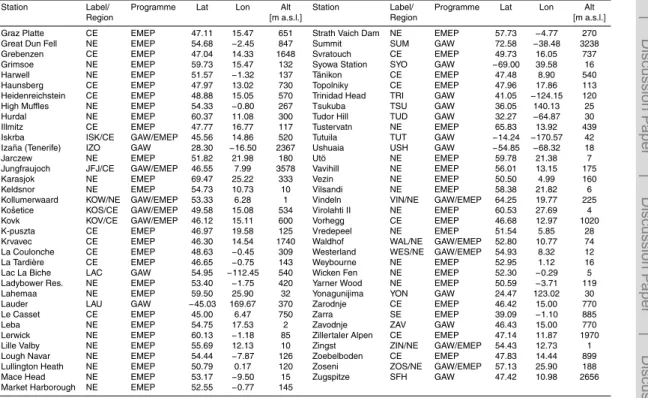
World Data Centre for Greenhouse Gases (WDCGG) for the period between Septem-ber 2009 and DecemSeptem-ber 2012 (status of download: July 2013). Our evaluation includes 29 stations with surface observations for CO and 50 stations with surface observations for O3.Table 3 lists the geographic coordinates and altitudes of the individual stations. 10
Being a long-term data network, the data in the database is provided with a temporal delay of approximately 2 years. As the data in the database becomes sparse towards the end of the validation period, near-real-time observations, as used in the MACC-project for near-real-time validation, presented on the MACC website, have been in-cluded to complement the validation data sets. For the detection of long-term trends 15
and year-to-year variability, the data quality objectives (DQOs) for CO in GAW mea-surements are set to a maximum uncertainty of ±2 ppb and to ±5 ppb for marine
boundary layer sites and continental sites that are influenced by regional pollution and to±1 ppb for ozone (WMO, 2012, 2013).
For the evaluation with GAW station data, 6 hourly values (00:00, 06:00, 12:00, 20
18:00 UTC) of the analysis mode have been extracted from the model and are matched with hourly observational GAW station data. Model mixing ratios at the stations’ location have been linearly interpolated from the model data in the horizontal. In the vertical, modelled gas mixing ratios have been extracted at the model level, which is closest to the GAW stations’ altitude. Validation scores (see Sect. 2.3) have been calculated for 25
ACPD
15, 6277–6335, 2015Evaluation of the MACC operational
forecast system
A. Wagner et al.
Title Page
Abstract Introduction
Conclusions References
Tables Figures
◭ ◮
◭ ◮
Back Close
Full Screen / Esc
Printer-friendly Version
Interactive Discussion
Discussion
P
a
per
|
Discussion
P
a
per
|
Discussion
P
a
per
|
Discussion
P
a
per
|
2.2.2 EMEP surface O3observations
The European Monitoring and Evaluation Programme (EMEP) is a scientifically based and policy driven programme under the Convention on Long-Range Transboundary Air Pollution (CLRTAP) for international co-operation to solve transboundary air pollu-tion problems. Measurements of air quality in Europe have been carried out under the 5
EMEP since 1977.
A detailed description of the EMEP measurement programme can be found in Tørseth et al. (2012). The surface hourly ozone data between September 2009 and December 2012 have been downloaded from the EMEP data web-page (http://www. nilu.no/projects/ccc/emepdata.html). For the validation, only stations meeting the 75 % 10
availability threshold per day and per month are taken into account. The precision is close to 1.5 ppb for a 10 s measurement. More information about the ozone data quality, calibration and maintenance procedures can be found in Aas et al. (2000).
For comparison with EMEP data, 3 hourly model values (00:00, 03:00, 06:00, 12:00, 15:00, 18:00, 21:00 UTC) of the analysis mode have been chosen, in order to be able 15
to evaluate day and night time performance of the model separately. Gas mixing ra-tios have been extracted from the model and are matched with hourly observational surface ozone data at 124 EMEP stations in the same way as for the GAW station data. The EMEP surface ozone values and the interpolated surface modeled values are compared on a monthly basis for the latitude bands of 30–40◦N (Southern Eu-20
rope), 40–50◦N (Central Europe) and 50–70◦N (Northern Europe). For the identifica-tion of differences in the MACC_osuite performance between day and night time, the MACC_osuite simulations and the EMEP observations for the three latitude bands have been additionally separated into day-time (12:00–15:00 Local Time LT) and night-time (00:00–03:00 LT) intervals.
ACPD
15, 6277–6335, 2015Evaluation of the MACC operational
forecast system
A. Wagner et al.
Title Page
Abstract Introduction
Conclusions References
Tables Figures
◭ ◮
◭ ◮
Back Close
Full Screen / Esc
Printer-friendly Version
Interactive Discussion
Discussion
P
a
per
|
Discussion
P
a
per
|
Discussion
P
a
per
|
Discussion
P
a
per
2.2.3 MOPITT CO total column retrievals
The MOPITT (Measurement Of Pollution In The Troposphere) instrument is mounted on board the NASA EOS Terra satellite and provides CO distributions at the global scale (Deeter et al., 2004). MOPITT has a horizontal resolution of 22 km×22 km and
allows global coverage within 3 days. The data used in this study corresponds to CO 5
total columns from version 5 (V5) of the MOPITT thermal infrared (TIR) product level 3. This product is available via the following web server: http://www2.acd.ucar.edu/ mopitt/products. Validation of the MOPITT V5 product against in-situ CO observations showed a mean bias of 0.06×10¹⁸molecules cm−2 (Deeter et al., 2013). Following
the recommendation in the users’ guide, (www.acd.ucar.edu/mopitt/v5_users_guide_ 10
beta.pdf), the MOPITT data were averaged by taking into account their relative errors provided by the Observation Quality Index (OQI).
Also, in order for better data quality we used only daytime CO data since retrieval sensitivity is greater for daytime rather than nighttime overpasses. A further description of the V5 data is presented in Deeter et al. (2013) and Worden et al. (2014).
15
For the validation, the model CO profiles (X) were transformed by applying the MO-PITT averaging kernels (A) and the a priori CO profile (Xa) according to the following equation (Rodgers, 2000) to derive the smoothed profilesX∗ appropriate for compari-son with MOPITT data:
X∗=Xa+A(X−Xa) 20
Details on the method of calculation are referred to in Deeter et al. (2004) and Rodgers (2000). The averaging kernels indicate the sensitivity of the MOPITT measurement and retrieval system to the true CO profile, with the remainder of the information set by the a priori profile and retrieval constraints (Emmons, 2009; Deeter et al., 2010). The model CO total columns used in the comparison with MOPITT observations, have been 25
ACPD
15, 6277–6335, 2015Evaluation of the MACC operational
forecast system
A. Wagner et al.
Title Page
Abstract Introduction
Conclusions References
Tables Figures
◭ ◮
◭ ◮
Back Close
Full Screen / Esc
Printer-friendly Version
Interactive Discussion
Discussion
P
a
per
|
Discussion
P
a
per
|
Discussion
P
a
per
|
Discussion
P
a
per
|
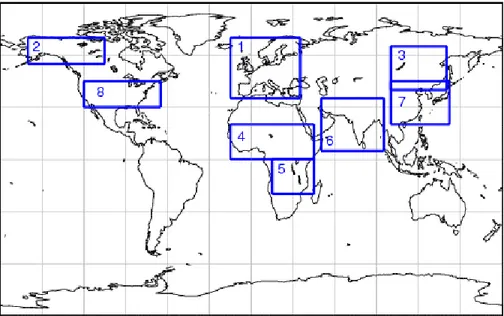
8 regions are defined (see Fig. 1): Europe, Fires-Alaska, Fires-Siberia, North Africa, South Africa, South Asia, East Asia and the United States.
The model update in July 2012 includes an integration of MOPITT CO total columns in the model’s data assimilation system. With this, the MOPITT validation data has lost its independency for the rest of the validation period and MOPITT validation data has 5
thus only been used until June 2012 for validation purposes.
2.2.4 SCIAMACHY and GOME-2 NO2satellite observations
The SCanning Imaging Absorption spectroMeter for Atmospheric CHartographY (SCIAMACHY; Bovensmann et al., 1999) onboard the ENVISAT and the Global Ozone Monitoring Experiment-2 (GOME-2; Callies et al., 2000) onboard the Meteorologi-10
cal Operational Satellite-A (MetOp-A) comprise UV-vis and near-infrared sensors de-signed to provide global observations of atmospheric trace gases.
In this study, the tropospheric NO2column data set described in Hilboll et al. (2013a)
has been used. In short, the measured radiances are analysed using Differential Opti-cal Absorption Spectroscopy (DOAS), (Platt and Stutz, 2008) in the 425–450 nm wave-15
length window (Richter and Burrows, 2002). The influence of stratospheric NO2 air
masses has been accounted for using the algorithm detailed by Hilboll et al. (2013b), using stratospheric NO2 fields from the B3dCTM model (Sinnhuber at al., 2003a; Sinnhuber et al., 2003b; Winkler et al., 2008). Tropospheric air mass factors have been calculated with the radiative transfer model SCIATRAN (Rozanov et al., 2005). Only 20
measurements with FRESCO+ algorithm (Wang et al., 2008) cloud fractions of less than 20 % are used.
Tropospheric NO2 vertical column densitiy (VCD) from the MACC_osuite is
com-pared to tropospheric NO2 VCD from GOME-2 and SCIAMACHY. As the European Space Agency lost contact with ENVISAT in April 2012, GOME-2 data is used for model 25
ACPD
15, 6277–6335, 2015Evaluation of the MACC operational
forecast system
A. Wagner et al.
Title Page
Abstract Introduction
Conclusions References
Tables Figures
◭ ◮
◭ ◮
Back Close
Full Screen / Esc
Printer-friendly Version
Interactive Discussion
Discussion
P
a
per
|
Discussion
P
a
per
|
Discussion
P
a
per
|
Discussion
P
a
per
horizontal model resolution, i.e. 1.875◦ for IFS cycle CY36R1 (September 2009–June
2012) and 1.125◦for cycle CY37R3 (July 2012–December 2012).
A few processing steps are applied to the MACC_osuite data to account for diff er-ences to the satellite data such as observation time. Firstly, model data are vertically integrated to tropospheric NO2 VCDs by applying National Centers for Environmental
5
Prediction (NCEP) reanalysis (Kalnay et al., 1996) climatological tropopause pressure shown in Fig. 1 of Santer et al. (2003). Secondly, simulations are interpolated linearly to the SCIAMACHY equator crossing time (roughly 10:00 LT). This most likely leads to some minor overestimation of model NO2 VCDs compared to GOME-2 data, as
the equator crossing time for GOME-2 is about 09:30 LT. Moreover, only model data for 10
which corresponding satellite observations exist are considered. For the evaluation, the same regions have been used as for MOPITT (Fig. 1), except for Siberia and Alaska. In contrast to MOPITT data, no averaging kernel is applied.
2.3 Validation metrics
A comprehensive model evaluation requires the selection of validation metrics that 15
provide complementary aspects of model performance. The following metrics have been used in the evaluation:
Modified Normalized Mean Bias MNMB
MNMB= 2 N
X
i
fi−oi
fi+oi (1)
Root Mean Square Error RMSE
20
RMSE= s
1 N
X
i
ACPD
15, 6277–6335, 2015Evaluation of the MACC operational
forecast system
A. Wagner et al.
Title Page
Abstract Introduction
Conclusions References
Tables Figures
◭ ◮
◭ ◮
Back Close
Full Screen / Esc
Printer-friendly Version
Interactive Discussion
Discussion
P
a
per
|
Discussion
P
a
per
|
Discussion
P
a
per
|
Discussion
P
a
per
|
Correlation Coefficient
R=
1 N
P
i
fi−f oi−o
σfσo (3)
where: N is the number of observations, f are the modelled analysis and o the ob-served values,f and oare the mean values of the analysis and observed values and σf andσoare the corresponding SDs.
5
The validation metrics above have been chosen to provide complementary aspects of model performance. The modified normalized mean bias (e.g. Elguindi et al., 2010) ranges between −2 and 2 and is very useful to check whether there is a negative
or positive deviation between model and observations. When multiplied by 100 %, it can be interpreted as a percentage bias. The advantage of the MNMB is that it varies 10
symmetrically with respect to under- and overestimation and is robust with respect to outliers. However, when calculated over longer time periods, a balance in model error, with model over-and underestimation compensating each other, can lead to a small MNMB for the overall period. For this reason, it is important to additionally consider an absolute measure, such as the RMSE. However, it has to be noted that the RMSE 15
is strongly influenced by larger values and outliers, due to squaring. The correlation coefficient R can vary between 1 (perfect correlation) and −1 (negative correlation) and is an important measure to check the linearity between model and observations.
3 Results
3.1 Evaluation of O3mixing ratios
20
ACPD
15, 6277–6335, 2015Evaluation of the MACC operational
forecast system
A. Wagner et al.
Title Page
Abstract Introduction
Conclusions References
Tables Figures
◭ ◮
◭ ◮
Back Close
Full Screen / Esc
Printer-friendly Version
Interactive Discussion
Discussion
P
a
per
|
Discussion
P
a
per
|
Discussion
P
a
per
|
Discussion
P
a
per
stations. Large negative MNMBs over the whole period September 2009 to December 2012 (−30 to−82 %) are observed for stations located in Antarctica (Neumayer – NEU,
South Pole – SPO, Syowa – SYO and Concordia – CON) whereby O3 surface mixing
ratios are strongly underestimated by the model. For stations in the far north (Barrow – BAR, Alaska and Summit – SUM, Denmark), the MACC_osuite exhibits similar un-5
derestimated values of up to −35 % for the whole evaluation period. The time series
plots for Arctic and Antarctic stations (e.g. Summit – SUM, Neumayer – NEU and South Pole – SPO) in Fig. 13 show that an underestimation visible in these regions has been remedied and model performance improved with an updated dry deposition parame-terization over ice, which has been introduced with the new model cycle in July 2012 10
(see Sect. 2.1).
Large positive MNMBs (up to 50 to 70 %, Fig. 11) are observed for stations that are located in or nearby cities and thus exposed to regional sources of contamination (Iskrba – ISK Slovenia, Tsukuba – TSU, Japan, Cairo – CAI, Egypt). In tropical and sub-tropical regions, O3 surface mixing ratios are systematically overestimated (by about
15
20 % on average) during the evaluation period. The time series plots for tropical and subtropical stations (e.g. for Ragged Point – RAG, Barbados and Cape Verde Obser-vatory, Cape Verde – CVO, Fig. 13) reveal a slight systematic positive offset throughout the year, however with high correlation coefficients (0.6 on average).
For GAW stations in Europe, the evaluation of the MACC_osuite for the whole period 20
shows MNMBs between−80 and 67 %. Large biases appear only for 2 GAW stations
located in Europe: Rigi – RIG, Switzerland (−80 %), located near mountainous terrain
and Iskrba – ISK, Slovenia (67 %). For the rest of the stations MNMBs lie between 22 and −30 %. RMSEs range between 7 and 35 ppb (15 ppb on average). Again results
for Iskrba – ISK and Rigi – RIG show the largest errors. All other stations show RMSEs 25
between 7 and 20 ppb. Correlation coefficients here range between 0.1 and 0.7 (with 0.5 on average). Table 6 summarizes the results for all stations individually.
ACPD
15, 6277–6335, 2015Evaluation of the MACC operational
forecast system
A. Wagner et al.
Title Page
Abstract Introduction
Conclusions References
Tables Figures
◭ ◮
◭ ◮
Back Close
Full Screen / Esc
Printer-friendly Version
Interactive Discussion
Discussion
P
a
per
|
Discussion
P
a
per
|
Discussion
P
a
per
|
Discussion
P
a
per
|
and 29 % during the months June and October), and negative MNMBs during the north-ern winter months (between −2 and −33 % during the months December to March).
These deviations partly cancel each other out in MNMB for the whole evaluation period. For the RMSEs, maximum values also occur during the northern summer months with global average ranging between 11 and 16 ppb for June to September. The smallest 5
errors appear during the northern winter months (global average falling between 8 and 10 ppb for December and January). The correlation does not show a distinct seasonal behaviour (see Fig. 12).
The time series plots in Fig. 13 show that the seasonal cycle of O3mixing ratios with
maximum concentrations during the summer months and minimum values occurring 10
during winter times for European stations (e.g. Monte Cimone – MCI, Italy, Kosetice – KOS, Czech Republic, and Kovk – KOV, Slovenia), could well be reproduced by the model, although there is some overestimation in summer resulting mostly from observed minimum concentrations that are not captured correctly by MACC_osuite, (Kosetice – KOS, Czech Republic, and Kovk – KOV, Slovenia).
15
The validation with EMEP surface ozone observations (described in Sect. 2.2.2) in three different regions in Europe for the period September 2009 to December 2012 like-wise confirms the behaviour of the model to overestimate O3 mixing ratios during the
warm period and underestimate O3 concentrations during the cold period of the year
(see Fig. 14). The positive bias (May–November) is between−9 and 56 % for northern
20
Europe and Central Europe and between 8 and 48 % for Southern Europe. Negative MNMBs appear, in accordance with GAW validation results, during the winter-spring period (December–April) ranging between−48 and−7 % for EMEP stations in
north-ern Europe (exception: December 2010 with 25 %), between−1 and −39 % in central
Europe (exception: December 2012 with 31 %), whereas in southern Europe, devia-25
tions are smaller and remain mostly positive (between−8 and 9 %) in winter (exception:
December 2012 with 37 %). The evaluation of the diurnal O3cycle (Fig. 15) shows that
ACPD
15, 6277–6335, 2015Evaluation of the MACC operational
forecast system
A. Wagner et al.
Title Page
Abstract Introduction
Conclusions References
Tables Figures
◭ ◮
◭ ◮
Back Close
Full Screen / Esc
Printer-friendly Version
Interactive Discussion
Discussion
P
a
per
|
Discussion
P
a
per
|
Discussion
P
a
per
|
Discussion
P
a
per
southern Europe night-time biases are larger during cold periods (December–April), whereas during warm periods (May–November) larger biases appear during day time.
3.2 Evaluation of carbon monoxide
The evaluation of the MACC_osuite with surface observations of 29 GAW stations (de-scribed in Sect. 2.2.1) shows that over the whole period September 2009 to Decem-5
ber 2012, CO mixing ratios could be reproduced with an average Modified Normalized Mean Bias (MNMB, see Sect. 2.3) of−10 %. The MNMBs for all stations range between −50 and+30 %. MNMBs exceeding±30 % appear for stations that are either located
in or nearby cities and thus exposed to regional sources of contamination (Kosetice – KOS, Czech Republic) or are located in or near complex mountainous terrain (Rigi 10
– RIG, Switzerland, BEO Moussala – BEO, Bulgaria) which is not resolved by the to-pography of the global model. Root Mean Square Errors (RMSEs, see Sect. 2.3) fall between 12 and 143 ppb (on average 48 ppb) for all stations during the validation pe-riod, but for only four stations (Rigi – RIG, Kosetice – KOS, Payerne – PAY, Switzerland and BEO Moussala – BEO, all located in Europe) do the RMSEs exceed 70 ppb. Cor-15
relation coefficients from the comparison with GAW station data calculated over the whole time period range between 0 and 0.8 (on average 0.4), with only four stations showing values smaller than 0.2 (Rigi – RIG, Moussala – BEO, East Trout Lake – ETL and Lac la Biche – LAC (the latter two located in Canada). All results are listed in Table 4.
20
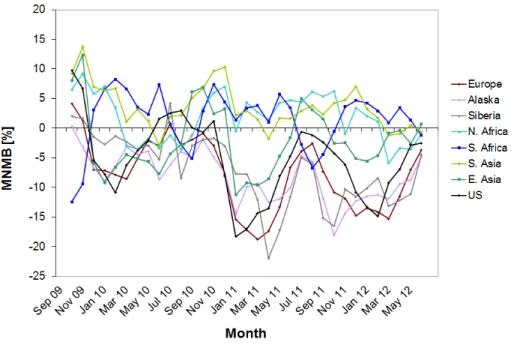
Considering the monthly MNMBs, RMSEs and correlation coefficients, it can be seen that during the northern summer months, June to September, MNMBs are small (abso-lute differences less than 5 %), see Fig. 2. Negative MNMBs (up to−35 %) and larger
RMSEs (up to 72 ppb) appear during the northern winter months, November to March, when anthropogenic emissions are at a highest, especially for the US, northern lati-25
re-ACPD
15, 6277–6335, 2015Evaluation of the MACC operational
forecast system
A. Wagner et al.
Title Page
Abstract Introduction
Conclusions References
Tables Figures
◭ ◮
◭ ◮
Back Close
Full Screen / Esc
Printer-friendly Version
Interactive Discussion
Discussion
P
a
per
|
Discussion
P
a
per
|
Discussion
P
a
per
|
Discussion
P
a
per
|
lated to mismatches in the strong short-term variability seen in both the model and the measurements.
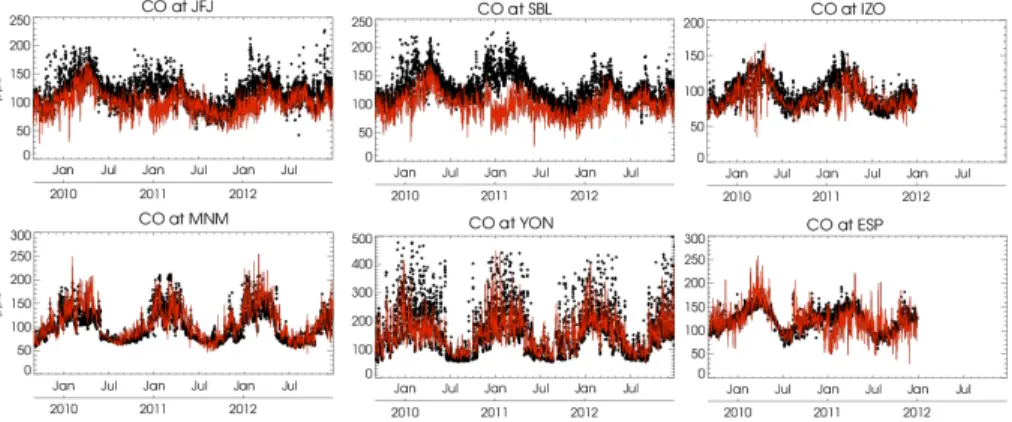
The time series plots in Fig. 3 demonstrate that the annual CO cycle could to a large degree be reproduced correctly by the model with maximum values occurring during the winter period and minimum values appearing during the summer season. How-5
ever, the model shows a negative offset during the winter period. Seasonal air mass transport patterns that lead to regular annual occurring CO variations could be re-produced for GAW stations in East Asia: the time series plots for Yonagunijima – YON and Minamitorishima – MNM station, Japan (Fig. 3) show that the drop of CO, asso-ciated with the air mass change from continental to cleaner marine air masses after 10
the onset of the monsoon season during the early summer months, is captured by the MACC_osuite. Deterioration in all scores is visible during December 2010 in the time series plots of several stations (e.g. Jungfraujoch – JFJ, and Sonnblick – SBL, Fig. 3). This is likely a result of changes in the processing of the L2 IASI data and a temporary blacklisting of IASI data (to avoid model failure) in the assimilation.
15
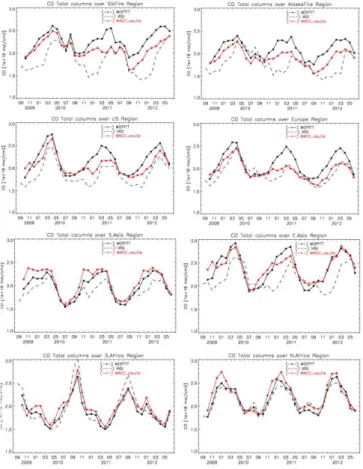
The comparison with MOPITT satellite CO total columns between October 2009 and June 2012 (described in Sect. 2.2.3) shows a good qualitative agreement of spatial pat-terns and seasonality. The MNMBs for 8 regions are listed in Fig. 4 and range between 14 and −22 %. The seasonality of the satellite observations is captured well by the
MACC_osuite over Asia and Africa, with MNMBs between−6 and 9 % (North Africa),
20
−12 and 8 % (South Africa),−11 and 12 % (East Asia), and−3 and 14 % (South Asia).
The largest negative MNMBs appear during the winter periods, especially from De-cember 2010 to May 2011 and from September 2011 to April 2012, for Alaska and Siberia and for the US and Europe (MNMBs up to−22 %), which coincides with large
differences between MOPITT and IASI satellite data (see Fig. 5). On the global scale 25
ACPD
15, 6277–6335, 2015Evaluation of the MACC operational
forecast system
A. Wagner et al.
Title Page
Abstract Introduction
Conclusions References
Tables Figures
◭ ◮
◭ ◮
Back Close
Full Screen / Esc
Printer-friendly Version
Interactive Discussion
Discussion
P
a
per
|
Discussion
P
a
per
|
Discussion
P
a
per
|
Discussion
P
a
per
These differences can be mainly explained by the use of different a priori assumptions in the IASI and MOPITT retrieval algorithms (George et al., 2015). Indeed, the Fast Op-timal Retrievals on Layers for IASI (FORLI) software (IASI) is using a single a priori CO profile (with an associated variance-covariance matrix) whereas the MOPITT retrieval algorithm is using a variable a priori, depending on time and location. George et al. 5
(2015) show that differences above Europe and the US in January and December (for a 5 year study) decrease by a factor of 2 when comparing IASI with a modified MOPITT product using the IASI single a priori. Between January 2011 and October 2011 there has also been a reading error in the fire emissions that contributes to larger MNMBs during this period (see Sect. 2.1.1).
10
3.3 Evaluation of tropospheric nitrogen dioxide
Figure 6 shows daily tropospheric NO2 VCD averaged over six regions from
Septem-ber 2009 to DecemSeptem-ber 2012. Overall, spatial distribution and magnitude of tropospheric NO2 observed by GOME-2 and SCIAMACHY are well reproduced by the model. This indicates that emission patterns and NOx photochemistry are reasonably well
repre-15
sented by the model. However, the model underestimates tropospheric NO2 VCDs
over industrial areas in Europe, East China, Russia, and South East Africa compared to satellite data. This could imply that anthropogenic emissions from RETRO-REAS are underestimated in these regions, or that the lifetime in the model is too short. The model simulates larger NO2VCD maxima over Central Africa, which mainly originate
20
from wild fires. It remains unclear if GFEDv2/GFAS fire emissions are too high here or if NO2fire plumes closer to the ground cannot be seen by the satellites due to light
scat-tering by biomass burning aerosols (Leitao et al., 2010). In the Northern Hemisphere, background values of NO2VCD over the ocean are lower in the simulations than in the satellite data. The same is true for the South Atlantic Ocean to the west of Africa (see 25
Fig. 7). This might suggest complex processes involving NO2transport or chemistry, or
ACPD
15, 6277–6335, 2015Evaluation of the MACC operational
forecast system
A. Wagner et al.
Title Page
Abstract Introduction
Conclusions References
Tables Figures
◭ ◮
◭ ◮
Back Close
Full Screen / Esc
Printer-friendly Version
Interactive Discussion
Discussion
P
a
per
|
Discussion
P
a
per
|
Discussion
P
a
per
|
Discussion
P
a
per
|
Monthly means of tropospheric NO2 VCD averaged over different regions are pre-sented in Fig. 8. A time series of the MNMB and RMSE is shown in Figs. 9 and 10. Table 5 summarizes the statistical values derived over the whole time period. High anthropogenic emissions occur over the United States, Europe, South Asia and East Asia compared to other regions on the globe (e.g., Richter et al., 2005). In 5
principle, the MACC_osuite catches the pattern of satellite NO2 VCD over these
re-gions. However, the model tends to underestimate NO2 VCDs throughout the whole time period investigated here. The negative bias is most pronounced over East Asia with a modelled mean NO2 VCD for September 2009 to December 2012 of about
3.74×10¹⁵molec cm−2 lower than that derived from satellite measurements (see
Ta-10
ble 5).
Considering monthly values, the MACC_osuite strongly underestimates magnitude and seasonal variation of satellite NO2VCD over East Asia (MNMBs between−40 and
−110 % and RMSE between 1×10¹⁵molec cm−2and 14×1015molec cm−2throughout
the whole time period). A change in the modelled NO2values is apparent in July 2012
15
when the emission inventories changed and the agreement with the satellite data im-proved for South and East Asia but deteriorated for the US and Europe. This results in a drop of MNMBs (Fig. 9) for Europe and the US with values approaching around
−60 % by the end of 2012. Nevertheless, correlations between daily satellite and model
data derived for the whole time period (see Table 5) are high for East Asia (0.840), 20
South Asia (0.744), Europe (0.781), and lower, but still rather high, for the US (0.567). The North African and South African regions are strongly affected by biomass burn-ing (Schreier et al., 2013). Magnitude and seasonality of daily and monthly tropospheric NO2 VCDs (Figs. 6 to 8) are rather well represented by the model, apart from Jan-uary 2011 to October 2011, due to difficulties in reading fire emissions for this time pe-25
ACPD
15, 6277–6335, 2015Evaluation of the MACC operational
forecast system
A. Wagner et al.
Title Page
Abstract Introduction
Conclusions References
Tables Figures
◭ ◮
◭ ◮
Back Close
Full Screen / Esc
Printer-friendly Version
Interactive Discussion
Discussion
P
a
per
|
Discussion
P
a
per
|
Discussion
P
a
per
|
Discussion
P
a
per
September 2009 and December 2012 are lower than the corresponding satellite mean values (see Table 5). The correlation between daily model and satellite data over the whole time period is 0.606 for South Africa but only 0.455 for North Africa, respectively. It should be investigated in future studies, if this difference in model performance for the African regions is due to meteorology, chemistry or emissions.
5
4 Discussion
The MACC_osuite model realistically reproduces CO and NO2total columns over most of the evaluated regions with monthly MNMBs falling between 10 and−20 % (CO) and
between 40 and −110 % for NO2. There is a close agreement of modelled CO total
columns and satellite observations for Africa and South Asia throughout the evalua-10
tion period. NO2 total columns agree well with satellite observations over the United
States, South Asia and North Africa. However, there is a negative offset compared to the observational CO data over Europe and North America and for NO2 over Europe and East Asia. The largest deviations occur during the winter season when the ob-served CO and NO2 concentrations are at a highest. The evaluation with GAW CO
15
data accordingly shows a wintertime negative bias of up to−35 % at the surface for
stations in Europe and the US. A general underestimation of CO from global models in the Northern Hemisphere has been described by various authors (e.g., Shindell et al., 2006; Naik et al., 2013). According to Stein et al. (2014) this underestimation likely results from a combination of errors in the dry deposition parameterization and certain 20
limitations in the current emission inventories. The latter include too low anthropogenic CO emissions from traffic or other combustion processes and missing anthropogenic VOC emissions in the emission inventories together with an insufficiently established seasonality in the emissions. An additional reason for the apparent underestimation of emissions in MACCity may be an exaggerated downward trend in the RCP8.5 (Rep-25
ACPD
15, 6277–6335, 2015Evaluation of the MACC operational
forecast system
A. Wagner et al.
Title Page
Abstract Introduction
Conclusions References
Tables Figures
◭ ◮
◭ ◮
Back Close
Full Screen / Esc
Printer-friendly Version
Interactive Discussion
Discussion
P
a
per
|
Discussion
P
a
per
|
Discussion
P
a
per
|
Discussion
P
a
per
|
their bench mark year, i.e. 2000. The quality of the emission inventory is even more crucial for short lived reactive species such as NO2, where model results depend to
a large extent on emission inventories incorporated in the simulations. This is high-lighted by the deterioration of agreement between model results and satellite data for the US in July 2012 when anthropogenic emissions were changed from RETRO-REAS 5
to MACCity. This change led to an increasing negative bias in NO2 over Europe and
North America and to an improvement for South and East Asia (see Fig. 9). A deteri-oration in MNMBs associated with the fire emissions is visible between January 2011 and October 2011 over regions with heavy fire activity (South Africa and East Asia), and goes back to a temporary error in the model regarding the reading of fire emissions 10
(see Figs. 6 and 8).
Particular challenges for an operational forecast system are regions with rapid changes in emissions such as China, where inventories need to be extrapolated to obtain reasonable trends. A large underestimation of NO2 in China especially in win-ter has been reported for other CTMs in previous publications (He et al., 2007; Ita-15
hashi et al., 2014). The latter has been linked to an underestimation of NOxand VOC
emissions, unresolved seasonality in the emissions and expected non-linearity of NOx chemistry. For CO, uncertainties in the evaluation also include the retrieved amount of CO total columns between IASI and MOPITT. These vary with region, with IASI show-ing lower CO concentrations in several regions (Alaska, Siberia, Europe and the US) 20
during the northern winter months, which possibly contribute to the deviations observed between the modelled data and MOPITT satellite data. These differences can primar-ily be explained by the use of different a priori assumptions in the IASI and MOPITT retrieval algorithms (George et al., 2015). On a global scale however, the average dif-ference between the IASI and MOPITT total columns is less than 10 % (George et al., 25
2009).
The validation of global O3mixing ratios with GAW observations at the surface
ACPD
15, 6277–6335, 2015Evaluation of the MACC operational
forecast system
A. Wagner et al.
Title Page
Abstract Introduction
Conclusions References
Tables Figures
◭ ◮
◭ ◮
Back Close
Full Screen / Esc
Printer-friendly Version
Interactive Discussion
Discussion
P
a
per
|
Discussion
P
a
per
|
Discussion
P
a
per
|
Discussion
P
a
per
monthly MNMBs between−30 and 30 % (GAW) and for Europe between−50 and 60 %
(EMEP). The bias between measured O3surface mixing ratios and the MACC_osuite
is seasonally dependent, with an underestimation of the observed O3 mixing ratios
during the northern winter season and an overestimation during the summer months. The validation of the diurnal cycle for Northern and Central Europe shows larger neg-5
ative MNMBs in the winter months during night time than day time (Fig. 15), so that the negative bias in winter could be attributed to the simulation of vertical mixing at night, also described by Ordoñez (2010) and Schaap (2008), which remains a challenge in the model. The systematic underestimation of O3mixing ratios throughout the year for
high latitude northern regions and Antarctica has its origin in an overestimation of the 10
O3 dry deposition velocities over ice. With the implementation of the new model cycle and MOZART model version, which includes updated velocity fields for the dry deposi-tion of O3, as described in Stein et al. (2013), the negative offset in the MACC_osuite
model has been remedied for high latitude regions from July 2012 onwards (see the time series plots for the South Pole station – SPO and Neumayer – NEU in Fig. 13). 15
The overestimation of O3mixing ratios for the northern hemispheric summer months is
a well-known issue and has been described by various model validation studies (e.g., Brunner et al., 2003; Schaap et al., 2008; Ordoñez et al., 2010; Val Martin et al., 2014). Inadequate ozone precursor concentrations and aerosol induced radiative effects (pho-tolysis) have been frequently identified as being the main factors. The time series plots 20
in Fig. 13, however, demonstrate that the minimum concentrations in particular are not captured by the model during summer. Possible explanations include a general under-estimation of NO titration which especially applies to stations with urban surroundings and strong sub-grid scale emissions (e.g. Tsukuba – TSU Fig. 13), including difficulties by the global model to resolve NO titration in urban plumes.
25
ACPD
15, 6277–6335, 2015Evaluation of the MACC operational
forecast system
A. Wagner et al.
Title Page
Abstract Introduction
Conclusions References
Tables Figures
◭ ◮
◭ ◮
Back Close
Full Screen / Esc
Printer-friendly Version
Interactive Discussion
Discussion
P
a
per
|
Discussion
P
a
per
|
Discussion
P
a
per
|
Discussion
P
a
per
|
to an underestimation of day-time dry deposition velocities: Val Martin et al. (2014) describe a reduction of the summertime O3 model bias for surface ozone after the
implementation of adjustments in stomatal resistances in the MOZART model’s dry deposition parameterization.
5 Conclusions
5
The MACC_osuite is the near-real-time MACC model analysis run for aerosol and global reactive gases. This model run proved capable of reproducing CO and NO2total columns over most of the evaluated regions, however with a negative offset compared to the observational data for CO over Europe and North America and for NO2over
Eu-rope and East Asia. It has shown for CO and NO2, that the emission inventories play 10
a crucial role for the quality of model results and remain a challenge for near-real-time modelling, especially for regions with rapid changes in emissions.
The validation of global O3 mixing ratios with GAW observations at the surface showed that MACC_osuite could mostly reproduce the observed annual cycle of ozone mixing ratios, however with a seasonally dependent bias, resulting from difficulties in 15
the simulation of vertical mixing at night and deficiencies in the model’s dry deposition parametrization. Temporary inconsistencies in the assimilated satellite data and fire emissions showed only a minor impact on the overall quality of model results.
The MACC NRT system is constantly evolving. A promising step in its model devel-opment is the on-line integration of modules for atmospheric chemistry in the IFS, cur-20
rently being tested for implementation in the MACC_osuite. In contrast to the coupled model configuration as used in this paper, the on-line integration in the Composition IFS (C-IFS) provides major advantages; apart from an enhanced computational efficiency, C-IFS promises an optimization of the implementation of feedback processes between gas-phase/aerosol chemical processes and atmospheric composition and meteorol-25
ACPD
15, 6277–6335, 2015Evaluation of the MACC operational
forecast system
A. Wagner et al.
Title Page
Abstract Introduction
Conclusions References
Tables Figures
◭ ◮
◭ ◮
Back Close
Full Screen / Esc
Printer-friendly Version
Interactive Discussion
Discussion
P
a
per
|
Discussion
P
a
per
|
Discussion
P
a
per
|
Discussion
P
a
per
will help to explain whether deviations between model and observations go back to deficiencies in the chemistry scheme of a model.
Acknowledgements. This work has been carried out in the framework of the MACC and MACC-II projects, funded under the EU Seventh Research Framework Programme for research and technological development. The authors thank the MACC validation and reactive gas
subpro-5
ject teams for the fruitful discussions. Model simulations were carried out using the ECMWF supercomputer. We wish to acknowledge the provision of GAW hourly station data from the World Data Centre of Greenhouse Gases (WDCGG) and hourly EMEP station data from the NILU database. Specifically, we like to thank: the CSIRO Oceans and Atmosphere Flagship for making the data freely available and the Australian Bureau of Meteorology for continued
10
operation and support of the Cape Grim station. We also like to thank Izaña Atmospheric Re-search Center (AEMET) for providing CO and O3data. Special thanks to the providers of NRT data to the MACC project, namely: Institute of Atmospheric Sciences and Climate (ISAC) of the Italian National Research Council (CNR), South African Weather Service, The University of York and National Centre for Atmospheric Science (NCAS (AMF)) (UK), and the Instituto
15
Nacional de Meteorologia e Geofisica (INMG) (Cape Verde), National Air Pollution Monitoring Network (NABEL) (Federal Office for the Environment FOEN and Swiss Federal Laborato-ries for Materials Testing and Research EMPA), Japan Meteorological Agency (JMA), Alfred Wegener Institute, Umweltbundesamt (Austria), National Meteorological Service (Argentina), Umweltbundesamt (UBA, Germany). We thank the National Center for Atmospheric Research
20
(NCAR) MOPITT science team and the NASA Langley Research Center, Atmospheric Sci-ence Data Center (ASDC), for producing and archiving the MOPITT CO product. IASI has been developed and built under the responsibility of the Centre National D’Etudes Spatiales (CNES, France). We are grateful to Juliette Hadji-Lazaro and the UBL/LATMOS IASI team for establishing the IASI-MACC near real time processing chain. We wish to acknowledge that
25
SCIAMACHY lv1 (level 1) radiances were provided to the Institute of Environmental Physics, University of Bremen by ESA through DLR/DFD.
References
ACPD
15, 6277–6335, 2015Evaluation of the MACC operational
forecast system
A. Wagner et al.
Title Page
Abstract Introduction
Conclusions References
Tables Figures
◭ ◮
◭ ◮
Back Close
Full Screen / Esc
Printer-friendly Version
Interactive Discussion
Discussion
P
a
per
|
Discussion
P
a
per
|
Discussion
P
a
per
|
Discussion
P
a
per
|
Ballabrera-Poy, J., Kalnay, E., and Yang, S.: Data assimilation in a system with two scales – combining two initialization techniques, Tellus A, 61, 539–549, doi:10.1111/j.1600-0870.2009.00400.x, 2009.
Bell, M. L., Peng, R. D., and Dominici, F.: The exposure–response curve for O3 and risk of mortality and the adequacy of current O3regulations, Environ. Health Persp., 114, 532–536,
5
2006.
Benedetti, A., Morcrette, J.-J., Boucher, O., Dethof, A., Engelen, R. J., Fisher, M., Flentje, H., Huneeus, N., Jones, L., Kaiser, J. W., Kinne, S., Mangold, A., Razinger, M., Simmons, A. J., Suttie, M., and the GEMS-AER team: Aerosol analysis and forecast in the European Cen-tre for Medium-Range Weather Forecasts Integrated Forecast System: data assimilation, J.
10
Geophys. Res., D13205, 114, doi:10.1029/2008JD011115, 2008.
Benedetti, A., Kaiser, J. W., and Morcrette, J.-J:. [Global Climate] Aerosols [in “State of the Climate in 2010”], B. Am. Meteorol. Sci., 92, S65–S67, 2011.
Bovensmann, H., Burrows, J. P., Buchwitz, M., Frerick, J., Noël, S., Rozanov, V. V., Chance, K. V., and Goede, A. P. H.: SCIAMACHY: mission objectives and measurement
15
modes, J. Atmos. Sci., 56, 127–150, 1999.
Brunner, D., Staehelin, J., Rogers, H. L., Köhler, M. O., Pyle, J. A., Hauglustaine, D., Jour-dain, L., Berntsen, T. K., Gauss, M., Isaksen, I. S. A., Meijer, E., van Velthoven, P., Pitari, G., Mancini, E., Grewe, G., and Sausen, R.: An evaluation of the performance of chemistry transport models by comparison with research aircraft observations. Part 1: Concepts and
20
overall model performance, Atmos. Chem. Phys., 3, 1609–1631, doi:10.5194/acp-3-1609-2003, 2003.
Callies, J., Corpaccioli, E., Eisinger, M., Hahne, A., and Lefebvre, A.: GOME-2 Metop’s Second-Generation Sensor for Operational Ozone Monitoring, ESA Bull., 102, 28–36, 2000.
Cammas, J.-P., Gilles, A., Chabrillat, S., Daerden, F., Elguindi, N., Flemming, J., Flentje, H.,
25
Deshler, C., T., Mercer, J. L., Smit, H. G. J., Stubi, R., Levrat, G., Johnson, B. J., Olt-mans, S. J., Kivi, R., Thompson, A. M., Witte, J., Davies, J., Schmidlin, F. J., Brothers, G., and Sasaki, T.: Atmospheric comparison of electrochemical cell ozonesondes from different maufacturers, and with different cathode solution strengths: the Balloon Experiment on Stan-dards for Ozonsondes, J. Geophys. Res., 113, D04307, doi:10.1029/2007JD008975, 2008.
30
ACPD
15, 6277–6335, 2015Evaluation of the MACC operational
forecast system
A. Wagner et al.
Title Page
Abstract Introduction
Conclusions References
Tables Figures
◭ ◮
◭ ◮
Back Close
Full Screen / Esc
Printer-friendly Version
Interactive Discussion
Discussion
P
a
per
|
Discussion
P
a
per
|
Discussion
P
a
per
|
Discussion
P
a
per
Clarisse, L., R’Honi, Y., Coheur, P.-F., Hurtmans, D., and Clerbaux, C.: Thermal in-frared nadir observations of 24 atmospheric gases, Geophys. Res. Lett., 38, L10802, doi:10.1029/2011GL047271, 2011.
Clerbaux, C., Boynard, A., Clarisse, L., George, M., Hadji-Lazaro, J., Herbin, H., Hurtmans, D., Pommier, M., Razavi, A., Turquety, S., Wespes, C., and Coheur, P.-F.: Monitoring of
atmo-5
spheric composition using the thermal infrared IASI/MetOp sounder, Atmos. Chem. Phys., 9, 6041–6054, doi:10.5194/acp-9-6041-2009, 2009.
Cooper, O. R., Parrish, D. D., Ziemke, J., Balashov, N. V., Cupeiro, M., Galbally, I. E., Gilge, S., Horowitz, L., Jensen, N. R., Lamarque, J.-F., Naik, V., Oltmans, S. J., Schwab, J., Shindell, D. T., Thompson, A. M., Thouret, V., Wang, Y., and Zbinden, R. M.: Global distribution and
10
trends of tropospheric ozone: an observation-based review, Elem. Sci. Anth., 2, 10000029, doi:10.12952/journal.elementa.000029, 2014.
Cuevas, E., Camino, C., Benedetti, A., Basart, S., Terradellas, E., Baldasano, J. M., Morcrette, J.-J., Marticorena, B., Goloub, P., Mortier, A., Berjón, A., Hernández, Y., Gil-Ojeda, M., and Schulz, M.: The MACC-II 2007–2008 reanalysis: atmospheric dust evaluation and
charac-15
terization over Northern Africa and Middle East, Atmos. Chem. Phys. Discuss., 14, 27797– 27879, doi:10.5194/acpd-14-27797-2014, 2014.
Deeter, M. N., Emmons, L. K., Edwards, D. P., Gille, J. C., and Drummond, J. R.: Vertical resolution and information content of CO profiles retrieved by MOPITT, Geophys. Res. Lett., 31, L15112, doi:10.1029/2004GL020235, 2004.
20
Deeter, M., Edwards, D. P., Gille, J. C., Emmons, L., Francis, G. L., Ho, S.-P., Mao, D. Y., Worden, H. M., Drummond, J. R., and Novelli, P. C.: The MOPITT version 4 CO product: algorithm enhancements, validation, and long-term stability, J. Geophys. Res., 115, D07306, doi:10.1029/2009JD013005, 2010.
Deeter, M. N., Worden, H. M., Edwards, D. P., Gille, J. C., Mao, D., and Drummond, J. R.:
25
MOPITT multispectral CO retrievals: ori-gins and effects of geophysical radiance errors, J. Geophys. Res., 116, D15303, doi:10.1029/2011JD015703, 2011.
Deeter, M. N., Worden, H. M., Edwards, D. P., Gille, J. C., and Andrews, A. E.: evaluation of MO-PITT retrievals of lower-tropospheric carbon monoxide over the United States, J. Geophys. Res., 117, D13306, doi:10.1029/2012JD017553, 2012.
30
![Table 4. Modified normalized mean bias (MNMB) [%], correlation coe ffi cient ( R ), and root mean square error (RMSE) [ppb] derived from the evaluation of the MACC_osuite with Global Atmo-spheric Watch (GAW) CO surface observations during the period Septemb](https://thumb-eu.123doks.com/thumbv2/123dok_br/17103786.237606/42.918.43.669.318.428/modified-normalized-correlation-evaluation-spheric-surface-observations-septemb.webp)
![Table 5. Statistics derived from satellite observations (SCIAMACHY from September 2009 until March 2012, GOME-2 from April 2012 to December 2012) and the MACC_osuite simulations of daily tropospheric NO 2 VCD [10 15 molec cm −2 ] averaged over di ff erent r](https://thumb-eu.123doks.com/thumbv2/123dok_br/17103786.237606/43.918.61.649.258.493/statistics-satellite-observations-sciamachy-september-december-simulations-tropospheric.webp)
![Table 6. Modified normalized mean bias (MNMB) [%], correlation coe ffi cient ( R ), and root mean square error (RMSE) [ppb] derived from the evaluation of the MACC_osuite with Global Atmo-sphere Watch (GAW) O 3 surface observations during the period Septemb](https://thumb-eu.123doks.com/thumbv2/123dok_br/17103786.237606/44.918.40.669.291.455/modified-normalized-correlation-evaluation-global-surface-observations-septemb.webp)