GMDD
8, 1077–1115, 2015Evaluation of near surface ozone over
Europe from the MACC reanalysis
E. Katragkou et al.
Title Page
Abstract Introduction
Conclusions References
Tables Figures
◭ ◮
◭ ◮
Back Close
Full Screen / Esc
Printer-friendly Version
Interactive Discussion
Discussion
P
a
per
|
Discussion
P
a
per
|
Discussion
P
a
per
|
Discussion
P
a
per
|
Geosci. Model Dev. Discuss., 8, 1077–1115, 2015 www.geosci-model-dev-discuss.net/8/1077/2015/ doi:10.5194/gmdd-8-1077-2015
© Author(s) 2015. CC Attribution 3.0 License.
This discussion paper is/has been under review for the journal Geoscientific Model Development (GMD). Please refer to the corresponding final paper in GMD if available.
Evaluation of near surface ozone over
Europe from the MACC reanalysis
E. Katragkou1, P. Zanis1, A. Tsikerdekis1, J. Kapsomenakis2, D. Melas3,
H. Eskes4, J. Flemming5, V. Huijnen4, A. Inness5, M. G. Schultz6, O. Stein6, and C. S. Zerefos2
1
Department of Meteorology and Climatology, School of Geology, Aristotle University of Thessaloniki, Thessaloniki, Greece
2
Research Centre for Atmospheric Physics and Climatology, Academy of Athens, Athens, Greece
3
Laboratory of Atmospheric Physics, School of Physics, Aristotle University of Thessaloniki, Thessaloniki, Greece
4
Royal Netherlands Meteorological Institute (KNMI), De Bilt, the Netherlands
5
ECMWF, Reading, UK
6
Forschungszentrum Jülich, Jülich, Germany
Received: 30 December 2014 – Accepted: 6 January 2015 – Published: 5 February 2015
Correspondence to: E. Katragkou ([email protected])
GMDD
8, 1077–1115, 2015Evaluation of near surface ozone over
Europe from the MACC reanalysis
E. Katragkou et al.
Title Page
Abstract Introduction
Conclusions References
Tables Figures
◭ ◮
◭ ◮
Back Close
Full Screen / Esc
Printer-friendly Version
Interactive Discussion
Discussion
P
a
per
|
Discussion
P
a
per
|
Discussion
P
a
per
|
Discussion
P
a
per
Abstract
This work is an extended evaluation of near surface ozone as part of the global re-analysis of atmospheric composition, produced within the European Funded project MACC (Monitoring Atmospheric Composition and Climate). It includes an evaluation over the period 2003–2012 and provides an overall assessment of the modelling
sys-5
tem performance with respect to near surface ozone for specific European subregions. Measurements at rural locations from the European Monitoring and Evaluation Pro-gram (EMEP) and the European Air Quality Database (AirBase) were used for the evaluation assessment. The annual overall error of near surface ozone reanalysis is on average 24 % over Europe, the highest found over Scandinavia (27 %) and the
low-10
est over the Mediterranean marine stations (21 %). Near surface ozone shows mostly a negative bias in winter and a positive bias during warm months. Assimilation re-duces the bias in near surface ozone and its impact is mostly notable in winter. With respect to the seasonal cycle, the MACC reanalysis reproduces the photochemically driven broad spring-summer maximum of surface ozone of central and south Europe.
15
However, it does not capture adequately the early spring peak and the shape of the seasonality at northern and north-eastern Europe. The diurnal range of surface ozone, which is an indication of the local photochemical production processes, is reproduced fairly well, with a tendency for a small overestimation during the warm months for most subregions (especially in central and southern Europe). Possible reasons leading to
20
discrepancies between the MACC reanalysis and observations are discussed.
1 Introduction
The European projects MACC (Monitoring Atmospheric Composition and Climate), MACC-II (Interim Implementation) were established under the umbrella of the Euro-pean Copernicus programme, formerly known as GMES (Global Monitoring for
Envi-25
com-GMDD
8, 1077–1115, 2015Evaluation of near surface ozone over
Europe from the MACC reanalysis
E. Katragkou et al.
Title Page
Abstract Introduction
Conclusions References
Tables Figures
◭ ◮
◭ ◮
Back Close
Full Screen / Esc
Printer-friendly Version
Interactive Discussion
Discussion
P
a
per
|
Discussion
P
a
per
|
Discussion
P
a
per
|
Discussion
P
a
per
|
prehensive range of services related to the chemical and particulate composition of the atmosphere (Hollingsworth et al., 2008; Flemming et al., 2009; Inness et al., 2013). Within MACC operational forecasts of atmospheric composition on global (Stein et al., 2012) and regional scale are produced. Furthermore, the MACC reanalysis (Inness et al., 2013) provides global atmospheric composition fields which can be used to serve
5
as boundary conditions for regional air quality models over Europe and world-wide. The MACC global model used for both reanalysis and forecasts consists of ECMWFs’ Integrated Forecast System (IFS) coupled to the MOZART-3 (Kinnison et al., 2007) chemistry transport model. The ECMWF modelling system makes use of its data-assimilation capabilities to combine observations of atmospheric composition with
10
the numerical model in order to produce a reanalysis of atmospheric composition (In-ness et al., 2009, 2014). ECMWF has year-long experience in producing reanalysis products, starting from 40 (Dethof and Holm, 2004) and continuing with ERA-Interim (Dragani, 2010, 2011).
Evaluation of MACC data is being done on a regular basis (Eskes et al., 2014) and
15
specifically for trace gases in the global troposphere (e.g. Stein et al., 2014) and the stratosphere (e.g. Lefever et al., 2014). The global reanalysis products are mostly used as a reference dataset for specific case studies (e.g. Knowland et al., 2014) or as boundary conditions for international activities, like the Air Quality Modelling Evalua-tion InternaEvalua-tional Initiative-AQME starting from phase I (e.g. Schere et al., 2012) up
20
to its current phase III. It is useful, therefore to have a systematic analysis on a key atmospheric species of the global reanalysis product (i) as a reference for those wish-ing to use it in their studies (ii) as a general assessment of the system performance, identifying potential issues needing further improvement.
In this work special emphasis is given on the evaluation of near surface ozone over
25
GMDD
8, 1077–1115, 2015Evaluation of near surface ozone over
Europe from the MACC reanalysis
E. Katragkou et al.
Title Page
Abstract Introduction
Conclusions References
Tables Figures
◭ ◮
◭ ◮
Back Close
Full Screen / Esc
Printer-friendly Version
Interactive Discussion
Discussion
P
a
per
|
Discussion
P
a
per
|
Discussion
P
a
per
|
Discussion
P
a
per
is one of the main pollutants affecting both human health and vegetation (Fuhrer and Booker, 2003; Scebba et al., 2005; Schlink et al., 2006). Sources of tropospheric ozone can be either the stratosphere–troposphere transport or the photochemical production through oxidation of VOCs (volatile organic compounds) and CO in the presence of ad-equate NOx(NOx=NO2+NO) concentrations (Lelieveld and Dentener, 2000). Ozone
5
precursors have natural as well as anthropogenic sources, the most important of which are emissions from soil/vegetation and fossil fuel combustion. Ambient ozone concen-trations depend strongly on availability and relative abundance of those gaseous pre-cursors but they are also modulated by the meteorological conditions (Davies et al., 1992; Bloomfield et al., 1996; Baertsch-Ritter et al., 2004; Hegarty et al., 2007;
Kal-10
abokas et al., 2008).
The issue of the short-term and long-term ozone variability is complex, being related to changes of anthropogenic and natural emissions, meteorological conditions, atmo-spheric boundary layer mixing processes and stratosphere–troposphere exchange. Although a number of measures aimed at reducing NOx and VOC emissions have
15
been effective in reducing concentration of precursor species and peak ozone values in Europe (EMEP/CCC-Report 1/2005; Vestreng et al., 2009), there are many stud-ies suggesting that background tropospheric ozone levels (even at near surface) are increasing (Chevalier et al., 2007; Ordóñez et al., 2007; Hess and Zbinden, 2013; Wil-son et al., 2012; Akritidis et al., 2014). Furthermore, although the current consensus
20
view is that photochemistry is the major contributor to the observed background ozone levels in the troposphere, there is still no consensus as to the mechanisms that lead to the formation of the spring ozone maximum observed in certain locations of the North-ern Hemisphere, distant from nearby pollution sources (Crutzen et al., 1999; Lelieveld and Dentener, 2000; Monks et al., 2000; Zanis et al., 2007). Hence the evaluation of
25
GMDD
8, 1077–1115, 2015Evaluation of near surface ozone over
Europe from the MACC reanalysis
E. Katragkou et al.
Title Page
Abstract Introduction
Conclusions References
Tables Figures
◭ ◮
◭ ◮
Back Close
Full Screen / Esc
Printer-friendly Version
Interactive Discussion
Discussion
P
a
per
|
Discussion
P
a
per
|
Discussion
P
a
per
|
Discussion
P
a
per
|
2 Methodology
2.1 Global model
The IFS includes greenhouse gases (Engelen et al., 2009) and aerosols (Benedetti et al., 2009; Morcrette et al., 2009). In MACC, the MOZART-3 chemistry transport model has been coupled to the IFS to provide chemical tendencies for ozone, carbon
5
monoxide, nitrogen oxides, and formaldehyde (Flemming et al., 2009), while chemi-cal data assimilation for these species takes place in IFS (Inness et al., 2009, 2014). MOZART-3 as used in the MACC reanalysis system is described in Stein et al. (2012, 2013).
A data assimilation system for aerosol, greenhouse gases and reactive gases is in
10
place based on ECMWF’s 4D-VAR data assimilation system. The fields of MACC re-analysis (hereafter MRE) are available globally at a horizontal resolution of∼80 km
(T159 spectral resolution) and 60 hybrid sigma-pressure levels from the surface up to 0.1 hPa. More details on the CTM and the IFS configurations and the data assimila-tion system are provided by Inness et al. (2014) and references therein. Since several
15
satellite instruments are used to assimilate one parameter in the data assimilation sys-tem, a bias correction method is applied to the data to account for the instrumental inconsistencies. In MRE a variational bias correction scheme for radiance data has been extended to atmospheric composition data (Inness et al., 2013). Mind that the impact of assimilation on near surface ozone is only the “residual” of correcting the
20
stratospheric and total ozone column.
To investigate the impact of assimilation on key atmospheric species, a control run was also performed (herafter CTRL), using the same reanalysis settings without assim-ilation. The control run is not a “clean” control analysis experiment, but a MOZART-3 stand alone simulation with the reanalysis settings (Inness et al., 2013). It has a free
25
GMDD
8, 1077–1115, 2015Evaluation of near surface ozone over
Europe from the MACC reanalysis
E. Katragkou et al.
Title Page
Abstract Introduction
Conclusions References
Tables Figures
◭ ◮
◭ ◮
Back Close
Full Screen / Esc
Printer-friendly Version
Interactive Discussion
Discussion
P
a
per
|
Discussion
P
a
per
|
Discussion
P
a
per
|
Discussion
P
a
per
the MRE and the CTRL is confined to the time period 2003–2010, when both time series are available.
2.2 Observations
Measurements from ground based European stations were used for the evaluation of modelled surface ozone, from the European Monitoring and Evaluation Programme
5
(EMEP) and the European Environment Agency databases (AirBase) covering the time period from 2003 to 2012. Only background rural stations have been used from the Air-Base database for comparisons with the coarse resolution model surface ozone. These include stations type 1–3 according to the Joly–Peuch classification methodology for surface ozone (Joly and Peuch, 2012). There is a total of 138 stations included in the
10
current analysis, fulfilling the above-mentioned criteria. This selection ensures that all stations are adequate for comparisons with coarse resolution (80 km) model data.
Observed data from the EMEP and AirBase database were available in hourly reso-lution, while model values were available in 3 hourly intervals. The corresponding data were extracted with a 3 hourly interval, to be comparable with modelled time-series.
15
The modelled data were extracted from the coupled system by means of interpolating surface ozone into each station location. Different model levels were used for compar-ison with ground based stations. The rationale behind the selection of different model level selection instead of extracting time series from the first model level (surface) is that in coarse resolution grids areas with anomalous terrain (e.g. mountainous areas)
20
are represented with an average elevation, which is less than the actual station ele-vation. Based on the difference between the actual station altitude and the average grid-cell elevation, the corresponding model level is selected, using atmospheric pres-sure as the correction criterion. We have used only those stations that fulfil the criteria of 75 % data availability for near surface ozone.
25
GMDD
8, 1077–1115, 2015Evaluation of near surface ozone over
Europe from the MACC reanalysis
E. Katragkou et al.
Title Page
Abstract Introduction
Conclusions References
Tables Figures
◭ ◮
◭ ◮
Back Close
Full Screen / Esc
Printer-friendly Version
Interactive Discussion
Discussion
P
a
per
|
Discussion
P
a
per
|
Discussion
P
a
per
|
Discussion
P
a
per
|
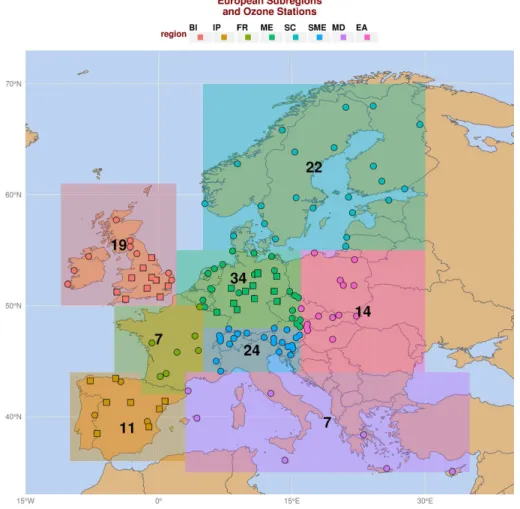
British Isles (BI), France (FR), Iberian Peninsula (IP), East Europe (EA), Middle Eu-rope (ME), Mediterranean (MD), South Middle EuEu-rope (SME) and Scandinavia (SC). Furthermore, the Mediterranean region was further split into the inland part (MDc) and the marine part (MDm), according to their spatial location (coastal or interior continen-tal), since each type of station has different characteristics.
5
Additional NO and NO2 data are included in the analysis, in order to assess the
potential of the photochemical ozone production. The NO and NO2 were extracted from EMEP and AirBase. Unfortunately the number of EMEP stations that provide NO and NO2measurements – besides O3 – for the whole reanalysis period (2003–2012)
is limited (30 stations). After application of the station type classification for O3 and
10
the data availability criteria, only 3 subregions with both O3 and NOx measurements remained, namely the British Isles (BI) with 10 stations, Iberian Peninsula (IP) with 8 stations and Middle Europe (ME) with 12 stations. The plots referring to ozone and nitrogen-species comparison correspond to a smaller number of the common stations mentioned above, always being a subset of the total.
15
We have also to take into consideration that the NOx observations are affected
strongly by local emissions, while there are known issues with interference by oxidized nitrogen compounds such as nitric acid (HNO3), peroxyacetyl nitrate (PAN), and other
organic nitrates for ground-based NO2measurements by most commercially available
NO2instruments using molybdenum converters, hence leading to an overestimation of
20
NOxconcentrations (Steinbacher et al., 2007).
Ozonesondes are used to validate ozone MRE profiles into the troposphere at 6 Eu-ropean stations: Haute-Provence (43.9◦N, 5.7◦E), Hohenpeissenberg (47.8◦N, 11◦E), Legionowo (52.4◦N, 20.9◦E), Payerne (46.8◦N, 6.9◦E), Sodankyla (67.4◦N, 26.6◦E) and Uccle (50.8◦N, 4.3◦E). The sondes used for the validation come from Network for
25
GMDD
8, 1077–1115, 2015Evaluation of near surface ozone over
Europe from the MACC reanalysis
E. Katragkou et al.
Title Page
Abstract Introduction
Conclusions References
Tables Figures
◭ ◮
◭ ◮
Back Close
Full Screen / Esc
Printer-friendly Version
Interactive Discussion
Discussion
P
a
per
|
Discussion
P
a
per
|
Discussion
P
a
per
|
Discussion
P
a
per
2.3 Metrics and intercomparison methodology
For the current evaluation study we use statistical metrics to quantify the bias, gross er-ror and temporal correlation of the model with regards to observational surface ozone. Comparisons of the diurnal ranges and cycles are also performed, as indices of pho-tochemical processes. As is also discussed by Savage et al. (2013), spatial and
tem-5
poral variations in chemical composition, including tropospheric ozone, can be large, while also differences between model and observed values are frequently much larger in magnitude than usual for meteorological variables. Therefore, mean error and root mean square error, even though being important metrics for estimating model errors, are not optimal when assessing model performance at different chemical regimes as
10
found over Europe.
Based on the evaluation guidelines and previous work within GEMS/MACC (Seigneur et al., 2010; Elguindi et al., 2010; Ordonez et al., 2010; Eskes et al., 2014) we use the Modified Normalized Mean Bias (MNMB) as a measure of the bias of mod-elled vs. observed values. This metric treats over- and underprediction in a symmetric
15
manner ranging between−2 and 2, in contrast to normalized mean bias that can grow
to very high values much greater than unit. The MNMB is calculated from Eq. (1) as follows:
MNMB= 2
N
N X
i
fi−oi fi+oi
(1)
wherefi andoi are the mean monthly modelled and observed values, respectively and
20
N the sample size. Seasonal averages are calculated as: winter (DJF), spring (MAM), summer (JJA) and autumn (SON).
Furthermore as a measure of the overall model error we use the Fractional Gross Error (FGE) calculated from Eq. (2), with its values ranging between 0 and 2. The advantage of this measure is the linear dependence on the departure, which makes
25
GMDD
8, 1077–1115, 2015Evaluation of near surface ozone over
Europe from the MACC reanalysis
E. Katragkou et al.
Title Page
Abstract Introduction
Conclusions References
Tables Figures
◭ ◮
◭ ◮
Back Close
Full Screen / Esc
Printer-friendly Version
Interactive Discussion
Discussion
P
a
per
|
Discussion
P
a
per
|
Discussion
P
a
per
|
Discussion
P
a
per
|
more standard root-mean square.
FGE= 2
N
N X
i
fi−oi fi+oi
(2)
The Pearson correlation (R) is used for the quantification of the temporal agreement (seasonality), between the observational and simulated data, whereσf andσoin Eq. (3) denote the SD of the modelled and observed values, respectively:
5
R=
1
N P
i
fi−f
oi−o
σfσo
(3)
The annual cycle of the diurnal range was calculated from the mean diurnal cycle of each station. The confidence interval for each month was derived using the values of the diurnal range for the stations that reside in the same subregion.
In the following section we present a thorough evaluation of surface ozone covering
10
the years from 2003 to 2012, including the three basic validation metrics, analysis of di-urnal/annual cycles and diurnal ranges. Additionally, surface ozone data are discussed along with nitrogen oxides, wherever data allows comparisons, in order to characterize different chemistry regimes above Europe, with respect to photochemical production.
3 Evaluation of the 2003–2012 MACC reanalysis near surface ozone
15
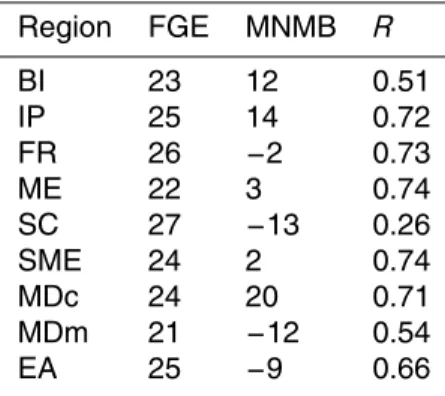
3.1 Validation metrics
The annual statistics of surface ozone are shown in Table 1. The FGE for the whole reanalysis period (2003–2012) ranges mostly from 21 % in Mediterranean marine sta-tions to 27 % in Scandinavia. The MACC reanalysis has generally a small MNMB (<15 %) and acceptable temporal correlations (0.6 to 0.7), with the exception of the
GMDD
8, 1077–1115, 2015Evaluation of near surface ozone over
Europe from the MACC reanalysis
E. Katragkou et al.
Title Page
Abstract Introduction
Conclusions References
Tables Figures
◭ ◮
◭ ◮
Back Close
Full Screen / Esc
Printer-friendly Version
Interactive Discussion
Discussion
P
a
per
|
Discussion
P
a
per
|
Discussion
P
a
per
|
Discussion
P
a
per
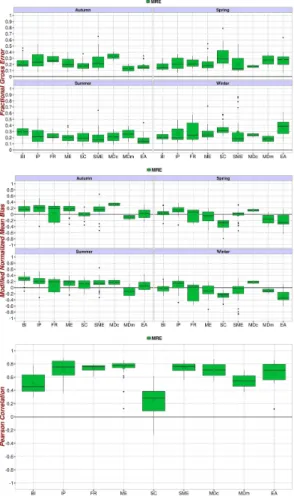
British Isles and Scandinavia which score below average R values. Figure 2 shows the basic validation metrics on a seasonal basis for the MACC reanalysis. Box and whisker plots summarize the following details: the bottom and top of the box are the first and third quartiles (Q1 or 25th percentile and Q3 or 75th percentile) and the ver-tical line in the box is the median (Q2 or 50th percentile). The colored points next to
5
each box indicate the mean value. Some European sub-regions have a strong sea-sonal variability with respect to FGE like East Europe, where the FGE ranges from 10 to 40 %, while some others exhibit a rather constant overall error throughout the year (e.g. IP). More precisely, in East Europe and Scandinavia surface ozone has larger error in winter/spring-time (40/28 % and 30/30 % for the two regions respectively) than
10
in summer/autumn (10/17 % and 20/18 %). On the other hand, regions like the Iberian Peninsula or Mid-Europe have a more stable performance with respect to FGE, with an average 20 % for all seasons. All other regions have errors ranging from 10 to 30 % depending on season. A more thorough analysis on the seasonal behavior of surface ozone is provided in the following section.
15
The seasonal MNMB in Fig. 2 (middle panel) is close to zero for most subregions. The final MRE surface ozone product, exhibits its highest MNMB for Scandinavia and East Europe in winter (−20 %). In summer the MNMB is mostly positive and re-mains<±20 % for most sub-regions, with the exception of British Isles (+30 %).
Tran-sitional season (spring/autumn) biases follow the patterns of the preceding season
20
(winter/summer), since the atmospheric trace gases need some time to adjust from the winter to the summer-time chemistry regime.
Figure 2 (bottom panel) shows the temporal correlation of the 2003–2012 near-surface ozone timeseries, build upon mean monthly values, and therefore providing a clue on the representation of ozone seasonality. The lowest correlation is found over
25
Scandinavia (0.26), followed by the British Isles (0.51) and the Mediterranean marine stations (0.54). All other regions have correlations≥0.7.
GMDD
8, 1077–1115, 2015Evaluation of near surface ozone over
Europe from the MACC reanalysis
E. Katragkou et al.
Title Page
Abstract Introduction
Conclusions References
Tables Figures
◭ ◮
◭ ◮
Back Close
Full Screen / Esc
Printer-friendly Version
Interactive Discussion
Discussion
P
a
per
|
Discussion
P
a
per
|
Discussion
P
a
per
|
Discussion
P
a
per
|
of the MRE and the CTRL simulation. The greatest improvement in the MACC reanal-ysis because of the assimilation is noted over Scandinavia, where the annual FGE is reduced from 40 to 27 %, East Europe (FGE drops from 38 to 25 %), Mediterranean inland stations (from 43 to 29 %) and Mid Europe (from 31 to 24 %). In the same areas the MNMB is also reduced by up to 23 % (SC). In France and the Iberian Peninsula
5
there seems to be a small increase in the FGE (by 6 and 8 % respectively) and a small change in the MNMB (reduced to zero in FR and increased by 5 % in IP). Over South Mid-Europe and the Mediterranean marine stations the change in FGE and MNMB is negligible on an annual basis. The annual correlation of monthly mean timeseries from 2003 to 2010 is slightly reduced in the MRE, especially over the Mediterranean marine
10
stations (drops from 0.74 to 0.49) and Scandinavia (from 0.39 to 0.23).
Figure 3 shows the comparison of the seasonal FGE, MNMB andRfor the MRE and the CTRL near surface ozone over the different European subregions for the common time period 2003–2010. On a seasonal basis (Fig. 3) the greatest improvement due to assimilation is seen during the winter months, when the CTRL suffers from the largest
15
negative bias. In summer the impact of assimilation is smaller, eventually because near surface ozone is largely controlled by the photochemical processes. Mind that the assimilation correction on ozone is due to the stratospheric and total ozone column. More results on the impact on tropospheric ozone from assimilation in the stratosphere can be found in Lefever et al. (2014).
20
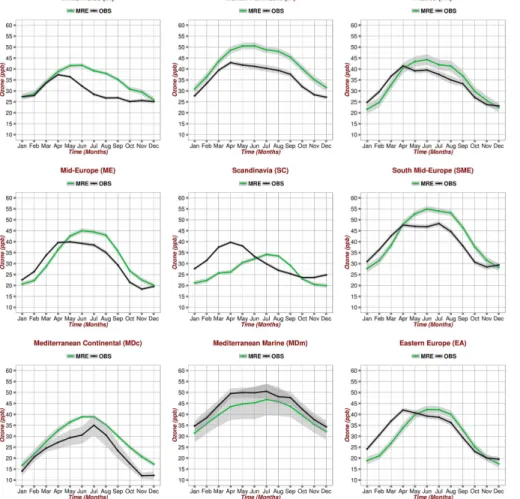
3.2 Annual cycle of near surface ozone
The average 2003–2012 observed and MRE annual cycle of near surface ozone is shown in Fig. 4. With the only exception of the Mediterranean region (MDc and MDm), the modeled annual cycles of ozone have differences in the shape from the observed ones. The most striking disagreement is seen over Scandinavia (SC), where the MRE
25
GMDD
8, 1077–1115, 2015Evaluation of near surface ozone over
Europe from the MACC reanalysis
E. Katragkou et al.
Title Page
Abstract Introduction
Conclusions References
Tables Figures
◭ ◮
◭ ◮
Back Close
Full Screen / Esc
Printer-friendly Version
Interactive Discussion
Discussion
P
a
per
|
Discussion
P
a
per
|
Discussion
P
a
per
|
Discussion
P
a
per
in very clean and remote atmospheres in the Northern Hemisphere (Volz and Kley, 1988), no indication of spring ozone maximum is evident in the MRE surface ozone; on the contrary, a clear lower maximum (35 ppb) is depicted in late summer.
Over the British Isles (BI) we also note striking differences in the shape of the annual cycle. Specifically, there is disagreement (a) in the “timeliness” of the early spring
max-5
imum, which is depicted in April for observed ozone and the late spring-early summer for the MRE, and (b) in the annual ozone range, which is overestimated by about 7 ppb. The overestimation occurs mainly during the summer/autumn season. We should note that, even though the MRE near surface ozone at SC and BI does not capture the observed spring maximum peaking in April, this spring ozone maximum is better
de-10
picted in the lower free troposphere at 850 and 700 hPa vertical levels of MRE (not shown here).
In Mid-Europe (ME), the observational broad spring-summer maximum (April–July) is captured by the MRE, with a month’s time-lag (May to August) revealing an underes-timation in MRE of 2–3 ppbv from January to April and an overesunderes-timation from May to
15
November (Fig. 4). Mind that the highest overestimation (ranging from 5 to 9 ppbv) in MRE is seen during the warm months from June to September. This behavior results to an overestimated annual amplitude in MRE in comparison to observations.
Over the Iberian Peninsula (IP) there is an agreement in the seasonal cycle of MRE near surface ozone with observations, with a broad spring-summer maximum but MRE
20
misses the April peak shown in observations. The amplitude of the MRE annual cycle is also overestimated by roughly 4 ppbv in comparison to observations, mostly stemming from the MRE summer O3overestimation, with the MRE June-maximum reaching up to 50 ppbv, while the observed to 40 ppbv. We should also take into consideration that the seasonal cycle of MRE at 700 hPa shows a broad spring-summer maximum with
25
a peak in April as in near surface observations (not shown here).
GMDD
8, 1077–1115, 2015Evaluation of near surface ozone over
Europe from the MACC reanalysis
E. Katragkou et al.
Title Page
Abstract Introduction
Conclusions References
Tables Figures
◭ ◮
◭ ◮
Back Close
Full Screen / Esc
Printer-friendly Version
Interactive Discussion
Discussion
P
a
per
|
Discussion
P
a
per
|
Discussion
P
a
per
|
Discussion
P
a
per
|
Overall, the annual cycles of the observed data reflect the specific subregional char-acteristics, namely the broad spring-summer maximum at Mediterranean (MDc and MDm) and South Mid-Europe (SME), the broad spring-summer maximum peaking in April at Eastern Europe (EA), Mid-Europe (ME), France (FR) and Iberian Peninsula (IP) and the early spring maximum over northern latitudes at Scandinavia (SC) and
5
British Isles (BI). MRE near surface ozone reproduces fairly well the photochemically driven broad spring-summer maximum of surface ozone of the sub-regions at central and south Europe, however, fails to capture the early spring peak in most of these sub-regions. This shortfall of MRE to capture the early spring peak has been also noted by Inness et al. (2013). Furthermore, there is generally a tendency for overestimating the
10
annual amplitude in MRE in comparison to observations.
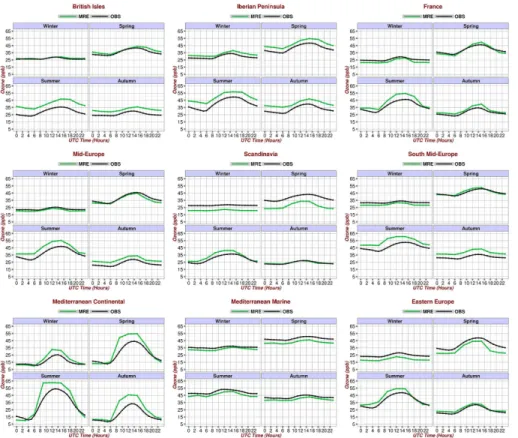
3.3 Diurnal cycle of near surface ozone
Figure 5 depicts the mean 2003–2012 diurnal cycle of near surface ozone for each season for the selected European regions. All diurnal cycles have the expected be-havior with sharply increasing ozone concentrations during the daytime hours (from
15
05:00–06:00 UTC in summer and 1–2 h later in winter to 15:00–16:00 UTC) and de-creasing afterwards. The diurnal cycles are more pronounced in the summer season and south Europe due to the more intense photochemistry. The MRE captures quite well the shape of the diurnal cycles with positive bias in summer (except for the Mediter-ranean marine region), which may be persisting during the whole day (BI, SME, IP, ME)
20
or occur mostly during daytime (EA, FR, MDc). In winter there is small negative bias in all regions, except for MDc (positive bias) and BI (zero bias). The transitional seasons have diurnal cycles that share both winter and summertime characteristics: the spring diurnal bias resembles winter with respect to bias, but has the enhanced photochemical diurnal cycle of summer, though not fully developed.
25
GMDD
8, 1077–1115, 2015Evaluation of near surface ozone over
Europe from the MACC reanalysis
E. Katragkou et al.
Title Page
Abstract Introduction
Conclusions References
Tables Figures
◭ ◮
◭ ◮
Back Close
Full Screen / Esc
Printer-friendly Version
Interactive Discussion
Discussion
P
a
per
|
Discussion
P
a
per
|
Discussion
P
a
per
|
Discussion
P
a
per
processes (Zanis et al., 2000). There is generally a good agreement with observations, suggesting that MRE reproduces adequately the observed diurnal ozone range with a tendency for a small overestimation during the warm months for the subregions of central and south Europe. More specifically, over SME, FR and MDc the diurnal range is overestimated during the whole year but, to a lesser extent in colder months, while
5
over EA, ME, BI and SC the overestimation is smaller and restricted during the summer. Hence the diurnal range is overestimated more at the southern regions (SME, FR and MDc) than at the northern regions (EA, ME, BI and SC) and more during the warm months than during the cold months.
4 Discussion
10
In this section we discuss possible reasons for the differences revealed in the shape of the annual cycle of near surface between observations and MRE and the fail in MRE to capture the early spring peak in most of the subregions. Is known that the spring O3 maximum observed in certain locations of the Northern Hemisphere, distant from
nearby pollution sources, has mainly two contributions, (i) the stratosphere to
tropo-15
sphere transport (STT), (Stohl et al., 2003 and references therein) and (ii) ozone pro-duction in the troposphere on a hemispherical scale, related to photochemical process-ing of precursor tropospheric trace gases (CO, NOx, VOCs) built up in winter (Penkett
and Brice, 1987) and the longer lifetime of ozone during winter that allows anthro-pogenically produced ozone to accumulate (Lie et al., 1987; Yienger et al., 1999). Here
20
GMDD
8, 1077–1115, 2015Evaluation of near surface ozone over
Europe from the MACC reanalysis
E. Katragkou et al.
Title Page
Abstract Introduction
Conclusions References
Tables Figures
◭ ◮
◭ ◮
Back Close
Full Screen / Esc
Printer-friendly Version
Interactive Discussion
Discussion
P
a
per
|
Discussion
P
a
per
|
Discussion
P
a
per
|
Discussion
P
a
per
|
4.1 Ozone profiles
Comparison with ozonesonde measurements at different locations (Fig. 7) indicate that MRE ozone profiles reproduce reasonably well the observed ozone profiles for all sea-sons. We note positive and negative biases depending on the location and the altitude, but there is a tendency for a larger positive bias during summer and autumn for most
5
locations below 850 hPa while the % biases in the middle and upper troposphere are generally smaller. This is in agreement with the study of Inness et al. (2013), who, analyzing MACC reanalysis over the time period (2003–2010), reported a negative bias with respect to ozonesondes above 650 hPa and the largest positive bias below 800 hPa.
10
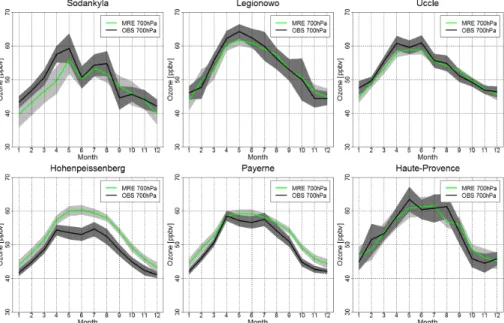
Furthermore, the shape of the observed ozone annual cycle (based on the ozonesondes) in lower free troposphere at 700 hPa is reproduced rather well by the MRE (Fig. 8). The course of the annual cycle is also reproduced for the middle tropo-sphere at 500 hPa (not shown here). Despite the biases, the reasonable reproduction of the shape of the observed ozone seasonal cycle in the middle and lower free
tropo-15
sphere suggests that transport processes from the lower stratosphere and the upper troposphere are resolved adequately by the MRE.
4.2 NOxvs. O3annual and diurnal cycles
According to the analysis of ozone profiles (see Sect. 4.1) we may assume that assim-ilation in MRE leads to a reasonable representation of the ozone annual cycles at the
20
middle and upper troposphere, thus mediating for a realistic contribution of STT. It could be hence speculated that differences in the shape of the seasonal cycle of near surface ozone between observations and the MRE could be also linked to the potential of pho-tochemical ozone production and the strength of the exchange between the lower free troposphere and the atmospheric boundary layer (ABL). Two tentative explanations
25
is-GMDD
8, 1077–1115, 2015Evaluation of near surface ozone over
Europe from the MACC reanalysis
E. Katragkou et al.
Title Page
Abstract Introduction
Conclusions References
Tables Figures
◭ ◮
◭ ◮
Back Close
Full Screen / Esc
Printer-friendly Version
Interactive Discussion
Discussion
P
a
per
|
Discussion
P
a
per
|
Discussion
P
a
per
|
Discussion
P
a
per
sues discussed in Stein et al., 2014) and (b) a loose coupling of the free troposphere to the ABL, which would be responsible for the entrainment of the assimilated free tropospheric O3into the ABL.
Nitrogen oxides (NOx) are the limiting precursors for O3production throughout most of the troposphere, and also directly influence the abundance of the hydroxyl radical
5
concentration in the troposphere (e.g. Crutzen, 1988). At NOx values less than a few
parts per billion by volume, O3formation is NOxlimited (Liu et al., 1987) and therefore almost independent of hydrocarbon concentrations. Emissions of NOx occur primarily
as NO, followed by oxidation to NO2 while O3 is photochemically produced as NOx
are consumed in favor of their atmospheric oxidation products NOz (Liu et al., 1987;
10
Zanis et al., 2007). NOz comprises mostly of peroxyacetylnitrate (PAN) and nitric acid (HNO3), along with HNO4, N2O5, NO3and other PAN homologues (PANs) and organic
nitrates (Emmons et al., 1997). The lifetime of NOx before photochemical conversion
to NOz is less than a day in summer at mid-latitudes (Logan, 1983).
Here, in order to assess the potential of the photochemical ozone production related
15
to NOxemissions, we have looked at the annual cycle of NOxvs. the respective annual
cycle of O3, as well as the summertime diurnal cycle of O3along with the diurnal cycle of NOx at the different sub-regions of our domain. As mention in Sect. 2.2, after our
station-filtering only 3 sub-regions remained, with a considerable number of stations having both O3 and NOx measurements; the British Isles (BI), Iberian Peninsula (IP)
20
and Mid-Europe (ME).
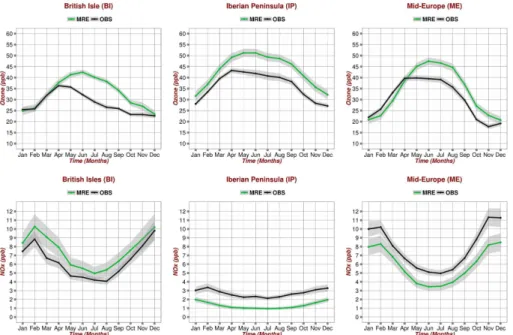
Figure 9 shows the annual cycle of O3 and NOx for BI, IP and ME. At the BI the
NOx levels are overestimated in MRE throughout the year by up to 2 ppbv in compar-ison to the observations while ozone is overestimated from May to November. The overestimation of NOx concentrations at MRE may partially account for the positive
25
ozone bias during the warm period of the year, through overestimated photochemical ozone production. At IP and ME, NOxlevels are systematically underestimated in MRE
GMDD
8, 1077–1115, 2015Evaluation of near surface ozone over
Europe from the MACC reanalysis
E. Katragkou et al.
Title Page
Abstract Introduction
Conclusions References
Tables Figures
◭ ◮
◭ ◮
Back Close
Full Screen / Esc
Printer-friendly Version
Interactive Discussion
Discussion
P
a
per
|
Discussion
P
a
per
|
Discussion
P
a
per
|
Discussion
P
a
per
|
Figure 10 shows the average diurnal cycle of O3 and NOx during summer for BI, IP and ME. Discarding any biases in the level of O3 and NOx concentrations, it is
shown that O3 builds up during the daytime while NOx is consumed, presumably due
to oxidation to NOz. The amplitude of the diurnal cycle of NOx is much stronger in the MRE, than at observations for BI and ME, which indicates that in MRE we have a more
5
intense local oxidation from NOxto NOz. This more intense local oxidation from NOxto
NOzat BI and ME can lead to higher local photochemical ozone production, which may account for the slightly higher amplitude of the diurnal cycle of O3for the MRE than the
observations (by roughly 2 pppv at BI and 1 ppbv at ME) and partially for the generally higher O3levels of the MRE compared to the observed.
10
In the case of IP, the amplitude of the diurnal cycle of NOxis similar for both obser-vations and MRE, while the amplitude of the diurnal cycle of O3 is slightly
underesti-mated in the MRE, indicating that local photochemical ozone production is captured adequately or slightly underestimated. Nevertheless, the ozone levels are generally overestimated for the MRE, implying other processes than local photochemistry as
15
a reason for the positive bias.
5 Summary and conclusions
In the current work we evaluate the MACC-II reanalysis (MRE) near surface ozone for the time period 2003–2012 using rural stations of the EMEP and AirBase monitor-ing networks. Overall, the evaluation of MRE near surface ozone with station based
20
observations shows a negative bias in winter over northern Europe and generally pos-itive bias during warm months. With respect to the seasonal cycle, MRE reproduces the photochemically driven broad spring-summer maximum of near surface ozone at central and south Europe. However, it does not capture adequately the shape of the seasonality with a characteristic early spring maximum at northern and north-eastern
25
GMDD
8, 1077–1115, 2015Evaluation of near surface ozone over
Europe from the MACC reanalysis
E. Katragkou et al.
Title Page
Abstract Introduction
Conclusions References
Tables Figures
◭ ◮
◭ ◮
Back Close
Full Screen / Esc
Printer-friendly Version
Interactive Discussion
Discussion
P
a
per
|
Discussion
P
a
per
|
Discussion
P
a
per
|
Discussion
P
a
per
a tendency for a small overestimation during the warm months for the subregions of central and south Europe. Comparison of MRE ozone profiles with ozonesonde profiles revealed reasonable reproduction of the shape of the observed ozone seasonal cycle in the middle and lower free troposphere, despite the biases. This suggests that trans-port processes from the lower stratosphere and the upper troposphere are resolved
5
acceptably by MRE with the aid of the assimilation.
More specifically, the characteristics of near surface ozone in the MACC reanalysis 2003–2012 can be summarized as follows for the different sub-regions:
a. At British Isles and Scandinavia, the observed near surface spring ozone max-imum peaking in April is not reproduced by MRE. However this spring ozone
10
maximum is better depicted in the lower free troposphere (at 850 and 700 hPa) implying adequate vertical transport within the free troposphere of the assimilated as was also indicated by the good comparison with ozonesonde data. The possi-bility insufficient entrainment and mixing from the lower free troposphere into the atmospheric boundary layer should be further investigated. MRE diurnal range
15
of near surface ozone compares relatively well with the observed diurnal range with a slight overestimation during summer. Analysis of the average MRE diurnal cycle of O3vs. NOxduring summer for the BI could possibly indicate among other
reasons, more intense local oxidation from NOx to NOz than the observed and
a systematic positive bias in NOx which can lead to higher local photochemical
20
ozone production.
b. The ozone summer maximum of the Mediterranean area is captured by the MRE, with a slight overestimation during summer and autumn for the inland stations (MDc). The MRE near surface ozone diurnal range compares well with the ob-served one throughout the year for the marine stations (MDm) and is slightly
25
GMDD
8, 1077–1115, 2015Evaluation of near surface ozone over
Europe from the MACC reanalysis
E. Katragkou et al.
Title Page
Abstract Introduction
Conclusions References
Tables Figures
◭ ◮
◭ ◮
Back Close
Full Screen / Esc
Printer-friendly Version
Interactive Discussion
Discussion
P
a
per
|
Discussion
P
a
per
|
Discussion
P
a
per
|
Discussion
P
a
per
|
Zanis et al. (2014) also noted for the Mediterranean an overestimation of near surface ozone during summer by another global chemistry–climate model, due to overestimated photochemical ozone production within the atmospheric boundary layer.
c. In East Europe, Mid-Europe, South Mid-Europe and France, MRE near surface
5
ozone reproduces the photochemically driven broad spring-summer maximum, but fails to capture the early spring peak in April. Furthermore, there is a slight shift of the seasonal cycle towards summer in MRE compared to observations, with a tendency for an underestimation of ozone levels in cold months (from January to April) and an overestimation in summer and autumn. The diurnal range of near
10
surface ozone in the MRE is overestimated during summer. This maybe implies an overestimated local photochemical ozone production, which can partially account for the summer overestimated MRE near surface ozone levels (similarly to MDc). Further analysis of the average diurnal cycle of O3vs. NOxduring summer for Mid-Europe, gives some indication for more intense local oxidation from NOx to NOz
15
for the MRE than the observations, which can lead to higher local photochemical ozone production despite the systematic negative bias in NOx.
d. At the Iberian Peninsula there is a positive bias throughout the year and the MRE does not capture the April peak shown in the observed seasonal cycle. The MRE diurnal range compares relatively well with the observed diurnal range, maybe
20
indicating that local photochemical production is captured adequately throughout the year. This is also supported from the analysis of the average diurnal cycle of O3vs. NOxduring summer. The seasonal cycle of MRE at 700 hPa shows a broad spring-summer maximum with a peak in April as in near surface observations. This feature could possibly indicate a loose coupling of the free troposphere with
25
atmospheric boundary layer.
GMDD
8, 1077–1115, 2015Evaluation of near surface ozone over
Europe from the MACC reanalysis
E. Katragkou et al.
Title Page
Abstract Introduction
Conclusions References
Tables Figures
◭ ◮
◭ ◮
Back Close
Full Screen / Esc
Printer-friendly Version
Interactive Discussion
Discussion
P
a
per
|
Discussion
P
a
per
|
Discussion
P
a
per
|
Discussion
P
a
per
diagnostics for photochemical production and loss terms, as well as the mixing between ABL and free troposphere.
Acknowledgements. MACC II is funded by the European Union’s Seventh Framework Pro-gramme (FP7) under Grant Agreement no. 283576. We thank the European Environmental Agency (AirBase) and the European Monitoring and Evaluation Programme (EMEP) for
provid-5
ing access to European O3and NOxobservations
References
Akritidis, D., Zanis, P., Pytharoulis, I., and Karacostas, Th.: Near-surface ozone trends over Europe in RegCM3/CAMx simulations for the time period 1996–2006, Atmos. Environ., 97, 6–18, 2014.
10
Baertsch-Ritter, N., Keller, J., Dommen, J., and Prevot, A. S. H.: Effects of various meteorolog-ical conditions and spatial emission resolutions on the ozone concentration and ROG/NOx limitation in the Milan area (I), Atmos. Chem. Phys., 4, 423–438, doi:10.5194/acp-4-423-2004, 2004.
Benedetti, A., Morcrette, J.-J., Boucher, O., Dethof, A., Engelen, R. J., Fisher, M., Flentje, H.,
15
Huneeus, N., Jones, L., Kaiser, J. W., Kinne, S., Mangold, A., Razinger, M., Simmons, A. J., Suttie, M., and the GEMS-AER team: Aerosol analysis and forecast in the European Centre for Medium-Range Weather Forecasts Integrated Forecast System: 2. Data assimilation, J. Geophys. Res., 114, D13205, doi:10.1029/2008JD011115, 2009.
Bloomfield, P., Royle, J. A., Steinberg, L. J., and Yang, Q.: Accounting for meteorological effects
20
in measuring urban ozone levels and trends, Atmos. Environ., 30, 3067–3077, 1996. Chevalier, A., Gheusi, F., Delmas, R., Ordóñez, C., Sarrat, C., Zbinden, R., Thouret, V.,
Athier, G., and Cousin, J.-M.: Influence of altitude on ozone levels and variability in the lower troposphere: a ground-based study for western Europe over the period 2001–2004, Atmos. Chem. Phys., 7, 4311–4326, doi:10.5194/acp-7-4311-2007, 2007.
25
Crutzen, P. J.: Tropospheric ozone: An overview, in: Tropospheric Ozone, edited by: Isaksen, I. S. A., D. Reidel Publ. Co., 3–32, 1988.
GMDD
8, 1077–1115, 2015Evaluation of near surface ozone over
Europe from the MACC reanalysis
E. Katragkou et al.
Title Page
Abstract Introduction
Conclusions References
Tables Figures
◭ ◮
◭ ◮
Back Close
Full Screen / Esc
Printer-friendly Version
Interactive Discussion
Discussion
P
a
per
|
Discussion
P
a
per
|
Discussion
P
a
per
|
Discussion
P
a
per
|
Dethof, A. and Holm, E. V.: Ozone assimilation in the ERA-40 re-analysis project, Q. J. Roy. Meteor. Soc., 130, 2851–2872, 2004.
Dragani, R.: On the quality of the ERA-Interim ozone reanalyses: comparisons with in situ data, ERA Report Series, 2, available at: http://old.ecmwf.int/publications/library/ecpublications/ _pdf/era/era_report_series/RS_2.pdf (last access: 29 November 2012), 2010.
5
Dragani, R.: On the quality of the era-interim ozone reanalyses: Comparisons with satellite data, Q. J. Roy. Meteorol. Soc., 137, 1312–1326, 2011.
Elguindi, N., Clark, H., Ordóñez, C., Thouret, V., Flemming, J., Stein, O., Huijnen, V., Moinat, P., Inness, A., Peuch, V.-H., Stohl, A., Turquety, S., Athier, G., Cammas, J.-P., and Schultz, M.: Current status of the ability of the GEMS/MACC models to reproduce the
tropo-10
spheric CO vertical distribution as measured by MOZAIC, Geosci. Model Dev., 3, 501–518, doi:10.5194/gmd-3-501-2010, 2010.
EMEP/CCC-Report 1/2005, The development of European surface ozone. Implications for a revised abatement policy, in: A Contribution from the EU Research Project NEPAP U-103003, edited by: Solberg, S. and Lindskog, A. March 2005.
15
Emmons, L. K., Carroll, M. A., Hauglustaine, D. A., Brasseur, G. P., Atherton, C., Penner, J., Sillman, S., Levy II, H., Rohrer, F., Wauben, W. M. F., Van Velthoven, P. F. J., Wang, Y., Jacob, D., Bakwin, P., Dickerson, R., Doddridge, B., Gerbig, C., Honrath, R., Hübler, G., Jaffe, D., Kondo, Y., Munger, J. W., Torres, A., and Volz-Thomas, A.: Climatologies of NOx and NOy: a comparison of data and models, Atmos. Environ., 31, 1851–1904, 1997.
20
Engelen, R. J., Serrar, S., and Chevallier, F.: Four-dimensional data assimilation of atmospheric CO2using AIRS observations, J. Geophys. Res., 114, D03303, doi:10.1029/2008JD010739, 2009.
Eskes, H., Huijnen, V., Arola, A., Benedictow, A., Blechschmidt, A., Botek, E., Boucher, O., Bouarar, I., Chabrillat, S., Cuevas, E., Engelen, R., Flentje, H., Gaudel, A., Griesfeller, J.,
25
Jones, L., Kapsomenakis, J., Katragkou, E., Kinne, S., Langerock, B., Razinger, M., Richter, A., Schultz, M., Schulz, M., Sudarchikova, N., Thouret, V., Vrekoussis, M., Wag-ner, A., and Zerefos, C.: Validation of reactive gases and aerosols in the MACC global anal-ysis and forecast system, Geosci. Model Dev. Discuss., submitted, 2014.
Flemming, J., Inness, A., Flentje, H., Huijnen, V., Moinat, P., Schultz, M. G., and Stein, O.:
30
GMDD
8, 1077–1115, 2015Evaluation of near surface ozone over
Europe from the MACC reanalysis
E. Katragkou et al.
Title Page
Abstract Introduction
Conclusions References
Tables Figures
◭ ◮
◭ ◮
Back Close
Full Screen / Esc
Printer-friendly Version
Interactive Discussion
Discussion
P
a
per
|
Discussion
P
a
per
|
Discussion
P
a
per
|
Discussion
P
a
per
Flemming, J., Dethof, A., Moinat, P., Ordonez, C., Peuch, V.-H., Segers, A., Schultz, M., Stein, O., and van Weele, M.: Coupling global atmospheric chemistry transport models to ECMWF Integrated Forecasts System for forecast and data assimilation within GEMS, in: Integrated Systems of Meso-Meteorological and Chemical Transport Models, edited by: Bak-lanov, A., Mahura, A., and Sokhi, R., Springer-Verlag, Berlin Heidelberg,
doi:10.1007/978-3-5
642-13980-2 10, 2011.
Fuhrer, J. and Booker, F.: Ecological issues related to ozone: agricultural issues, Environ. Int., 29, 141–154, 2003.
Hegarty, J., Mao, H., and Talbot, R.: Synoptic controls on summertime surface ozone in the northeastern United States, J. Geophys. Res., 112, D14306, doi:10.1029/2006JD008170,
10
2007.
Hess, P. G. and Zbinden, R.: Stratospheric impact on tropospheric ozone variability and trends: 1990–2009, Atmos. Chem. Phys., 13, 649–74, doi:10.5194/acp-13-649-2013, 2013.
Hollingsworth, A., Engelen, R. J., Textor, C., Benedetti, A., Boucher, O., Chevallier, F., De-thof, A., Elbern, H., Eskes, H., Flemming, J., Granier, C., Kaiser, J. W., Morcrette, J.-J.,
15
Rayner, P., Peuch, V. H., Rouil, L., Schultz, M. G., and Simmons, A. J.: The GEMS Consor-tium: toward a monitoring and forecasting system for atmospheric composition: the GEMS project, B. Am. Meteorol. Soc., 89, 1147–1164, 2008.
Inness, A., Flemming, J., Suttie, M., and Jones, L.: GEMS data assimilation system for chem-ically reactive gases, European Centre for Medium-Range Weather Forecasts (ECMWF),
20
Technical Memoradum No. 587, 2009.
Inness, A., Baier, F., Benedetti, A., Bouarar, I., Chabrillat, S., Clark, H., Clerbaux, C., Coheur, P., Engelen, R. J., Errera, Q., Flemming, J., George, M., Granier, C., Hadji-Lazaro, J., Huij-nen, V., Hurtmans, D., Jones, L., Kaiser, J. W., Kapsomenakis, J., Lefever, K., Leitão, J., Razinger, M., Richter, A., Schultz, M. G., Simmons, A. J., Suttie, M., Stein, O., Thépaut, J.-N.,
25
Thouret, V., Vrekoussis, M., Zerefos, C., and the MACC team: The MACC reanalysis: an 8 yr data set of atmospheric composition, Atmos. Chem. Phys., 13, 4073–4109, doi:10.5194/acp-13-4073-2013, 2013.
Inness, A., Blechschmidt, A., Bouarar, I., Chabrillat, S., Crepulja, M., Engelen, R. J., Er-rera, Q., Flemming, J., Gaudel, A., Huijnen, V., Jones, L., Kapsomenakis, J.,Keppens, A.,
30
experi-GMDD
8, 1077–1115, 2015Evaluation of near surface ozone over
Europe from the MACC reanalysis
E. Katragkou et al.
Title Page
Abstract Introduction
Conclusions References
Tables Figures
◭ ◮
◭ ◮
Back Close
Full Screen / Esc
Printer-friendly Version
Interactive Discussion
Discussion
P
a
per
|
Discussion
P
a
per
|
Discussion
P
a
per
|
Discussion
P
a
per
|
ments of satellite retrievals of O3, CO and NO2with Composition IFS, Geosci. Model Dev. Discuss., submitted, 2014.
IPCC: Climate change 2007: the physical science basis, in: Contribution of Working Group I to the Fourth Assessment Report of the Intergovernmental Panel on Climate Change, edited by: Solomon, S., Qin, D., Manning, M., Chen, Z., Marquis, M., Averyt, K. B., Tignor, M., and
5
Miller, H. L., Cambridge University Press, Cambridge, UK, New York, p. 996, 2007.
Joly, M. and Peuch, V.-H., Objective classification of air quality monitoring sites over Europe (2012), Atmos. Environ., 47, 111–123, 2012.
Kalabokas, P. D., Mihalopoulos, N., Ellul, R., Kleanthous, S., and Repapis, C. C.: An investiga-tion of the meteorological and photochemical factors influencing the background rural and
10
marine surface ozone levels in the Central and Eastern Mediterranean, Atmos. Environ., 42, 7894–7906, doi:10.1016/j.atmosenv.2008.07.009, 2008.
Knowland, K. E., Doherty, R. M., and Hodges, K. I.: The effects of springtime mid-latitude storms on trace gas composition determined from the MACC reanalysis, Atmos. Chem. Phys. Discuss., 14, 27093–27141, doi:10.5194/acpd-14-27093-2014, 2014.
15
Komhyr, W. D., Barnes, R. A., Borthers, G. B., Lathrop, J. A., Kerr, J. B., and Opper-man, D. P.: Electrochemical concentration cell ozonesonde performance evaluation during STOIC 1989, J. Geophys. Res., 100, 9231–9244, 1995.
Lefever, K., van der A, R., Baier, F., Christophe, Y., Errera, Q., Eskes, H., Flemming, J., In-ness, A., Jones, L., Lambert, J.-C., Langerock, B., Schultz, M. G., Stein, O., Wagner, A., and
20
Chabrillat, S.: Copernicus atmospheric service for stratospheric ozone: validation and inter-comparison of four near real-time analyses, 2009–2012, Atmos. Chem. Phys. Discuss., 14, 12461–12523, doi:10.5194/acpd-14-12461-2014, 2014.
Lelieveld, J. and Dentener, F.: What controls tropospheric ozone, J. Geophys. Res., 105, 3543– 3563, 2000.
25
Liu, S. C., Trainer, M., Fehsenfeld, F. C., Parrish, D. D., Williams, E. J., Fahey, D. W., Hübler, G., and Murphy, P. C.: Ozone production in the rural troposphere and the implications for regional and global ozone distributions, J. Geophys. Res., 92, 4191–4207, 1987.
Monks, P. S.: A review of observations and origins of the spring ozone maximum, Atmos. Envi-ron., 34, 3545–3561, 2000.
30
GMDD
8, 1077–1115, 2015Evaluation of near surface ozone over
Europe from the MACC reanalysis
E. Katragkou et al.
Title Page
Abstract Introduction
Conclusions References
Tables Figures
◭ ◮
◭ ◮
Back Close
Full Screen / Esc
Printer-friendly Version
Interactive Discussion
Discussion
P
a
per
|
Discussion
P
a
per
|
Discussion
P
a
per
|
Discussion
P
a
per
centre for medium-range weather forecasts integrated forecast system: forward modeling, J. Geophys. Res.-Atmos., 114, D06206, doi:10.1029/2008JD011235, 2009.
Ordóñez, C., Brunner, D., Staehelin, J., Hadjinicolaou, P., Pyle, J. A., Jonas, M., Wernli, H., and Prevot, A. S. H.: Strong influence of lowermost stratospheric ozone on lower tro-pospheric background ozone changes over Europe, Geophys. Res. Lett., 34, L07805,
5
doi:10.1029/2006GL029113, 2007.
Ordóñez, C., Elguindi, N., Stein, O., Huijnen, V., Flemming, J., Inness, A., Flentje, H., Katragkou, E., Moinat, P., Peuch, V.-H., Segers, A., Thouret, V., Athier, G., van Weele, M., Zerefos, C. S., Cammas, J.-P., and Schultz, M. G.: Global model simulations of air pollution during the 2003 European heat wave, Atmos. Chem. Phys., 10, 789–815,
doi:10.5194/acp-10-789-10
2010, 2010.
Penkett, S. A.: Indications and causes of ozone increase in the troposphere, in: The Changing Atmosphere, edited by: Rowland, F. S. and Isaksen, I. S. A., J. Wiley & Sons, 91, 1988. Penkett, S. A. and Brice, K. A.: The spring maximum in photooxidant in the Northern
Hemi-sphere tropoHemi-sphere, Nature, 319, 655–657, 1986.
15
Savage, N. H., Agnew, P., Davis, L. S., Ordóñez, C., Thorpe, R., Johnson, C. E., O’Connor, F. M., and Dalvi, M.: Air quality modelling using the Met Office Unified Model (AQUM OS24-26): model description and initial evaluation, Geosci. Model Dev., 6, 353–372, doi:10.5194/gmd-6-353-2013, 2013.
Scebba, F., Giuntini, D., Castagna, A., Soldatini, G., and Ranieri, A.: Analysing the impact
20
of ozone on biochemical and physiological variables in plant species belonging to natural ecosystems, Environ. Exp. Bot., 57, 235–246, 2005.
Schere, K., Flemming, J., Vautard, R., Chemel, C., Colette, A., Hogrefe, C., Bessagnet, B., Meleux, F., Mathur, R., Roselle, S., Hu, R.-M., Sokhi, R. S., Rao, S. T., and Galmarini, S.: Trace gas/aerosol boundary concentrations and their impacts on continental-scale AQMEII
25
modeling domains, Atmos. Environ., 53, 38–50, 2012.
Schlink, U., Herbarth, O., Richter, M., Dorling, S., Nunnari, G., Cawley, G., and Pelikan, E.: Statistical models to assess the health effects and to forecast ground-level ozone, Environ. Modell. Softw., 21, 547–558, 2006.
Stein, O.: Model documentation of the MOZART CTM as implemented in the GEMS
sys-30
GMDD
8, 1077–1115, 2015Evaluation of near surface ozone over
Europe from the MACC reanalysis
E. Katragkou et al.
Title Page
Abstract Introduction
Conclusions References
Tables Figures
◭ ◮
◭ ◮
Back Close
Full Screen / Esc
Printer-friendly Version
Interactive Discussion
Discussion
P
a
per
|
Discussion
P
a
per
|
Discussion
P
a
per
|
Discussion
P
a
per
|
Stein, O., Flemming, J., Inness, A., Kaiser, J. W., and Schultz, M. G.: Global reactive gases forecasts and reanalysis in the MACC project, J. Integr. Environ. Sci., 9, 57–70, doi:10.1080/1943815X.2012.696545, 2012.
Stein, O., Schultz, M. G., Bouarar, I., Clark, H., Huijnen, V., Gaudel, A., George, M., and Cler-baux, C.: On the wintertime low bias of Northern Hemisphere carbon monoxide found in
5
global model simulations, Atmos. Chem. Phys., 14, 9295–9316, doi:10.5194/acp-14-9295-2014, 2014.
Steinbacher, M., Zellweger, C., Schwarzenbach, B., Bugmann, S., Buchmann, B., Ordóñez, C., Prevot, A. S. H., and Hueglin, C.: Nitrogen oxide measurements at rural sites in Switzer-land: bias of conventional measurement techniques, J. Geophys. Res., 112, D11307,
10
doi:10.1029/2006JD007971, 2007.
Stohl, A., Bonasoni, P., Cristofanelli, P., Collins, W., Feichter, J., Frank, A., Forster, C., Gera-sopoulos, E., Gäggeler, H., James, P., Kentarchos, T., Kreipl, S., Kromp-Kolb, H., Krüger, B., Land, C., Meloen, J., Papayannis, A., Priller, A., Seibert, P., Sprenger, M., Roelofs, G. J., Scheel, E., Schnabel, C., Siegmund, P., Tobler, L., Trickl, T., Wernli, H., Wirth, V., Zanis, P.,
15
and Zerefos, C.: Stratosphere–troposphere exchange – a review, and what we have learned from STACCATO, J. Geophys. Res., 108, 1-1 - STA 1-15, doi:10.1029/2002JD002490, 2003. Valcke, S. and Redler, R.: OASIS4 User Guide (OASIS4 0 2), PRISM-Support Initiative,
Tech-nical Report No 4, available at: www.prism.enes.org/Publications/Reports/OASIS4_User_ Guide_T4.pdf (last access: 29 November 2012), 2006.
20
Vestreng, V., Ntziachristos, L., Semb, A., Reis, S., Isaksen, I. S. A., and Tarrasn, L.: Evolution of NOx emissions in Europe with focus on road transport control measures, Atmos. Chem. Phys., 9, 1503e1520, 2009,
http://www.atmos-chem-phys.net/9/1503/2009/.
Volz, A. and Kley, D.: Evaluation of the Montsouris series of ozone measurements made in the
25
nineteenth century, Nature, 332, 240–242, 1988.
Wilson, R. C., Fleming, Z. L., Monks, P. S., Clain, G., Henne, S., Konovalov, I. B., Szopa, S., and Menut, L.: Have primary emission reduction measures reduced ozone across Europe? An analysis of European rural background ozone trends 1996–2005, Atmos. Chem. Phys., 12, 437e454, doi:10.5194/acp-12-437-2012, 2012.
30
GMDD
8, 1077–1115, 2015Evaluation of near surface ozone over
Europe from the MACC reanalysis
E. Katragkou et al.
Title Page
Abstract Introduction
Conclusions References
Tables Figures
◭ ◮
◭ ◮
Back Close
Full Screen / Esc
Printer-friendly Version
Interactive Discussion
Discussion
P
a
per
|
Discussion
P
a
per
|
Discussion
P
a
per
|
Discussion
P
a
per
Zanis, P., Monks, P. S., Schuepbach, E., and Penkett, S. A.: The role of in-situ photochem-istry in the control of ozone during spring at the Jungfraujoch Observatory (3580 m a.s.l.) – Comparison of model results with measurements, J. Atmos. Chem., 37, 1–27, 2000.
Zanis, P., Ganser, A., Zellweger, C., Henne, S., Steinbacher, M., and Staehelin, J.: Seasonal variability of measured ozone production efficiencies in the lower free troposphere of Central
5
Europe, Atmos. Chem. Phys., 7, 223–236, doi:10.5194/acp-7-223-2007, 2007.
GMDD
8, 1077–1115, 2015Evaluation of near surface ozone over
Europe from the MACC reanalysis
E. Katragkou et al.
Title Page
Abstract Introduction
Conclusions References
Tables Figures
◭ ◮
◭ ◮
Back Close
Full Screen / Esc
Printer-friendly Version
Interactive Discussion
Discussion
P
a
per
|
Discussion
P
a
per
|
Discussion
P
a
per
|
Discussion
P
a
per
|
Table 1.Annual statistics of near surface ozone for the MACC reanalysis (2003–2012) over the different European subregions. FGE and MNMB are expressed in %.
Region FGE MNMB R
BI 23 12 0.51
IP 25 14 0.72
FR 26 −2 0.73
ME 22 3 0.74
SC 27 −13 0.26
SME 24 2 0.74
MDc 24 20 0.71
MDm 21 −12 0.54
GMDD
8, 1077–1115, 2015Evaluation of near surface ozone over
Europe from the MACC reanalysis
E. Katragkou et al.
Title Page
Abstract Introduction
Conclusions References
Tables Figures
◭ ◮
◭ ◮
Back Close
Full Screen / Esc
Printer-friendly Version
Interactive Discussion
Discussion
P
a
per
|
Discussion
P
a
per
|
Discussion
P
a
per
|
Discussion
P
a
per
Table 2.Annual statistics of near surface ozone for the MACC reanalysis (MRE) and the control run (CTRL) over the different European subregions for the common period from 2003 to 2010. FGE and MNMB are expressed in %.
Region FGE MNMB R
MRE CTRL MRE CTRL MRE CTRL
BI 24 22 13 −7 0.51 0.59
IP 25 17 15 10 0.70 0.79
FR 28 22 0 −5 0.73 0.79
ME 24 31 4 −17 0.73 0.80
SC 27 40 −12 −35 0.23 0.39
SME 25 22 3 −5 0.73 0.78
MDc 29 43 26 42 0.71 0.74
MDm 21 19 −10 −12 0.49 0.74
GMDD
8, 1077–1115, 2015Evaluation of near surface ozone over
Europe from the MACC reanalysis
E. Katragkou et al.
Title Page
Abstract Introduction
Conclusions References
Tables Figures
◭ ◮
◭ ◮
Back Close
Full Screen / Esc
Printer-friendly Version
Interactive Discussion
Discussion
P
a
per
|
Discussion
P
a
per
|
Discussion
P
a
per
|
Discussion
P
a
per
|
GMDD
8, 1077–1115, 2015Evaluation of near surface ozone over
Europe from the MACC reanalysis
E. Katragkou et al.
Title Page
Abstract Introduction
Conclusions References
Tables Figures
◭ ◮
◭ ◮
Back Close
Full Screen / Esc
Printer-friendly Version
Interactive Discussion
Discussion
P
a
per
|
Discussion
P
a
per
|
Discussion
P
a
per
|
Discussion
P
a
per
|