Small Regulatory RNA-Induced Growth Rate
Heterogeneity of
Bacillus subtilis
Ruben A. T. Mars1, Pierre Nicolas2, Mariano Ciccolini1, Ewoud Reilman1,
Alexander Reder3, Marc Schaffer3, Ulrike Mäder3, Uwe Völker3, Jan Maarten van Dijl1*, Emma L. Denham1¤
1Department of Medical Microbiology, University of Groningen, University Medical Center Groningen, Groningen, the Netherlands,2INRA, UR1077, Mathématique Informatique et Génome, Jouy-en-Josas, France,3Interfaculty Institute for Genetics and Functional Genomics, Ernst-Moritz-Arndt-University Greifswald, Greifswald, Germany
¤ Current address: Division of Translational and Systems Medicine, Unit of Microbiology and Infection, Warwick Medical School, University of Warwick, Coventry, United Kingdom
*j.m.van.dijl01@umcg.nl
Abstract
Isogenic bacterial populations can consist of cells displaying heterogeneous physiological traits. Small regulatory RNAs (sRNAs) could affect this heterogeneity since they act by fine-tuning mRNA or protein levels to coordinate the appropriate cellular behavior. Here we show that the sRNA RnaC/S1022 from the Gram-positive bacteriumBacillus subtiliscan suppress exponential growth by modulation of the transcriptional regulator AbrB. Specifical-ly, the post-transcriptionalabrB-RnaC/S1022 interaction allowsB.subtilisto increase the cell-to-cell variation in AbrB protein levels, despite strong negative autoregulation of the
abrBpromoter. This behavior is consistent with existing mathematical models of sRNA ac-tion, thus suggesting that induction of protein expression noise could be a new general as-pect of sRNA regulation. Importantly, we show that the sRNA-induced diversity in AbrB levels generates heterogeneity in growth rates during the exponential growth phase. Based on these findings, we hypothesize that the resulting subpopulations of fast- and slow-grow-ingB.subtiliscells reflect a bet-hedging strategy for enhanced survival of
unfavorable conditions.
Author Summary
Bacterial cells that share the same genetic information can display very different pheno-types, even if they grow under identical conditions. Despite the relevance of this popula-tion heterogeneity for processes like drug resistance and development, the molecular players that induce heterogenic phenotypes are often not known. Here we report that in the Gram-positive model bacteriumBacillus subtilisa small regulatory RNA (sRNA) can induce heterogeneity in growth rates by increasing cell-to-cell variation in the levels of the transcriptional regulator AbrB, which is important for rapid growth. Remarkably, the ob-served variation in AbrB levels is induced post-transcriptionally because of AbrB’s
OPEN ACCESS
Citation:Mars RAT, Nicolas P, Ciccolini M, Reilman E, Reder A, Schaffer M, et al. (2015) Small Regulatory RNA-Induced Growth Rate Heterogeneity ofBacillus subtilis. PLoS Genet 11(3): e1005046. doi:10.1371/journal.pgen.1005046
Editor:Daniel B. Kearns, Indiana University, UNITED STATES
Received:July 28, 2014
Accepted:February 1, 2015
Published:March 19, 2015
Copyright:© 2015 Mars et al. This is an open access article distributed under the terms of the
Creative Commons Attribution License, which permits unrestricted use, distribution, and reproduction in any medium, provided the original author and source are credited.
Data Availability Statement:All relevant data are within the paper and its Supporting Information files.
negative autoregulation, and is not observed at theabrBpromoter level. We show that our observations are consistent with mathematical models of sRNA action, thus suggesting that induction of protein expression noise could be a new general aspect of sRNA regula-tion. Since a low growth rate can be beneficial for cellular survival, we propose that the ob-served subpopulations of fast- and slow-growingB.subtiliscells reflect a bet-hedging strategy for enhanced survival of unfavorable conditions.
Introduction
In their natural habitats, bacteria constantly adapt to changing environmental conditions while simultaneously anticipating further disturbances. To efficiently cope with these changes, intri-cate interlinked metabolic and genetic regulation has evolved [1]. This complex regulatory net-work includes the action of small regulatory RNAs (sRNAs) [2]. sRNAs are a widespread means for bacterial cells to coordinate (stress) responses by fine-tuning levels of mRNAs or proteins, and they have been studied in great detail in Gram-negative bacteria [3]. Regulation by some sRNAs takes place by short complementary base pairing to their target mRNA mole-cules, for instance in the region of the ribosome-binding site (RBS) to inhibit translation or trigger mRNA degradation. In Gram-negative bacteria many of these sRNA-mRNA interac-tions are mediated by the RNA chaperone Hfq [4]. However, the Hfq homologue in the Gram-positive model bacteriumBacillus subtilishas no effect on the regulation of the eight sRNA tar-gets reported in this species so far [5–7]. Owing to the complexity of sRNA regulation, only a relatively small number of studies have focused specifically on the physiological necessity of sRNA-target interactions. This is again particularly true for Gram-positive bacteria, such asB.
subtilis, despite the fact that many potential sRNAs have been identified [8,9].
Within a bacterial population, genes and proteins can be expressed with a large variability, with high expression levels in some cells and low expression levels in others [10]. Examples of expression heterogeneity inB.subtilisare the extensively studied development of natural com-petence for DNA binding and uptake and the differentiation into spores [11–13]. In both cases, expression heterogeneity is generated by positive feedback loops, and results in bistable or ON-OFF expression of crucial regulators [14]. Distinctly from bistability, proteins can also be ex-pressed with large cell-to-cell variability. This variation in expression levels, or noise, can origi-nate from intrinsic or extrinsic sources [15,16]. Extrinsic noise is related to cell-to-cell
fluctuations in numbers of RNA polymerase, numbers of genome copies, or numbers of free ri-bosomes. Conversely, intrinsic noise is caused by factors directly involved in the transcription or translation of the respective gene or protein. Interestingly, particularly noisy genes are often found to be regulators of development and bacterial persistence [12,17,18]. Because of the im-portance of noise in protein expression, cells have evolved mechanisms to regulate the noise levels of at least some proteins [10]. Reducing noise levels has been suggested as an important explanation why many transcriptional regulators in bacteria (40% inE.coli[19]) autorepress the transcription of their own promoter (i.e. negative autoregulation (NAR)).
AbrB is a global transcriptional regulator in Gram-positive bacteria, including the important human pathogensBacillus anthracisandListeria monocytogenes[20,21].B.subtilisAbrB posi-tively regulates some genes when carbon catabolite repression (CCR) is relieved [22], and nega-tively regulates the expression of over two hundred genes in the exponential growth phase [23]. Transcription ofabrBis negatively autoregulated by binding of AbrB tetramers to theabrB
promoter [24,25]. Upon entry into stationary phase,abrBtranscription is repressed via in-creasing levels of Spo0A-P and AbrB is inactivated by AbbA [26,27]. The resulting AbrB
Small Regulatory RNA-Induced Growth Rate Heterogeneity ofB. subtilis
collection and analysis, decision to publish, or preparation of the manuscript.
depletion is consequently followed by activation of AbrB repressed genes, which are often im-portant for stationary phase processes. Notably, because of its role in the elaborate sporulation and competence decision making network [26,27], AbrB has mainly been studied in the con-text of entry into stationary phase while much less is known about its exact role in the exponen-tial growth phase.
We selected putative sRNAs from a rich tiling array dataset of 1583 potentially regulatory RNAs [9]. This selection was made for evolutionary conserved putative sRNAs with a high ex-pression level on defined minimal medium. Deletion strains of these putativeB.subtilissRNAs were subsequently tested for growth phenotypes. One sRNA—RnaC/S1022—stood out since the mutant strain displayed a strongly increased final optical density on minimal medium with sucrose as the sole carbon source. The present study was therefore aimed at determining how RnaC/S1022 influences the growth ofB.subtilis. Inspection of consistently observed predicted RnaC/S1022 targets indicated that the aberrant growth phenotype could relate to elevated AbrB levels. Here we show that, under certain conditions,B.subtilisemploys RnaC/S1022 to post-transcriptionally modulate AbrB protein expression noise. The observed noise in AbrB protein levels is remarkable, because theabrBgene displays low transcriptional noise consistent with its NAR. Importantly, the sRNA-induced noise in the AbrB protein levels generates growth rate heterogeneity in the exponential phase.
Results
RnaC/S1022 deletion enhances growth on minimal medium
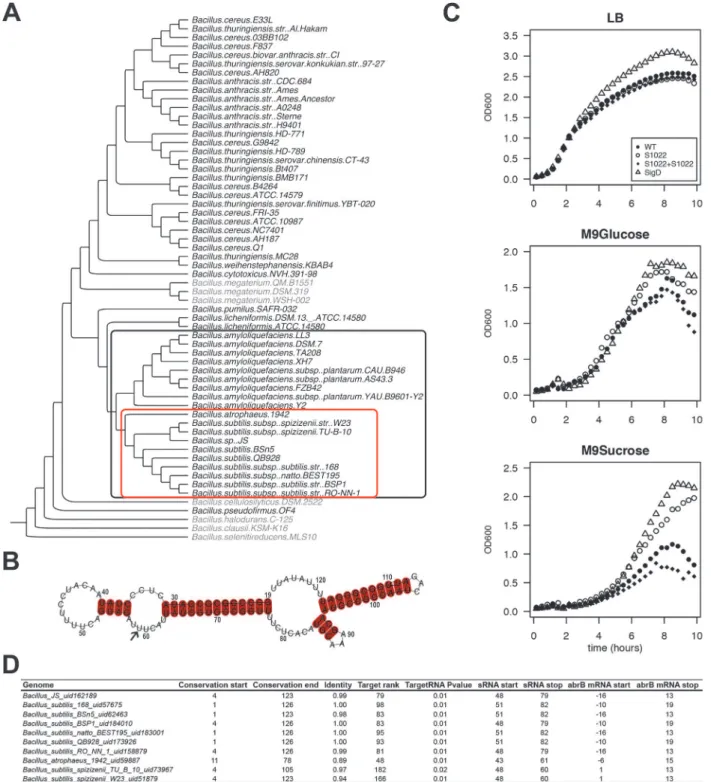
RnaC/S1022 was first identified in a systematic screening ofB.subtilisintergenic regions with an oligonucleotide microarray [28]. RnaC/S1022 is located in betweenyrhK, a gene of un-known function, andcypB, encoding cytochrome P450 NADPH-cytochrome P450 reductase (also known asyrhJ). We tested the conservation of theB.subtilisRnaC/S1022 sequence with BLAST analysis against a set of 62Bacillusgenomes, and found evolutionary conservation in a clade of the phylogenetic tree including 19B.subtilis,Bacillus atrophaeus, andBacillus amyloli-quefaciensgenomes (Fig. 1AandS1 Fig.for extensive alignments). Within these 19 genomes, the 5’and 3’ends of the RnaC/S1022 sequence are conserved, but the core sequence is dis-rupted in all 9B.amyloliquefaciensgenomes (S1 Fig.). Notably, the RnaC/S1022 fromB. atro-pheus1942 seems to represent an in-between form of RnaC/S1022 that mostly resembles the RnaC/S1022 sequences from theB.amyloliquefacienssp. genomes. Therefore, an alignment of only the RnaC/S1022 sequences from the 9 remainingB.subtilisgenomes was used to predict the RnaC/S1022 secondary structure using the LocARNA tool [29] (Fig. 1B,S1 Fig.). These analyses predict RnaC/S1022 to fold into a stable structure with a Gibbs free energy for the se-quence shown inFig. 1Bof−38.5 kcal/mol, as calculated with RNAfold [30].
Fig 1. The RnaC/S1022 growth phenotype is linked to the evolutionary target prediction ofabrB.A) Phylogenetic tree ofBacillusgenomes. The tree was constructed based on an alignment ofrpoB(present in 60 of the 62 genomes; except for twoBacillus coagulansgenomes for which no significantrpoB nBLAST hits were found). The outer (black) box indicates 19 genomes in which RnaC/S1022 is present. The inner (red) box indicates 10 genomes in which the predicted RnaC/S1022-abrBinteraction is consistently observed. A significant nBLAST hit for AbrB was not obtained for the species shaded in grey. B) LocARNA structural conservation alignment of RnaC/S1022 based on the sequence published by Schmalisch et al. [28]. The alignment includes RnaC/ S1022 sequences from genomes in which the RnaC/S1022-abrBinteraction is consistently observed (marked in the red box in panel A), except the RnaC/ S1022 fromB.atrophaeus(see alsoS1 Fig.). Numbers indicate the coordinates of S1022 defined by Nicolas et al. [9]. The arrow highlights the uracil base that is required for the interaction withabrB. C) Growth curves of parental strain 168trp+,ΔRnaC/S1022,ΔsigD, and theΔRnaC/S1022amyE::RnaC/S1022 complemented strain grown on LB, M9G or M9S. Each experiment was repeated at least three times in 96-well plates and shake flasks. Averages from triplicates from a representative 96-well plate experiment are shown. The OD600was monitored every 10 min. One in two time-points were plotted. D)
our observations suggest that in some conditions the increased final OD of theΔsigDstrain is partly due to deregulation of RnaC/S1022.
AbrB is a consistently predicted target of RnaC/S1022
We wondered whether deregulation of an sRNA target was responsible for the remarkable growth phenotype observed for theΔRnaC/S1022 mutant and decided to perform exploratory target predictions using TargetRNA [32]. Predicting sRNA targets can be successful, but target verification is complicated by the large number of false-positively predicted targets. We argued that additional information about the likelihood of a true target could be obtained by determin-ing whether the predicted interaction is conserved over evolutionary time. To identify pre-dicted RnaC/S1022-target interactions that are conserved, a bioinformatics pipeline was established that predicts sRNA targets in genomes in which the RnaC/S1022 sequence is con-served. Since we were interested in finding trueB.subtilissRNA targets, we only considered targets also predicted inB.subtilis, and these are listed inS1 Table. This analysis reduced the number of considered RnaC/S1022 targets to 47 (from 147 predicted targets for TargetRNA_v1 predictions with P value0.01 on theB.subtilis168 genome). These 47 predicted targets in-cluded seven sporulation-related genes (phrA,spoVAD,spoIIM,spoIIIAG,cotO,sspG,spsI). The sigma factorsigMwas also consistently predicted but, since asigMmutant strain only dis-plays a growth phenotype under conditions of high salinity [33], this seemed unrelated to the observed growth phenotype of theΔRnaC/S1022 mutant on M9 medium. In addition, two con-sistently predicted targets are involved in cell division (racAandftsW), but we observed no spe-cific cell-division abnormalities of theΔRnaC/S1022 strain by live-imaging microscopy. Furthermore, the TCA cycle genescitBandcitZwere predicted targets and tested by Western blot analysis, but no deregulation was observed. The last consistently predicted target of initial interest was the gene for the transition state regulator AbrB (Fig. 1D). Reviewing the literature onabrBpointed us to an interesting observation where aspo0Amutant was reported to display increased growth rates on media similar to our M9 medium [22]. Furthermore, it had been re-ported that AbrB has an additional role in modulating the expression of some genes during slow growth in suboptimal environments [34], which we argued could also be relevant to the M9S growth condition. SinceabrBis a consistently predicted target of RnaC/S1022 (Fig. 1D), we checked whether the presence of this sRNA coincides with the presence of theabrBgene. Indeed,abrBis conserved in 53 out of 62 availableBacillusgenomes, and RnaC/S1022 is pres-ent in 19 of these 53 genomes (Fig. 1A). In addition, we identified no genomes that contain RnaC/1022 but lack theabrBgene (Fig. 1A). Accordingly, we hypothesized that RnaC/S1022 might be a regulator of AbrB.
AbrB levels are elevated in an RnaC/S1022 mutant
The combined clues from bioinformatics analyses and literature suggested that the growth phe-notype of theΔRnaC/S1022 mutant could relate to elevated AbrB levels. To test whether AbrB levels are indeed altered in this mutant, we performed Western blot and Northern blot analy-ses. This indeed revealed a strong trend towards higher AbrB protein and mRNA levels in the
base of the RnaC/S1022 sequence as defined by Nicolas et al. [9] where the significant nBLAST hit starts.“Conservation end”, end coordinate of the significant nBLAST hit.“Identity”, fraction of identity of the conserved RnaC/S1022 sequence compared to RnaC/S1022 ofB.subtilis168.“Target Rank”the ranking of theabrBtarget in the predicted RnaC/S1022 targets for the respective genome.“TargetRNA P value”TargetRNA_v1 prediction P-value. “sRNA_start”, start coordinate of RnaC/S1022 homologue in the predicted target interaction.“sRNA_stop”, end coordinate of RnaC/S1022 homologue in the predicted target interaction.“abrBmRNA_start”, start coordinate ofabrBin the predicted target interaction relative to its start codon.“abrBmRNA_stop”, end coordinate ofabrBin the predicted target interaction relative to its start codon.
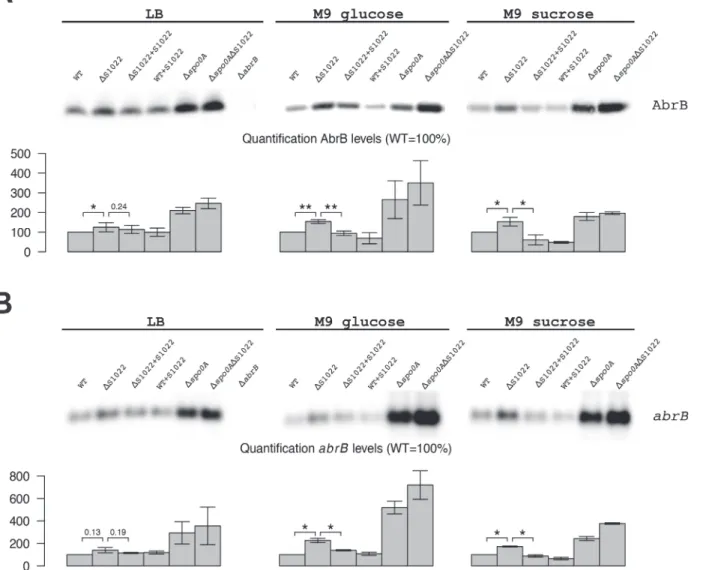
RnaC/S1022 mutant and for cells grown in M9G or M9S this effect was statistically significant (Fig. 2). Importantly, the growth phenotype as well as AbrB protein and mRNA levels returned to wild-type (wt) by ectopic expression of RnaC/S1022 under control of its native promoter from theamyElocus (Fig. 1Cand2). We also tested the effects of aΔspo0Amutation by West-ern and NorthWest-ern blot analyses. Interestingly, the combined deletion of RnaC/S1022 and
spoOAseemed to lead to a further increase in the AbrB protein and mRNA levels compared to the already elevated levels in thespo0Amutant background. Lastly, we observed a three-fold re-duced natural competence of theΔRnaC/S1022 mutant, which is expected when the AbrB lev-els are elevated [35] (S3 Fig.).
Fig 2. AbrB levels are dependent on the presence of RnaC/S1022.A) AbrB Western blot analysis. The position of AbrB is indicated. The bar diagrams show the relative AbrB levels, with the level in the parental strain (wt) set at 100%. All AbrB levels were corrected for the internal control protein BdbD. Error bars represent the standard deviation between triplicate experiments. The effect of RnaC/S1022 absence is most pronounced in cells grown on M9G and M9S, which corresponds to higher expression levels under these growth conditions. Statistical data analyis was performed with a one-sided Welch two-sample t-test (H1: AbrB/abrBlevels inΔRnaC/S1022>than in the parental strain and the RnaC/S1022 complementation strain). The respective p-values are
either indicated, or marked with asterisks (*p-value<0.05;**p-value<0.01). B)abrBNorthern blot analysis. Equal amounts of RNA were loaded in each lane. The bar diagrams show the relativeabrBmRNA levels, with the level in the parental strain (wt) set at 100%. Quantifications are based on minimally two independent experiments. Error bars represent the standard deviation between experiments. Data was analyzed for significance as in A.
doi:10.1371/journal.pgen.1005046.g002
To test whether the AbrB levels were directly dependent on RnaC/S1022 levels, we placed the RnaC/S1022 complementation cassette in theamyElocus of the parental strain and used Western and Northern blotting to measure AbrB protein and mRNA levels. These analyses showed a trend towards reduction of both the AbrB protein and mRNA levels in cells grown on M9G and M9S, which would be consistent with elevated RnaC/S1022 expression and in-creasedabrBregulation (Fig. 2). Since the amount of AbrB was apparently correlated to the amount of RnaC/S1022, this suggested a stoichiometric relationship between these
two molecules.
Before testing whether there could be a direct interaction between RnaC/S1022 and the
abrBmRNA, we decided to investigate the fate of theabrBmRNA in the presence or absence of RnaC/S1022. For this purpose, we assayed the levels of theabrBmRNA at different time points after blocking transcription initiation with rifampicin in the RnaC/S1022 mutant strain and in the strain with two chromosomal copies of RnaC/S1022. This analysis showed that the
abrBmRNA level decreased significantly faster in the presence of RnaC/S1022 than in its ab-sence (S4 Fig.). In case of a direct interaction between RnaC/S1022 and theabrBmRNA, the observed difference could relate to an RnaC/S1022-triggered degradation of theabrBmRNA. Alternatively, this difference could be due to an RnaC/S1022-precluded protection of theabrB
mRNA by elongating ribosomes [36].
The RnaC/S1022 sRNA regulates AbrB by a direct sRNA-mRNA
interaction
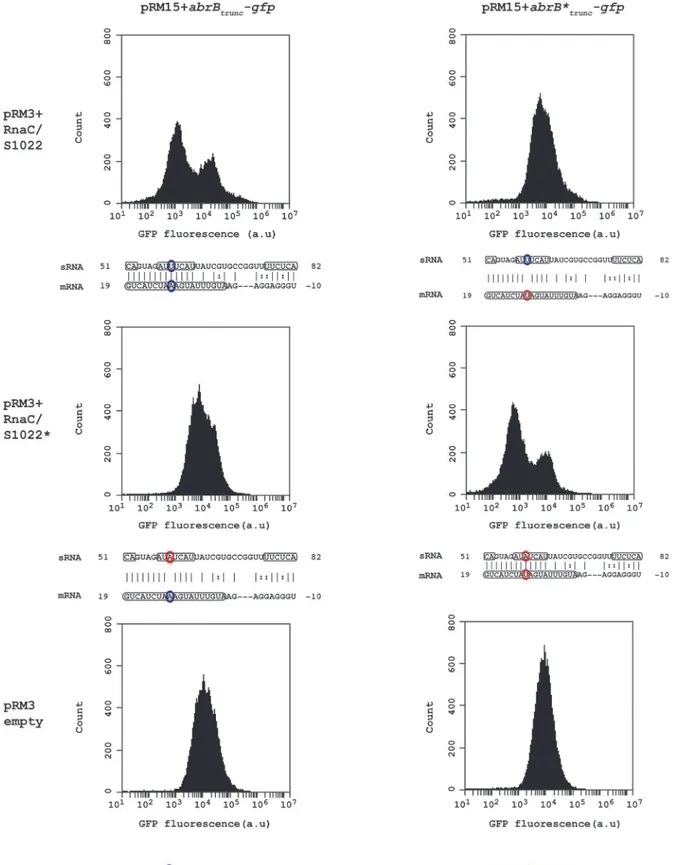
The apparently stoichiometric relationship between AbrB and the sRNA RnaC/S1022 is sug-gestive of a direct sRNA—target interaction. The predicted interaction region inB.subtilis168 spans a region from the RBS ofabrB(-10) until 19 bp after the start of theabrBORF of which the strongest consecutive stretch of predicted base-pair interactions are present from +7 bp till +19 bp (left top panel inFig. 3). In addition, only this region within theabrB-encoding se-quence is part of the conserved predicted interaction region inB.atrophaeusandB.subtilis spi-zinenzii(Fig. 1D). It has been reported that loop-exposed bases of sRNAs are more often responsible for regulation than bases in stems [37]. Two predicted loop regions of RnaC/S1022 are complementary with the predictedabrBinteraction region (one of two basepairs and one of seven basepairs; bases 51–52 and 57–63 inFig. 1Band3). We therefore decided to introduce a point-mutation by a U to A substitution in the predicted 7-bp loop of RnaC/S1022 encoded by plasmid pRM3 and a compensatory mutation in a plasmid pRM15-borne truncated abrB-gfpreporter construct (abrBtrunc-gfp). Strains containing different combinations of the respec-tive plasmids were grown on M9G and assayed by Flow Cytometry (FC) in the exponential growth phase. Cells containing one of theabrBtrunc-gfpconstructs in combination with the empty pRM3 plasmid displayed a unimodal distribution in GFP levels (Fig. 3, lower panels). However, when the wtabrBtrunc-gfpwas assayed in combination with the wt RnaC/S1022, a bi-modal distribution in AbrBtrunc-GFP levels was observed, including a new peak of lowered
fluorescence intensity (Fig. 3, top left). Interestingly, a unimodal fluorescence distribution was found when the wtabrBtrunc-gfpconstruct was combined with point-mutated RnaC/S1022
(Fig. 3, middle left) or the mutatedabrBtrunc-gfpwith the wt RnaC/S1022 (Fig. 3, top right). In
the case of the point-mutatedabrB
-gfpconstruct, however, a bimodal fluorescence distribu-tion was only observed when this construct was combined with the mutated RnaC/S1022
(Fig. 3, middle right). This implies that a direct mRNA-sRNA interaction takes place between
Fig 3. RnaC/S1022 regulatesabrBby a direct mRNA-sRNA interaction.Wild-type and base pair-substituted (marked with asterix*)abrBtrunc-gfp
constructs were expressed from plasmid pRM15 and combined with one of three variants of the pRM3 plasmid (pRM3+RnaC/S1022, pRM3+RnaC/S1022*, pRM3 empty). All combinations of these constructs were assayed by FC and one representative histogram per combination is shown. Base-pairs high-lighted in identical color indicate the possibility for regulation due to base-pairing, while bases highhigh-lighted in two different colors indicate an inability for
RnaC/S1022 sRNA is condition-dependently expressed
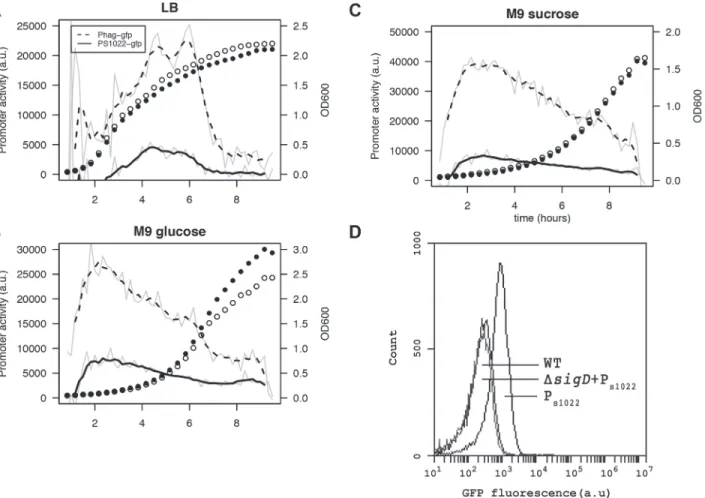
Studying the condition-dependency of sRNA expression can give clues to its function and tar-gets. To obtain high-resolution expression profiles, we constructed an integrative RnaC/S1022 promoter-gfpfusion [38]. As expected, the presence of this PRnaC/S1022-gfpfusion caused GFP
fluorescence in wild-type cells, but not in cells with asigDmutation (Fig. 4D). Next, a live cell array approach was used to compare the PRnaC/S1022-gfpactivity with that of another
SigD-de-pendent promoter, Phag, which drives flagellin expression. These promoter fusion strains re-vealed that the expression ofhagwas consistently*4 fold higher than that of RnaC/S1022 (Fig. 4), which is in agreement with previously published expression data [9]. On LB medium, the expression of both RnaC/S1022 andhagpeaked in the late exponential and transition phase, while on both tested minimal media the peak in expression occurred in early exponen-tial phase (Fig. 4). This higher RnaC/S1022 expression level in the exponential phase on M9 relative to that in LB is in concordance with the stronger effect ofΔRnaC/S1022 on AbrB levels, as indicated by the Northern and Western blot analyses.
The RnaC/S1022 sRNA modulates protein expression noise of
AbrB-GFP
Experimental methods that measure average protein levels in a population obscure possible cell-to-cell variation. To further study the cell-to-cell variation of AbrB-GFP in the exponential growth phase (as observed inFig. 3), we therefore employed a full-length translationalabrB
-gfpmut3 fusion that was integrated into the chromosome via single cross-over (Campbell-type) recombination. Specifically, this integration resulted in a duplication ofabrBwhere one full-length copy ofabrBwas expressed from its own promoter and fused in-frame togfp, while the downstreamabrBcopy was truncated lacking the start codon required for translation [39]. In this AbrB-GFP strain all AbrB monomers have a C-terminally attached GFP molecule. While AbrB-GFP still localized to the nucleoid (S5 Fig.), this AbrB-GFP strain displayed a somewhat reduced growth rate on media where AbrB is required for rapid growth. Since the translational
abrB-gfpfusion is chromosomally integrated at theabrBlocus, this system is insensitive to fluc-tuations in noise levels by plasmid copy number variation and its chromosomal location in the division cycle.
We first used the AbrB-GFP fusion to test whetherB.subtilisHfq might have an effect of the RnaC/1022-abrBinteraction. Consistent with previous studies on other sRNA targets ofB.
subtilis[5–7], the direct RnaC/S1022-abrBregulation was found to be independent of Hfq since comparable FC profiles for AbrB-GFP expression were obtained for the parental strain and thehfqdeletion mutant (S6 Fig.).
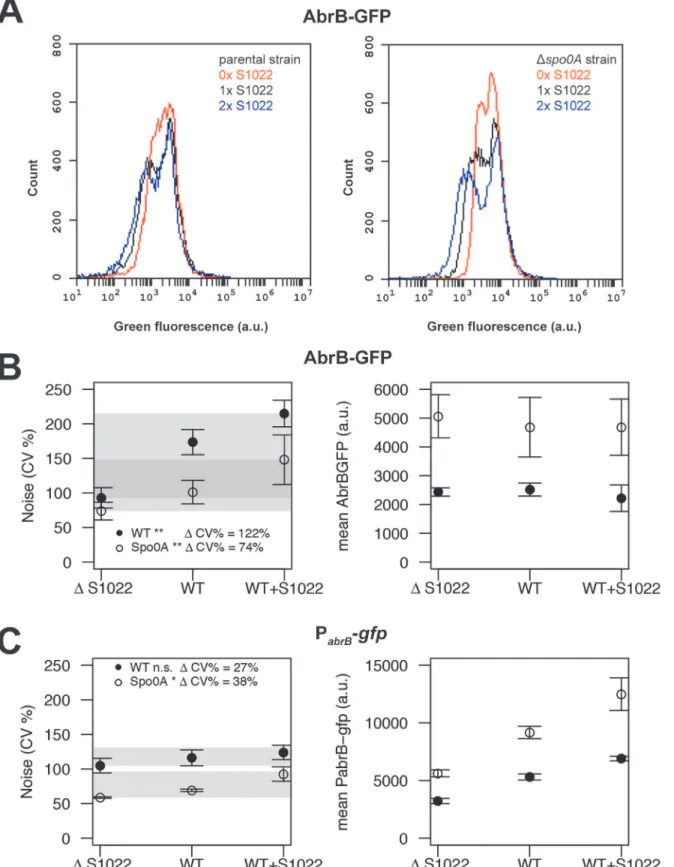
Next, we analyzed all AbrB-GFP strains by FC in the exponential phase on both LB and M9G. Noise measurements were not performed on M9S because of the strong growth differ-ence between the parental andΔRnaC/S1022 strains on this medium (Fig. 1C). We observed that the difference between cells expressing AbrB-GFP at the highest level and those at the low-est level was large (Fig. 5A). This means that AbrB-GFP is expressed with high noise (quanti-fied as the coefficient of variation; CV%). Interestingly, we observed lower AbrB-GFP noise in strains lacking RnaC/S1022 and, crucially, the presence of an additional genomic RnaC/S1022 copy further increased AbrB-GFP noise. Remarkably, increased RnaC/S1022 levels only
regulating due to the absence of base-pairing. Boxed regions in theabrBmRNA indicate the coding sequence, and boxed regions in the sRNA (RnaC/ S1022) indicate predicted exposed bases in the structure shown inFig. 1B. The base pair found to be essential for sRNA regulation corresponds to U59 in a predicted RnaC/S1022 loop region (RnaC/S1022*U59A) and the 11thbase in theabrB-encoding region (abrB
*A11U).
reduced the minimal expression level of the distribution while not affecting the maximum AbrB-GFP expression level (Fig. 5A), which is consistent with the data presented inFig. 3. There was a statistically significant positive linear correlation between RnaC/S1022 levels (0, 1 or 2 genomic copies) and AbrB-GFP noise (on LB for pooled data points fromΔspo0Aand pa-rental backgrounds R20.48, P-value<0.001, and M9G R20.43, P-value<0.001) (Fig. 5B).
Di-rect statistical comparisons between AbrB-GFP noise levels at different sRNA levels also revealed significant changes (Fig. 5). The noise increase therefore seems correlated to the level of RnaC/S1022. Notably, this relation was also observed for noise measurements in aspo0A de-letion background, even though the mean AbrB-GFP expression was between 1.37 and 2.32 fold (for LB and M9G respectively,μ= 1.79) higher inΔspo0Astrains. This suggests that
RnaC/S1022 has a specific role in noise modulation of AbrB-GFP.
RnaC/S1022 has no indirect effect on the abrB promoter and is
expressed homogeneously
After observing that RnaC/S1022 specifically increases AbrB-GFP expression noise, we aimed to elucidate the origin of this AbrB-GFP noise. Three possibilities for noise generation by an
Fig 4. RnaC/S1022 is condition-dependently expressed.Promoter activity of the PRnaC/S1022-gfpand Phag-gfpfusions in cells grown on LB (A), M9G (B),
and M9S (C). Promoter activities were computed by subtraction of GFP level from the previous time-point as described by Botella et al. [38]. The experiment was performed three times in triplicate. Average data from triplicate measurements of one representative experiment are shown. The grey line indicates mean data and the black line a smoothed version of this mean. One in two time-points were plotted for the growth curve as open circles for the Phag-gfpstrain
and closed circles for the PRnaC/S1022-gfpstrain. D) Representative FC results for PRnaC/S1022-gfpexpression in mid-exponentially growing cells with or
without asigDdeletion. The cells were grown in M9G. Wt,B.subtilis168 not expressing GFP.
doi:10.1371/journal.pgen.1005046.g004
sRNA are conceivable. Firstly RnaC/S1022 could have an additional indirect effect onabrB ex-pression, leading to noisy expression from theabrBpromoter and subsequent propagation of this noise to the AbrB protein level. Secondly, RnaC/S1022 may itself be expressed either in bi-modal fashion or with high noise. The third possibility would be an AbrB-dependent repres-sion of the RnaC/S1022 promoter and subsequent represrepres-sion of AbrB protein levels by RnaC/ S1022. This double negative repression would correspond to positive feedback on the AbrB protein level, and positive feedback is a known source of expression heterogeneity [40].
To study the distribution of theabrBpromoter, we integrated the pBaSysBioII plasmid [38] directly behind the Spo0A binding site in the promoter region ofabrB[41], resulting in a sin-gle-copy promoter fusion at the native genomic locus (PabrB; -41bp of theabrBstart codon). This location was selected to include the effect of AbrB autorepression and Spo0A(-P) repres-sion, while excluding RnaC/S1022 regulation. We observed no bimodal or particularly noisy expression of thisabrBpromoter fusion, showing that transcription from theabrBpromoter is homogeneous in the exponential phase (Fig. 5C). Of note, bimodal or noisy expression of PabrB would have been surprising since transcription ofabrBis autorepressed and it is generally found that this NAR reduces the noise of promoter expression [42,43]. Interestingly, the ex-pression from theabrBpromoter rises with increasing levels of RnaC/S1022. This observation can be explained by AbrB autorepression and noise. There are more cells with low AbrB levels when the levels of RnaC/S1022 are increased. On average, this will lead to lowered repression of theabrBpromoter, leading to a higher level of expression (but not more noise) from the
abrBpromoter (Fig. 5C). This higher expression from theabrBpromoter is apparently com-pensated for at the protein level by the elevated regulation of RnaC/S1022 (Fig. 2and5B). Since we observed only a slight increase inabrBpromoter noise specific to RnaC/S1022 (Fig. 5C), the hypothesis that AbrB-GFP noise promotion originates from an additional effect of RnaC/S1022 on theabrBpromoter can be rejected.
A second possibility of noise promotion by RnaC/S1022 is that it is itself expressed with large noise similar to the SigD-dependenthaggene [44]. In this case, large cell-to-cell variation in sRNA levels would only lead to regulation in cells that have above-threshold sRNA levels, and this could generate the variation in AbrB-GFP levels. We tested this at the promoter level by FC analysis of the integrative RnaC/S1022 promoter-gfpfusion (PRnaC/S1022;Fig. 4) and
found this promoter fusion to be homogenously expressed with a tight distribution of GFP lev-els (CV% of 64% for the M9G condition;Fig. 4D). Furthermore, we argued that the relatively low expression of PRnaC/S1022could result in threshold-level regulation where the sRNA is only
involved in regulatingabrBin cells with above-threshold levels of RnaC/S1022. However, this is not consistent with the observation of further increased noise levels in cells with two genomic copies of RnaC/S1022 (Fig. 5B). We therefore consider the possibility of AbrB noise promotion via heterogeneous expression of RnaC/S1022 unlikely. It cannot be excluded, however, that variation in the levels of RnaC/S1022 might be introduced further downstream, for instance via mRNA degradation, or via regulation by a dedicated RNA chaperone.
Δspo0Amutation. Please note the increase in the width of the distribution with increasing RnaC/S1022 gene dosage. B) Quantification of AbrB-GFP noise (left panel) and mean expression data (right panel) from three independent experiments with cells grown on M9G. Shaded areas indicate the noise increase (ΔCV%) from 0 to 2 sRNA copies in thespo0A-proficient background (wt) and theΔspo0Amutant background. Statistical significance of the comparisons of data obtained forspo0A-proficient or -deficient strains containing 0 to 2 sRNA copies are indicated with asterisks in the legend (*p-value<0.05;**p-value <0.01; ANOVA with Tukey HSD test). Error bars represent the standard deviation. C) Quantification of PabrB-gfpnoise (left panel) and mean PabrB-gfpactivity
data (right panel) from three independent experiments with cells grown on M9G. Statistical significance of the comparisons of data obtained for spo0A-proficient or -deficient strains containing 0 to 2 sRNA copies are indicated with asterisks in the legend (*p-value<0.05; n.s. means not significant; ANOVA
with Tukey HSD test). Error bars represent the standard deviation.
doi:10.1371/journal.pgen.1005046.g005
The third option would be a double-negative feedback loop consisting of sRNA repression of AbrB levels and AbrB repression of sRNA levels, which would ultimately lead to an increase in AbrB protein expression noise. This would thus depend on repression of the RnaC/S1022 promoter by AbrB, in addition to the confirmed negative regulation ofabrBby RnaC/S1022. Together this would lead to a decrease in AbrB protein levels in cells that start with below-threshold AbrB levels. First of all, we found no indication for AbrB binding sites in the region upstream of RnaC/S1022 in the dataset of Chumsakul et al., where the binding sites of AbrB were mapped genome-wide [24]. To test whether the RnaC/S1022 promoter is indeed not di-rectly controlled by AbrB, or possibly under indirect control of AbrB, we deleted theabrBgene from the above-mentioned PRnaC/S1022promoter fusion strain. As expected, the RnaC/S1022
promoter activity levels were not detectably affected by theabrBdeletion (S7 Fig.), showing that it is unlikely that there is a negative feedback loop consisting of AbrB-dependent RnaC/ S1022 repression and RnaC/S1022-dependentabrBrepression.
sRNA-induced protein expression noise is consistent with mathematical
models of sRNA regulation
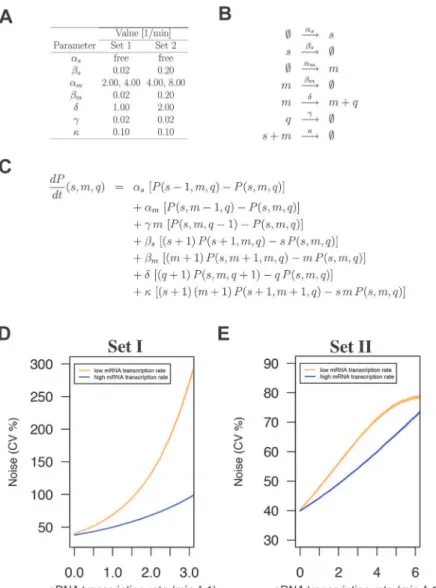
Since the experimental data presented above pointed to a direct role of the RnaC/S1022 sRNA in AbrB protein noise promotion, we wondered whether this possibility is consistent with mathematical models of sRNA regulation. To verify this, we considered a simple model of RNA regulation with two independently transcribed RNA species (sRNA and mRNA) [45–47]. In this model, these molecules are synthesized with constant transcription ratesαsandαm,
re-spectively. Translation of mRNA into proteinQ, and the degradation of sRNA, mRNA, and protein molecules were modeled as linear processes that occur with ratesδ.βs,βm, andγ,
re-spectively. The sRNA-mRNA duplex formation was assumed to be an irreversible second-order process that occurs with a rateκ. In the model, molecules in the sRNA-mRNA duplex were removed from the dynamical system. A summary of all reactions and the master equation used in the model can be found inFig. 6.
We first implemented model parameters used in an earlier sRNA modeling study by Jia et al. [47] (Set I;Fig. 6A and D). Of note, these parameters were essentially the same as those of Levine et al. [45]. In all cases the sRNA transcription rate (αs) was a free variable to capture the effect of 0, 1, or 2 genomic copies of RnaC/S1022. In addition, for each set of parameters we in-cluded two possibleαmvalues to model the effect in the Spo0A deletion strain where theabrB
transcription rate (αm) is approximately two-fold higher than in the parental strain (as
deter-mined with PabrB-gfp). Varying extrinsic noise in theabrBtranscription rate had no effect on
the general modeling outcome (S8 Fig.) and the intermediateαmCV% level of 40% was
select-ed for plots in the main text. After running the model with parameters from Set I, we observselect-ed that model-predicted protein noise strongly increased with increasingαs. This trend of
increas-ing protein noise with increasincreas-ing sRNA transcription rates was similar to what we observed for the genomic AbrB-GFP fusion (Fig. 5A and B). Importantly, doublingαm(two-fold higher
mRNA transcription rate) resulted in a more gradual noise increase with increasingαs, just as was observed in theΔspo0Amutant with the AbrB-GFP fusion (Fig. 5).
We next sought to determine the effect of changing modeling parameters on the modeling outcome, because the selected mRNA half-life of*35 min (βm0.02) in parameter Set I would
only be relevant for a subset of mRNA molecules as shown experimentally by Hambraeus et al. [48] (with a relation between these of mean lifetime fromFig. 6Aln 2 = half-life). We therefore
to 2 synthesized proteins per minute. Although the maximum noise level from these Set II simu-lations was markedly different, it again clearly showed the trend of increasing protein noise with increasing sRNA transcription rates. We can therefore conclude that the modeling results robust-ly support the idea that sRNA regulation can generate noise at the protein level. This noise would be induced locally at the level of mRNA degradation or translation initiation, and the cor-responding fluctuations would subsequently be propagated to the protein level. Recently, the the-oretical background of this concept was also reported by Jost et al., who stated that such behavior is especially expected when the levels of the srRNA and the mRNA are approximately equal [49]. Altogether, our experimental data and the modeling approach are consistent with the view that RnaC/S1022 is an intrinsic noise generator for AbrB-GFP at the post-transcriptional level.
Fig 6. sRNA regulation increases protein expression noise in a stochastic simulation model.A) Noise-generating dynamics of sRNA regulation were simulated in a stochastic simulation model for two sets of parameters with two mRNA transcription rates and the sRNA transcription rate as a free parameter. B) Reactions considered in the model. C) Master equation used for the model. D) Modeling outcome for parameter Set I. E) Modeling outcome for parameter Set II. Note that modeling with both parameter sets predicts increased protein expression noise with increased sRNA transcription rates. In both cases this effect is buffered by a higher mRNA transcription rate as was observed for theΔspo0Amutant background (see Fig. 5B).
doi:10.1371/journal.pgen.1005046.g006
RnaC/S1022-induced AbrB expression noise generates diversity in
growth speeds in the exponential phase
After defining the experimental and theoretical framework for noise promotion by the RnaC/ S1022 sRNA, we wondered what the physiological relevance of this regulation might be. Since we and others (Fig. 1A; [22]) have reported an effect of AbrB levels on the growth ofB.subtilis, a growth-related function seemed obvious. We therefore tested whether AbrB levels are a direct determinant of growth rate and yield under the relevant conditions. To do this, we placed the
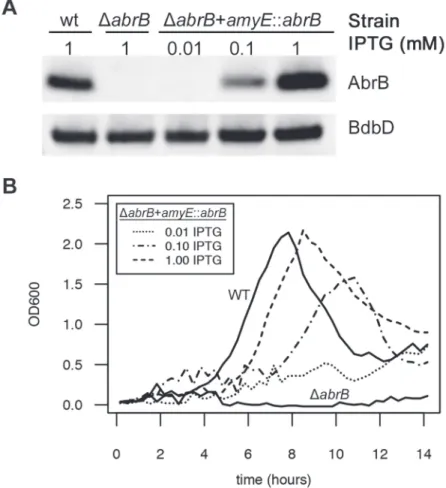
abrBgene under control of an isopropyl ß-D-1-thiogalactopyranoside (IPTG)-inducible pro-moter in theamyElocus using plasmid pDR111 [50], and subsequently deleted theabrBgene from its native locus in this strain. We first verified the IPTG-dependent expression of AbrB from this construct by growing the parental strain, theΔabrBstrain, and theΔabrB amyE::abrB
strain on LB medium and, in the case of theΔabrB amyE::abrBstrain, the medium was supple-mented with increasing IPTG concentrations. Subsequently, AbrB production was assessed by Western blot analysis (Fig. 7A), which showed that AbrB production in theΔabrB amyE::abrB
strain was indeed IPTG-dependent. Notably, theabrBmutant strain displays a growth pheno-type on LB medium, but this is only apparent in the late exponential growth phase [51]. To an-alyze the effect of differing AbrB levels on growth under conditions that are more relevant for the RnaC/S1022—abrBinteraction, we grew the same strains on M9G, which was supple-mented with differing amounts of IPTG for theΔabrB amyE::abrBstrain. As shown inFig. 7B, theabrBdeletion mutant did not grow in this medium. Importantly however, IPTG-induced expression ofabrBin this mutant repaired the growth phenotype in a dose-dependent manner. This shows that the AbrB levels determine the growth rate and yield when cells are cultured on M9G.
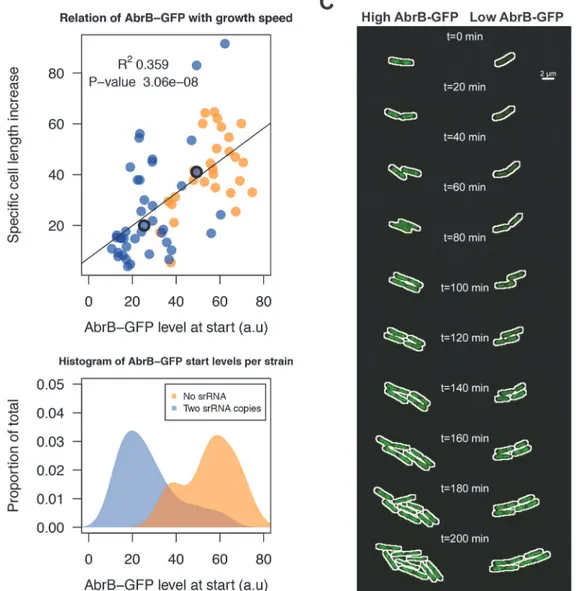
We next aimed to unravel the effect of sRNA-induced AbrB heterogeneity on growth. This requires the tracking of cells with low and high AbrB-GFP levels over time. To do this, we per-formed a live imaging experiment with theΔspo0AAbrB-GFP strain either containing zero sRNA copies due to theΔRnaC/S1022 mutation, or two genomic copies due to the insertion of an additional RnaC/S1022 copy inamyE. TheΔspo0Abackground was used to elevate AbrB-GFP levels and thereby to facilitate fluorescence measurements. Cells were pre-cultured in M9G as was done for the FC measurements and applied to agarose pads (at OD600*0.15) es-sentially as was described by Piersma et al. [52]. From these experiments, and consistent with FC data inFig. 5, it was apparent that there was a larger variation in AbrB-GFP levels in the strain with two genomic RnaC/S1022 copies, compared to the strain lacking RnaC/S1022 (Fig. 8B;S1 Movie). In addition, this variation in AbrB-GFP levels was correlated to the varia-tion in growth rates (quantified as the specific cell length increase) observed during the first 20 min of each live imaging run (Fig. 8A). We excluded the possibility that this growth rate differ-ence was dependent on the position on, or quality of the slide. Instead, it was solely linked to the cellular level of AbrB-GFP (Fig. 8C;S1 Movie).
Notably, in the two example cells fromFig. 8C(S1 Movie) AbrB-GFP levels gradually in-crease in the cell with a low start level (i.e. high level of sRNA repression), which would be consistent with a gradual reduction in RnaC/S1022 expression on this solid agarose medium (S9 Fig.). However, our experimental setting determines the effect of AbrB-GFP on growth be-fore this reduction in RnaC/S1022 becomes relevant (e.g. the first 5 pictures, or 20 min) (Fig. 8A). Beyond this, the increase in AbrB-GFP levels observed later (>150 min) in the live
show that the RnaC/S1022-induced heterogeneity in the AbrB-GFP expression levels generates diversity in growth rates within the exponential phase of growth.
Discussion
In this study we show thatB.subtilisemploys the RnaC/S1022 sRNA to post-transcriptionally regulate AbrB and that this regulation results in increased heterogeneity in growth rates during the exponential phase of growth. RnaC/S1022 is the third sRNA inB.subtilisfor which a direct target has been reported and this study reveals the value of evolutionary target predictions to identify true sRNA targets for this species.
The observed growth rate heterogeneity induced by RnaC/S1022 is conceivably of physio-logical relevance since slowly growing bacterial cells are generally less susceptible to antibiotics and other environmental insults than fast growing cells [53–55]. Specifically, it was noted for
hipstrains ofE.colithat slowly growing cells within a population will develop into persister cells when challenged with ampicillin [17]. Notably, in this system, the initial heterogeneity in growth rates was reported to be dependent on the HipAB toxin-antitoxin module [56].
Fig 7. AbrB levels determine the growth rate and growth yield on M9 minimal medium.A)
Representative Western blot data for AbrB production by the indicated strains grown on LB medium as a test for IPTG-dependent AbrB production from theamyE::abrBconstruct. At the lowest level of IPTG induction (0.01 mM), the AbrB production remained below the detection level. BdbD was used as a loading control. AbrB and BdbD were visualized with specific antibodies. B) Growth profiles on M9G determined for the strains from panel A. TheabrBmutant is unable to grow on this medium, but its growth defect is rescued by IPTG-induced AbrB expression from theamyE::abrBconstruct. Averages of triplicate measurements from one representative 96-well plate experiment are shown.
doi:10.1371/journal.pgen.1005046.g007
Analogously, it is conceivable that aB.subtilistoxin-antitoxin module under negative AbrB control could be responsible for the heterogeneity observed in the present study. Another per-haps more likely possibility is that low AbrB levels cause the premature activation of transition-or stationary phase genes, thereby slowing down growth and causing premature stationary phase entry. AbrB has also been implicated in the activation of some genes when CCR is re-lieved [22,23], and this could be related to the stronger growth phenotype observed on M9S compared to M9G. However, the AbrB level also determines growth rates on M9G (this study; [22]), when CCR is active and AbrB is not known to have an activating role [22].
The initially observed growth phenotype of theΔRnaC/S1022 mutant can be explained by the present observation that AbrB is an important determinant for growth on M9 medium,
Fig 8. RnaC/S1022-induced variation in AbrB-GFP levels leads to heterogeneity in growth rates.A) Tracing of growth and AbrB-GFP levels of 71 individual micro-colonies fromΔspo0AAbrB-GFP strains with either zero or two chromosomal copies of RnaC/S1022. Data originates from three independent experiments. Cell growth is expressed as the cell length (Feret’s diameter) increase per hour as determined in the first 20 min after spotting of the cells onto agarose slides. The plotted AbrB-GFP level is the average of fluorescence in the first and second picture. B) Distribution of AbrB-GFP start levels for both strains. Note that two genomic RnaC/S1022 copies lead to a wider distribution of AbrB-GFP levels. C) Montage of the two adjacent dividing cells from theS1 Movie. The white outline marks the contours of the cell. The positions of these cells in panel A are marked with anO. Individual cells were cropped for illustration purposes only.
and that RnaC/S1022 regulation of AbrB is specifically linked to increasing AbrB noise. Specifi-cally, the absence of RnaC/S1022 will reduce the number of cells expressing AbrB at a low level. Growth of theΔRnaC/S1022 population will therefore be more homogeneous and, when in-spected as an average, the population will enter stationary phase later than the parental strain. Beyond the mechanism of AbrB-mediated growth regulation, we show that noisy regulation of a growth regulator can also cause heterogeneity in growth rates. This suggests that the AbrB noise level has been fine-tuned in evolution, possibly as a bet-hedging strategy to deal with environmental insults.
Two other questions addressed by this study are the origin of AbrB expression noise, and the likely reason why this noise is generated at the post-transcriptional level. The origin of AbrB expression noise via triggering ofabrBmRNA degradation and/or inhibition ofabrB
translation fits the definition of an intrinsic noise source where the absence of RnaC/S1022 re-duces the number of sources for intrinsic noise by one, and therefore results in lower protein expression noise. This specific noise-generating capacity of sRNA regulation might be due to the specific kinetics of the RnaC/S1022-abrBmRNA interaction. It is currently unclear wheth-er this feature of sRNA-mediated regulation can be extended to othwheth-er sRNA-mRNA pairs. Spe-cifically, subtle consequences of sRNA regulation, such as noise generation, may have been overlooked in previous studies due to the use of plasmid-encoded translational fusions with fluorescent proteins expressed from strong non-native promoters as reporters. We therefore expressed all RnaC/S1022 and AbrB-GFP constructs from their native genomic location, from their native promoters, and assayed the effects in the relevant growth phase.
NAR of AbrB seems to be the answer to the second question why noise is generated post-transcriptionally and not at the promoter level. AbrB’s NAR is important for its functioning in the stationary phase sporulation network [26,27] and is therefore likely a constraint for evolu-tionary optimization of AbrB expression in the exponential phase, which is the growth phase addressed in this study. In turn, NAR is a clear constraint on noise generation since it is gener-ally believed to dampen noise [42,43]. Consistent with this view, we observed only a slight in-crease in PabrBpromoter noise upon increasing AbrB protein noise, suggesting that AbrB NAR is responsible for minimizing promoter noise. Besides reducing noise, NAR has been implicat-ed in decreasing the response time of a genetic circuit, linearizing the dose response of an in-ducer, and increasing the input dynamic range of a transcriptional circuit [19]. Individually, and in combination, these mechanistic aspects of NAR could explain why NAR is such a wide-spread phenomenon in transcriptional regulation. Besides this, the idea that AbrB and AbrB NAR are more widely conserved than RnaC/S1022 would be in line with the idea that AbrB ex-pression inB.subtilis168 has become fine-tuned by an additional regulator, which has evolved later in time. Lastly, on a more general note, the inconsistency between theabrBpromoter and AbrB protein noise measurements make it clear that it is premature to draw conclusions about homogeneity or heterogeneity of protein expression when only data is gathered at the promoter level, especially for genes under a NAR regime.
In conclusion, we have identified a novel direct sRNA target in the importantB.subtilis
transcriptional regulatorabrB. Specifically, we provide functionally and physiologically rele-vant explanations for the evolution of the noise-generation aspects of this regulation in gener-ating heterogeneity in growth rates. This noise is induced at the post-transcriptional level due to AbrB NAR. Based on our present observations, we hypothesize that the resulting subpopula-tions of fast- and slow-growingB.subtiliscells reflect a bet-hedging strategy for enhanced sur-vival of unfavorable conditions.
Materials and Methods
Bacterial strain construction
E.coliandB.subtilisstrains and plasmids used in this study are listed inS2 Tableand oligonu-cleotides inS3 Table.E.coliTG1 was used for all cloning procedures. AllB.subtilisstrains were based on thetrpC2-proficient parental strain 168 [1].B.subtilistransformations were per-formed as described previously [57]. The isogenic RnaC/S1022 mutant was constructed ac-cording to the method described by Tanaka et al. [58]. pRMC was derived from pXTC [59] by Circular Polymerase Extension Cloning (CPEC) [60] with primers ORM0054 and ORM0055 using pXTC as PCR template and ORM0056 to circularize this PCR fragment in the final CPEC reaction. In this manner, the xylose-inducible promoter of pXTC was replaced with the
AscI Ligation Independent Cloning (LIC; [61]) site from pMUTIN-GFP [39]. As a conse-quence, pRMC carries a cassette that can be integrated into theamyElocus via double cross-over recombination, allowing ectopic expression of genes in single copy from their native pro-moter. RnaC/S1022 was cloned in pRMC under control of its native promoter as identified by Schmalisch et al. [28], and the subsequent integration of RnaC/S1022 into theamyElocus via double cross-over recombination was confirmed by verifying the absence ofα-amylase activity on starch plates. The LIC plasmid pRM3+PwtRnaC/S1022, which is a derivative of plasmid
pHB201 [51], was used to express RnaC/S1022 under control of its native promoter. For IPTG-inducible expression ofabrB, theabrBgene was cloned into pDR111 [50], and subsequently placed in theamyElocus via homologous recombination. Deletion alleles were introduced into this and other strains by transformation with chromosomal DNA containing the respective mutations. The RnaC/S1022,hagandabrBpromotergfpfusions were constructed at the native chromosomal locus by single cross-over integration of the pBaSysBioII plasmid [38]. A mini-mum of three clones were checked to exclude possible multi-copy integration of the plasmid.
Media and growth conditions
Lysogeny Broth (LB) consisted of 1% tryptone, 0.5% yeast extract and 1% NaCl, pH 7.4. M9 medium supplemented with either 0.3% glucose (M9G) or 0.3% sucrose (M9S) was freshly pre-pared from separate stock solutions on the day of the experiment as previously described [9]. For live cell imaging experiments, the M9 medium was filtered through a 0.2μm Whatman
fil-ter (GE Healthcare). Strains were grown with vigorous agitation at 37°C in either Luria LB or M9 medium using an orbital shaker or a Biotek Synergy 2 plate reader at maximal shaking. Growth was recorded by optical density readings at 600 nm (OD600). For all growth
experi-ments, overnightB.subtiliscultures in LB with antibiotics were diluted>1:50 in fresh
pre-warmed LB medium and grown for approximately 2.5 hours. This served as the pre-culture for all experiments with cells grown on LB medium. For experiments with cells grown on M9 me-dium, the LB pre-culture was subsequently diluted 1:20 in pre-warmed M9 medium and incu-bated for approximately 2.5 hours, which corresponds to mid- or early exponential growth. This culture then served as the pre-culture for experiments with cells grown on M9 medium. When required, media forE.coliwere supplemented with ampicillin (100μg ml−1) or
chloram-phenicol (10μg ml−1); media forB.subtiliswere supplemented with phleomycin (4μg ml−1),
kanamycin (20μg ml−1), tetracyclin (5μg ml−1), chloramphenicol (10μg ml−1), erythromycin
(2μg ml−1), and spectinomycin (100μg ml−1) or combinations thereof.
Evolutionary conservation analysis of RnaC/S1022 targets
search (Blastn v2.2.26 with default parameters) was conducted with theB.subtilis168 RnaC/ S1022 sequence as identified in Nicolas et al. [9]. Genomes where a homologue of RnaC/S1022 (E-value<0.001) was found were then subjected to TargetRNA_v1 search with extended
set-tings around the 5’UTR (−75 bp; +50 bp around the start codon and additional command line arguments“-z 250 -y 2 -l 6”) using as query the sequence of the first high-scoring-pair of the first BLAST hit in that particular genome. A bidirectional best hit criterion (based on Blastp v2.2.26 with default parameters and E-value cut-off 0.001) was used to compare the predicted targets in each genome with the predicted targets in the referenceB.subtilis168 genome (Gen-bank: AL009126-3). The data was tabulated and subsetted forB.subtilis168 genes predicted for RnaC/S1022 in 8 or more genomes.
TheBacillaceaephylogenetic tree was computed based on an alignment of therpoBgene BLAST result from the same set of genomes mentioned above.RpoBwas reported to be a better determinant of evolutionary relatedness forBacillusspecies than 16S rRNA [62].
Western blot, RNA isolation and northern blot
Cultures grown on LB, M9G, or M9S were sampled in mid-exponential growth phase (OD600
0.4–0.6) and were directly harvested in killing buffer and processed as previously described [9]. Northern blot analysis was carried out as described previously [63]. The digoxigenin-labeled RNA probe was synthesized byin vitrotranscription with T7 RNA polymerase and anabrB
specific PCR product as template. 5μg of total RNA per lane was separated on 1.2% agarose
gels. Chemiluminescence signals were detected using a ChemoCam Imager (Intas Science Image Instruments GmbH, Göttingen, Germany).
Western blot analysis was performed as described [64] using crude whole cell lysates. To prepare lysates, cell pellets were resuspended in LDS-sample buffer with reducing agent (Life technologies), and disrupted with glass beads in a bead beater (3 x 30 sec at 6500 rpm with 30 sec intermittences). Before loading on Novex nuPAGE 10% Bis-Tris gels (Life technologies), samples were boiled for 10 min and centrifuged to pellet the glass beads and cell debris. Equal OD units were loaded on gel and the intensity of the AbrB band was corrected with the intensi-ty for the unrelated BdbD control.
Data from Northern blots and Western blots were quantified ImageJ software (available via
http://rsbweb.nih.gov/ij/).
Analysis of mRNA decay
Rifampicin (Sigma Aldrich) was added to 100 ml of exponentially growing M9G culture to a final concentration of 150μg/ml from a 100x stock solution in methanol stored at−20°C. Just
before the rifampicin addition and at 1, 2, 4, 6, 8 and 10 min after rifampicin addition, 10 ml of cells were harvested in killing buffer as described previously [9]. Cell pellets were washed once with 1 ml killing buffer and frozen in liquid nitrogen. RNA was extracted according to the hot phenol method as described previously [63]. Quantitative PCR was performed as described by Reilman et al. [51]. The Ct value corresponds to the PCR cycle at which the signal came above background.
We analyzed the four mRNA decay time-series (two strains and two replicates) with a non-linear model of mRNA concentration described in [65] that aims at capturing initial exponen-tial decay followed by a plateau. The rate of the iniexponen-tial decay is supposed to correspond to the physiological degradation of the mRNA. In contrast, the final plateau can be contributed by several factors, such as background noise in measurement, a stable subpopulation of molecules, or a higher stability of the mRNAs at the end of the dynamic. In our context, we assumed that the mRNA concentration is proportional to 2-Ctand thus we fitted (with the nls function of the
R package stats) the model-Ct(ti) = log2(A(α1exp(-γ1ti)+α2)) +εi, for i = 1. . .7 (ti= 0, 1, 2, 4, 6,
8, 10 min) with A>0,α1>0,α2>0,γ1>0,α1+α2= 0 andεia Gaussian white noise. The esti-mates of theγ1parameters of the first model were compared between the two genetic
back-grounds (0 genomic copies vs. 2 copies of RnaC/S1022) with a student t-test after a log-transformation to stabilize the variance. For the 2-copy background, we also examined a sec-ond model that involves two exponential decay terms as would for instance arise when two sub-populations of mRNAs with distinct degradation rates coexist. It writes-Ct(ti) = log2(A
(α1exp(-γ1ti)+α2exp(-γ2ti)+α3)) +εiwith A>0,α1>0,α2>0,α3>0,γ1>γ2>0, andα1+α2+α3=
0. For each pair of background and model, we plotted a“consensus”line whose parameters were obtained from the geometric mean between the two replicate experiments.
Computation of promoter activity
Promoter activity was monitored every 10 min from cells grown in 96-well plates in a Biotek Synergy 2 plate reader. Promoter activity was computed by subtracting the fluorescence of the previous time-point from that of the measured time-point (as in Botella et al. [38]). Moving av-erage filtering (filterfunction in R with filter = rep(1/5, 5) was applied for smoothing of the promoter activity plots.
Flow cytometry and noise measurements
Cultures grown on LB, M9G, or M9S were sampled in mid-exponential growth phase OD600
0.4–0.5 and were directly analyzed in an Accuri C6 flow cytometer. The number of recorded events within a gate set with growth medium was 15,000. The coefficient of variation (i.e. rela-tive standard deviation) (CV%; standard deviation / mean100%) was used as a measure of
the width of the distribution, or protein/promoter expression noise.
Microscopy and live imaging
To inspect co-localization of AbrB-GFP with the nucleoid, cells were cultured until the expo-nential growth phase, pelleted by centrifugation, resuspended in 400μl phosphate-buffered
sa-line (PBS) containing 1μl 500 ng/μl 4',6-diamidino-2-phenylindole (DAPI), and incubated for
10 min on ice. After this, the cells were washed once with PBS and slides were prepared for microscopy.
Live imaging analysis was conducted on aerated agarose cover slips as described previously [52]. Segmentation, calculation of Feret diameter, and auto-fluorescence correction for every microcolony were performed with ImageJ also as described by Piersma et al. [52]. Subsequent computations and plotting was done with R. The specific cell length (Feret diameter) increase per hour was computed as follows: ((cumulative Feret diameter at t20 min/ number of cells at
t0 min)–(cumulative Feret diameter at t0 min/ number of cells at t0 min)) / ((t20 min—t0 min) /
60 min).
Modeling noise
Noise promoting dynamics by sRNA regulation was modeled in a stochastic simulation model [45–47]. The considered reactions, employed parameters, and the master equation are listed in
be interpreted as 50 experiments involving 10,000 cells each. Mean, standard deviation, and the median was computed for every molecular species in the population of 10,000 cells.
Supporting Information
S1 Fig. Sequence analysis of the RnaC/S1022 andabrBinteraction.A) LocaRNA alignment of nine RnaC/S1022 sequences corresponding to the secondary structure predicted and shown inFig. 1B. These sequences are derived from theB.subtilisgenomes for which the interaction between RnaC/S1022 andabrBis predicted (genomes within the red box inFig. 1A). Note that the diverging RnaC/S1022 sequence from theB.atropheus1942 genome was excluded, because it would have added a large degree of uncertainty to the consensus structure presented in
Fig. 1B, as is shown in panels E and F of thisS1 Fig.. The mutated nucleotide that is essential for the interaction withabrBmRNA is indicated with an arrow. B) RNAfold [30] centroid structure based solely on the S1022 sequence from Nicolas et al. [28]. As indicated in the main text, this sequence is longer than that inFig. 1B, but the predicted structure in the region that will interact withabrBis the same as the consensus sequence inFig. 1B. The mutated nucleo-tide essential for the interaction withabrBmRNA is indicated with an arrow. C) T-COFFEE (http://www.tcoffee.org/) sequence alignment as visualized with Jalview (http://www.jalview. org/) of theabrBinteraction region (-10 till +19 from theB.subtilis168abrBstart codon) in all 19 species in which RnaC/S1022 is conserved (marked in the black box inFig. 1A). The nucleo-tide essential for the interaction with RnaC/S1022 is indicated with an arrow and is conserved in all the genomes in which RnaC/S1022 is conserved. D) T-COFFEE alignment as visualized with Jalview of 19 conserved RnaC/S1022 sequences (genomes within the black box in
Fig. 1A). The RnaC/S1022 hit fromB.atropheus1942 represents an in-between form of RnaC/ S1022 since its sequence is most similar to that from theB.amyloliquefacienssp. genomes whileabrBis still predicted as a direct RnaC/S1022 target. The mutated nucleotide essential for the interaction withabrBmRNA is indicated with an arrow. E) LocaRNA sequence alignment of the same RnaC/S1022 sequences that were aligned in panel D. Due to the low level of simi-larity between these sequences no meaningful secondary structure can be predicted from this alignment as can be seen in panel E of thisS1 Fig.. The mutated nucleotide essential for the in-teraction ofB.subtilis168 RnaC/S1022 withabrBmRNA is indicated with an arrow. F) LocaRNA structure prediction based on the RnaC/S1022 sequence alignment shown in panel E. This can be interpreted as a‘nonsense structure’due to the low level of similarity between the aligned sequences.
(TIF)
S2 Fig. Growth phenotypes of cells lacking RnaC/S1022.The same growth curves as shown inFig. 1Care presented as lin-log plots to distinguish between effects of the RnaC/S1022 muta-tion on growth rates and growth yields. When cells are grown on M9S, which results in the most drastic growth phenotype of RnaC/S1022 mutant cells, the growth rate is only slightly influenced by the RnaC/S1022 deletion while the growth yield is strongly increased. (TIF)
S3 Fig. Competence is decreased in an RnaC/S1022 mutant.Competence was assayed by transformation with plasmid pHB201. Error bars represent the standard deviation between three replicate experiments.
(TIF)
S4 Fig.abrBmRNA is more stable in the absence of RnaC/S1022.Decreases inabrBmRNA levels after rifampicin addition were determined by qPCR using equal amounts of RNA per strain and time-point. The RNA from the RnaC/S1022 deletion strain (blue symbols) was
compared with RNA from the strain with two chromosomal RnaC/S1022 copies (green sym-bols). Two non-linear models were fitted to these data: a first model with a single decay rate fol-lowed by a plateau (fit illustrated with plain line); a second model with two decay rates (fit illustrated with interrupted line). The initial decay rate (as estimated by theγ1parameter of the first model) was significantly higher in the strain with two copies of RnaC/S1022 (Students t-test, p-value<0.05). The second model provided a better fit to the data of the strain with two
genomic copies of RnaC/S1022, and leads to even higher estimates of the initial decay rate (theγ1parameter of the second model).
(TIF)
S5 Fig. AbrB-GFP localizes to the nucleoid.Fluorescence microscopy images of theΔspo0A
AbrB-GFP strain (left panels) and theamyE::PspacGFP strain (right panels). DAPI was used to
stain the DNA. As shown in the image overlay, AbrB-GFP fluorescence colocalizes with the DAPI-stained nucleoid as expected from the fact that AbrB is a DNA-binding protein. (TIF)
S6 Fig.B.subtilisHfq has no effect on expression of the AbrB-GFP reporter.Representative FC histograms of AbrB-GFP expression by cells of the parentalB.subtilisstrain 168, aΔhfq
mutant, and aΔhfqΔRnaC/S1022 double mutant grown on M9G. The profile of AbrB-GFP ex-pression in thehfqmutant strain is identical to that in the parental strain, indicating that Hfq has no role in mediating the direct interaction between RnaC/S1022 andabrB.
(TIF)
S7 Fig. AbrB does not regulate the RnaC/S1022 promoter.Representative FC histograms of the parental strainB.subtilis168 and theΔabrBstrain carrying the PRnaC/S1022-gfpconstruct.
These experiments were performed with cells grown on LB, because of the M9G/M9S growth phenotypes ofabrBmutant strains.
(TIF)
S8 Fig. Modeling outcomes for both sets of parameters at variable extrinsic noise levels. Modeling outcomes as described inFig. 6for all five considered intrinsic noise levels obtained with parameter Sets I and II. Different intrinsic noise levels are marked with differently colored symbols.
(TIF)
S9 Fig. Growth and AbrB-GFP levels of colonies fromFig. 8Cand theS1 Movie.Cell growth is expressed as the cumulative cell length (Feret’s diameter). Cell #1 with a higher initial AbrB-GFP level grows faster than cell #2 with a lower initial AbrB-AbrB-GFP level.
(TIF)
S1 Table. Conserved predicted targets of RnaC/S1022. (XLSX)
S2 Table. Strains used in this study. (XLSX)
S3 Table. Primers used in this study. (XLSX)
S1 Movie. Original movie of the two adjacent cells shown inFig. 8CandS8 Fig.The white outlines mark the contours of the cell.
Acknowledgments
The authors would like to thank Brian Tjaden for the TargetRNA_v1 source code, Peter Lewis for kindly providing the AbrB-GFP fusion strain, and David Rudner for kindly providing the pDR111 plasmid. We thank our colleagues from the BaSysBio and BACELL SysMO projects for helpful discussions and support.
Author Contributions
Conceived and designed the experiments: RATM PN MC ER JMvD ELD. Performed the ex-periments: RATM PN MC ER AR MS UM. Analyzed the data: RATM PN MC ER AR UM ELD. Contributed reagents/materials/analysis tools: RATM PN MC ER AR MS UM UV JMvD ELD. Wrote the paper: RATM PN MC UM UV JMvD ELD.
References
1. Buescher JM, Liebermeister W, Jules M, Uhr M, Muntel J, et al. (2012) Global network reorganization during dynamic adaptations ofBacillus subtilismetabolism. Science 335(6072): 1099–1103. doi:10. 1126/science.1206871PMID:22383848
2. Beisel CL, Storz G. (2010) Base pairing small RNAs and their roles in global regulatory networks. FEMS Microbiol Rev 34(5): 866–882. doi:10.1111/j.1574-6976.2010.00241.xPMID:20662934 3. Storz G, Vogel J, Wassarman KM. (2011) Regulation by small RNAs in bacteria: Expanding frontiers.
Mol Cell 43(6): 880–891. doi:10.1016/j.molcel.2011.08.022PMID:21925377
4. Aiba H. (2007) Mechanism of RNA silencing by Hfq-binding small RNAs. Curr Opin Microbiol 10(2): 134–139. PMID:17383928
5. Gaballa A, Antelmann H, Aguilar C, Khakh SK, Song KB, et al. (2008) TheBacillus subtilisiron-sparing response is mediated by a Fur-regulated small RNA and three small, basic proteins. Proc Natl Acad Sci U S A 105(33): 11927–11932. doi:10.1073/pnas.0711752105PMID:18697947
6. Heidrich N, Chinali A, Gerth U, Brantl S. (2006) The small untranslated RNA SR1 from theBacillus sub-tilisgenome is involved in the regulation of arginine catabolism. Mol Microbiol 62(2): 520–536. PMID: 17020585
7. Smaldone GT, Revelles O, Gaballa A, Sauer U, Antelmann H, et al. (2012) A global investigation of the Bacillus subtilisiron-sparing response identifies major changes in metabolism. J Bacteriol 194(10): 2594–2605. doi:10.1128/JB.05990-11PMID:22389480
8. Irnov I, Sharma CM, Vogel J, Winkler WC. (2010) Identification of regulatory RNAs inBacillus subtilis. Nucleic Acids Res 38(19): 6637–6651. doi:10.1093/nar/gkq454PMID:20525796
9. Nicolas P, Mader U, Dervyn E, Rochat T, Leduc A, et al. (2012) Condition-dependent transcriptome re-veals high-level regulatory architecture inBacillus subtilis. Science 335(6072): 1103–1106. doi:10. 1126/science.1206848PMID:22383849
10. Raj A, van Oudenaarden A. (2008) Nature, nurture, or chance: Stochastic gene expression and its con-sequences. Cell 135(2): 216–226. doi:10.1016/j.cell.2008.09.050PMID:18957198
11. Losick R, Desplan C. (2008) Stochasticity and cell fate. Science 320(5872): 65–68. doi:10.1126/ science.1147888PMID:18388284
12. Maamar H, Raj A, Dubnau D. (2007) Noise in gene expression determines cell fate inBacillus subtilis. Science 317(5837): 526–529. PMID:17569828
13. Chastanet A, Vitkup D, Yuan GC, Norman TM, Liu JS, et al. (2010) Broadly heterogeneous activation of the master regulator for sporulation inBacillus subtilis. Proc Natl Acad Sci U S A 107(18): 8486–8491. doi:10.1073/pnas.1002499107PMID:20404177
14. Veening JW, Smits WK, Kuipers OP. (2008) Bistability, epigenetics, and bet-hedging in bacteria. Annu Rev Microbiol 62: 193–210. doi:10.1146/annurev.micro.62.081307.163002PMID:18537474 15. Elowitz MB, Levine AJ, Siggia ED, Swain PS. (2002) Stochastic gene expression in a single cell.
Sci-ence 297(5584): 1183–1186. PMID:12183631
16. Paulsson J. (2004) Summing up the noise in gene networks. Nature 427(6973): 415–418. PMID: 14749823
17. Balaban NQ, Merrin J, Chait R, Kowalik L, Leibler S. (2004) Bacterial persistence as a phenotypic switch. Science 305(5690): 1622–1625. PMID:15308767