ACPD
4, 207–225, 2004Radiant distribution of micrometeors
D. Janches et al.
Title Page
Abstract Introduction
Conclusions References
Tables Figures
◭ ◮
◭ ◮
Back Close
Full Screen / Esc
Print Version
Interactive Discussion
©EGU 2004
Atmos. Chem. Phys. Discuss., 4, 207–225, 2004 www.atmos-chem-phys.org/acpd/4/207/
SRef-ID: 1680-7375/acpd/2004-4-207 © European Geosciences Union 2004
Atmospheric Chemistry and Physics Discussions
Radiant measurement accuracy of
micrometeors detected by the Arecibo
430 MHz dual-beam radar
D. Janches, M. C. Nolan, and M. Sulzer
Arecibo Observatory, Arecibo, Puerto Rico
ACPD
4, 207–225, 2004Radiant distribution of micrometeors
D. Janches et al.
Title Page
Abstract Introduction
Conclusions References
Tables Figures
◭ ◮
◭ ◮
Back Close
Full Screen / Esc
Print Version
Interactive Discussion
©EGU 2004
Abstract
Precise knowledge of the angle between the meteor vector velocity and the radar beam axis is one of the largest source of errors in the Arecibo Observatory (AO) microme-teor observations. In this paper we study∼250 high signal-to-noise ratio (SNR) meteor
head-echoes obtained using the dual-beam 430 MHz AO Radar in Puerto Rico, in
or-5
der to reveal the distribution of this angle. All of these meteors have been detected first by the radar first side lobe, then by the main beam and finally seen in the side lobe again. Using geometrical arguments to calculate the meteor velocity in the plane perpendicular to the beam axis, we find that most of the meteors are travelling within
∼15◦ with respect to the beam axis, in excellent agreement with previous estimates.
10
These results suggest that meteoroids entering the atmosphere at greater angles may deposit their meteoric material at higher altitudes explaining at some level the missing mass inconsistency raised by the comparisson of meteor fluxes derived from satellite and radar observations. They also may be the source of the observed high altitude ions and metallic layers observed by radars and lidars respectively.
15
1. Introduction
The Arecibo Observatory (AO) 430 MHz radar detects∼10 000 events daily, and
sures their radial velocity with great accuracy. We obtain this high accuracy by mea-suring the Doppler shift of the meteor head-echoes, which are radar reflections from a plasma travelling with the meteoroid. The largest source of error in these observations
20
arises from the lack of precise knowledge of the position of the meteoroid as it flies through the 305 m diameter radar beam, and their exact angle of entry. Very precise Doppler measurments of the line-of-sight meteor velocity give estimates with less than 1% errors for radial velocities between a few km/s to ∼70 km/s. We have argued in
the past, based on dynamical arguments and geocentric meteor velocity measurments
25
ACPD
4, 207–225, 2004Radiant distribution of micrometeors
D. Janches et al.
Title Page
Abstract Introduction
Conclusions References
Tables Figures
◭ ◮
◭ ◮
Back Close
Full Screen / Esc
Print Version
Interactive Discussion
©EGU 2004
between the radar beam and the meteoroid vector velocity must be small, less than 15◦. We will refer to this angle as the meteor off-axis angle for the rest of this
pa-per. Ongoing theoretical studies of the altitude at which micrometeor initial ablation occurs (Janches and ReVelle,2003) show that if micron-sized particles travel at angles larger than∼30◦ with respect to the vertical, then the ablation will begin at higher
alti-5
tudes before reaching the small AO radar volume. Knowledge of this angle is crucial for the precise radiant determination needed for orbital calculations (Janches et al.,
2001;Meisel et al.,2002). A small error will also be introduced in our meteoroid size estimates (Janches et al.,2000b) and calculations of meteoric mass flux into the up-per atmosphere due to these meteoroids (Mathews et al.,2001;Raizada et al.,2003).
10
These issues will be discussed in more detail later in this paper.
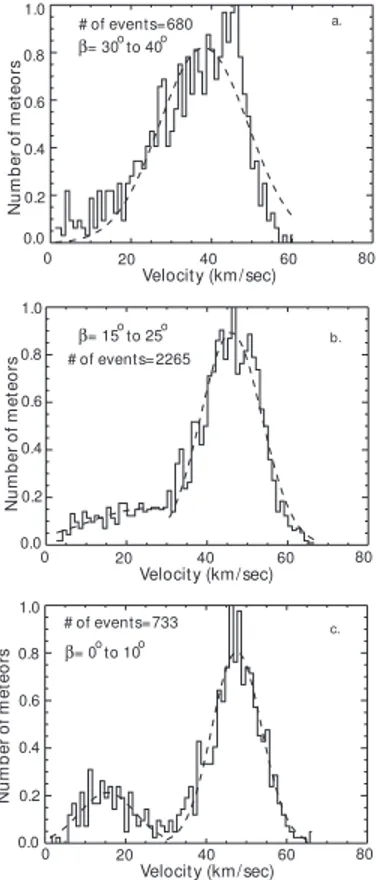
Figure1shows velocity distributions obtained at AO with the dual-beam radar system during the 04:00–06:00 hr AST interval of 21 January 2002. Although our observations covered the whole night, we present and discuss only the distributions between 04:00 and 06:00 hrs AST, the period during which the meteor rate detected by the AO radar
15
is maximum (∼40 events per minute;Janches et al.,2003) and the result reported here
is clearest. The high event rate is due to the fact the AO radar points towards the so-called apex,the direction of the Earth’s motion in its orbit around the Sun, where particles caught by the Earth, as well as head-on collisions, are present, unlike the antapex direction where a particle must travel sufficiently fast to reach the Earth from
20
behind in its orbit (Janches et al.,2000a). The “North” (Fig.1a) velocity distribution was detected by the AO Gregorian feed (GF) when it was pointed 15◦from the zenith looking
north of AO and the “South” distribution (Fig.1c) was obtained when the antenna was pointed 15◦ from the zenith looking south of AO. Figure1b shows the distribution from
the detections of the line feed (LF) looking vertical at AO. The complete description of
25
ACPD
4, 207–225, 2004Radiant distribution of micrometeors
D. Janches et al.
Title Page
Abstract Introduction
Conclusions References
Tables Figures
◭ ◮
◭ ◮
Back Close
Full Screen / Esc
Print Version
Interactive Discussion
©EGU 2004
the order of 30 km/s. The “Vertical” distribution seems to be a mixture of the “North” and “South”, where the bimodal characteristics are still present, but with some 30 km/s objects. As pointed out inJanches et al.(2003), these differences in the distributions as well as the lack of events with velocities of the order of 30 km/s cannot be due to an instrumental bias, because we are using the same instrument (the GF) to monitor two
5
different areas of the sky. If the absence of meteors were due to an instrumental bias, then the effect should be present in both the “North” and “South” distributions.
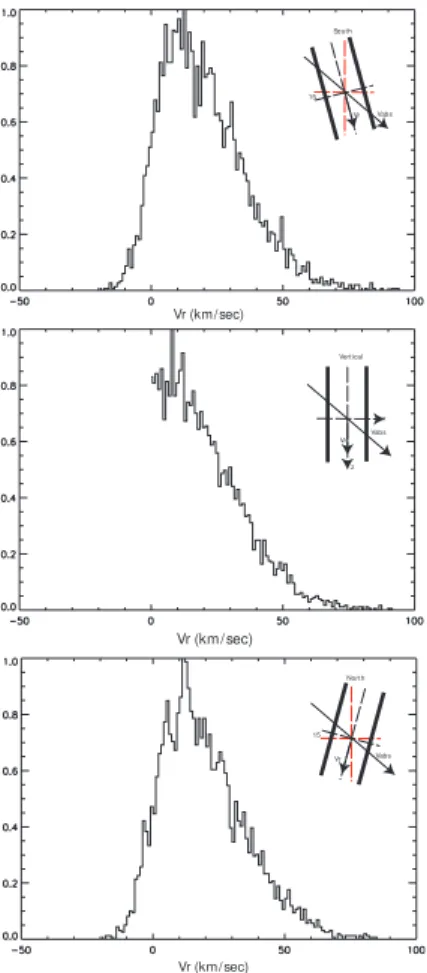
In order to further explore this issue, we performed a simple simulation where uni-form random distributions in meteor vector velocity are assumed. We then calculate the line-of-sight velocity for the different pointing directions presented in Fig.2. Note that
10
the “North” and “South” simulated velocity distributions are identical, while the “Verti-cal” distribution decreases with increasing velocity. It is deduced from this simulation that the particles that produced the meteors detected at Arecibo are not traveling in random directions and that for each pointing direction there is a preferred radiant distri-bution. We suggest the scenario where a filtering effect occurs in which, for a particular
15
pointing direction, the radar detects mainly particles with vector velocities within a nar-row angular range with respect to the beam axis. In the next section we describe the methodology used to determine an upper limit to this angular range. We present and discuss the results in Sect. 3 and explore the posibles causes of this effect and give the major implications on our general micrometeor results.
20
2. Methodology
For this study, we use a sample of 265 (out of∼40 000) radar meteor head-echoes that
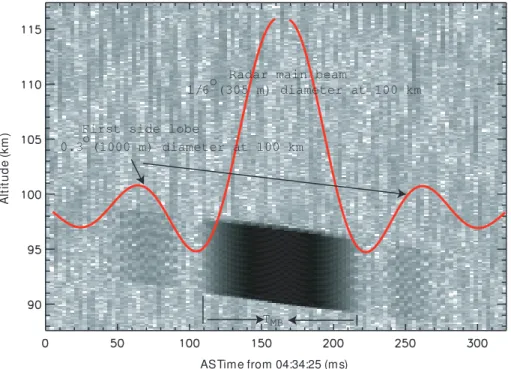
show the largest (<1000) signal-to-noise ratio (SNR) detected at AO during the nights of 21 January and 25 June 2002. Figure3displays the range-time-intensity (RTI) plot of one of these events. Note that the meteor return in this figure shows three parts.
25
ACPD
4, 207–225, 2004Radiant distribution of micrometeors
D. Janches et al.
Title Page
Abstract Introduction
Conclusions References
Tables Figures
◭ ◮
◭ ◮
Back Close
Full Screen / Esc
Print Version
Interactive Discussion
©EGU 2004
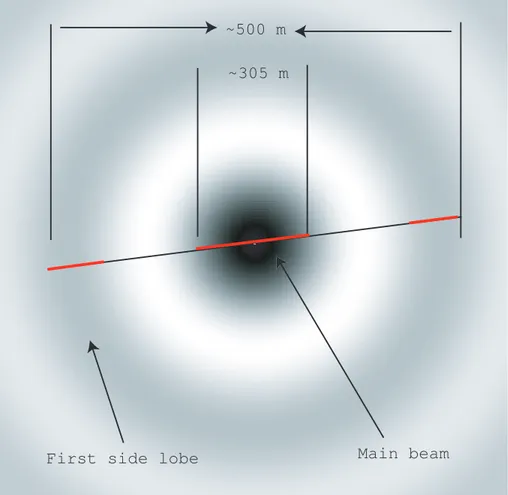
main beam. All the meteors in the subset discussed here show this characteristic. If we assume that the meteor travels through the center of the main beam (Fig.4) we can calculate from the duration of the event how long it took to cross the length of the main beam (∼300 m). From this calculation, we can estimate the largest tangential velocity
that the meteor would have as
5
VT = 0.3 km
TMB , (1)
whereVT is the tangential velocity andTMB is the duration of the meteor in the radar main beam. The estimation of the meteor off-axis angle is trivial once we know the tangential and radial component of the meteor velocity and is given by
α=tan−1(VT
Vr), (2)
10
whereVris the radial velocity. Note that if the meteor does not travel throught the center of the main beam, then the distance it travels is shorter hence the tangential velocity appears artificially higher andαis smaller too: that is why this estimate represents the upper limit for the off-axis angle.
3. Discussion 15
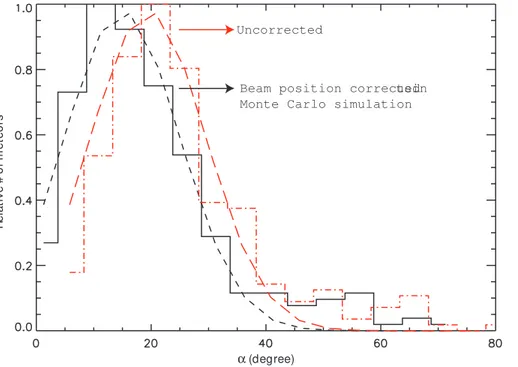
The distribution of estimated meteor off-axis angles from the methodology described in the previous section is presented in Fig.5 (red dashed line). This histogram contains 265 events discussed in this paper. A gaussian curve is fitted to the distribution and is given by
f(α)=A0×exp(−(
α−α¯)2
σ2 ),
20
ACPD
4, 207–225, 2004Radiant distribution of micrometeors
D. Janches et al.
Title Page
Abstract Introduction
Conclusions References
Tables Figures
◭ ◮
◭ ◮
Back Close
Full Screen / Esc
Print Version
Interactive Discussion
©EGU 2004
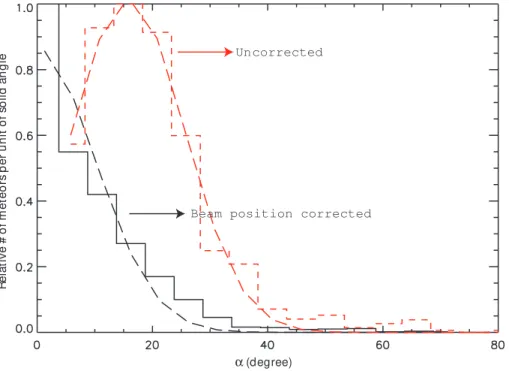
for the data sets with same radar pointing characteristics. The results presented in Table1 show that, independently of antenna feed or radiant observed, the detected angular distribution is identical for the three directions and both feeds, suggesting that there is a filtering process which prevents particles with large off-axis angles to reach the radar volume between the 80 and 120 km of altitude. Figure 6 (red dashed line)
5
displays the meteors per unit solid angle. This figure suggests that AO cannot detect meteors with small off-axis angle (<7◦) which makes no physical sense. This e
ffect is an artifact of the assumption that all the events are travelling through the radar beam center. In order to correct for this effect, we perform a further correction by randomly choosing the meteor position within the radar beam. The results of this correction are
10
shown in both Figs.5and 6, as solid black lines. Gaussian curves were also fitted to these results and their parameters are presented in Table1. We can see from Fig.5
that for the corrected distribution the avergae off-axis angle is 15◦. Taking the 1/e point
in the gaussian curve (black solid line) in Fig. 6, which looks as expected, we can estimate that most of the events are within 15◦the radar beam axis.
15
We now explore the different causes that could produce this effect. We first note that a particle traveling at∼50 km/s at an off-axis angle of 90◦ will spend∼6 ms inside
the AO radar main beam. Since the IPP used in our observations is 1 ms, there is no reason why these events should fly undetected through the beam. In fact, we measure a small sample of meteors which show low line-of-sight velocities and short durations
20
and possibly some of these events are fast particles crossing the beam perpendicu-larly. However, it is difficult to distinguish between meteors and space debris when the line-of-sight velocity is lower than the Earth’s escape velocity (11.2 km/s). An other posibility is that the head echo is aspect sensitive, that is the radar return is stronger for meteor traveling at low off-axis angles. However, Close et al. (2002) reported for
25
the first time high polarization ratio measurements of meteor head-echoes utilizing AL-TAIR, suggesting that the meteor head-echo is approximately spherical in shape (i.e. the radar cross section is isotropic). Theoretical results reported byJanches and
ACPD
4, 207–225, 2004Radiant distribution of micrometeors
D. Janches et al.
Title Page
Abstract Introduction
Conclusions References
Tables Figures
◭ ◮
◭ ◮
Back Close
Full Screen / Esc
Print Version
Interactive Discussion
©EGU 2004
given by the meteor energy equation approximated for small particles (Whipple,1951;
Ceplecha et al., 1998). They calculate the altitude dependence of absolute meteor velocity and find good agreement with the AO observations for off-axis angles lower than 30◦. The results presented here are in excellent agreement with those results
and previous estimates using dynamical arguments (Meisel et al.,2002). If this is the
5
dominant case, then the filtering effect is produced mainly because particles with large off-axis angle would interact with sufficient atmosphere so that they ablate or stop be-fore reaching the small radar volume centered at∼100 km of altitude. This would imply
that a portion of the incoming meteoric material is ablated and deposited at higher altitudes than the so called meteor ablation zone. Estimation of the meteoric mass
10
detected by the AO radar gives∼2000 tons per year over the whole Earth for particles
in the 0.5–100µm size range (Mathews et al., 2001; Raizada et al., 2003). This es-timate raised some controversies since it is lower than a widely used eses-timate given byLove and Brownlee (1993) but in better agreement, although still lower than other estimates (Ceplecha et al.,1998;Rietmeijer,2000). For the same particle mass range
15
detected at AO (10−5–10µg), these estimates were mainly derived from satellite
mea-surements which are much higher (∼500 km) than the altitudes at which radar meteor
activity is maxima (∼105 km).Hughes(1978) showed that there is a large discrepancy
between the rates detected by satellite and by classical meteor radars. If a portion of the meteor influx is deposited at high altitudes as these results suggest, then it could
20
explain at least at some level the missing mass discrepancy raised by the comparisson between conventional meteor radars and satellite measurements. In addition,Tepley
et al. (2003) report lidar observations of Ca+layers at altitudes near 120 km which are correlated to Ne layers observed with the AO radar in ISR mode, and appear to be descending from above this zone. H ¨offner and Friedman(2004) report lidar
measure-25
ACPD
4, 207–225, 2004Radiant distribution of micrometeors
D. Janches et al.
Title Page
Abstract Introduction
Conclusions References
Tables Figures
◭ ◮
◭ ◮
Back Close
Full Screen / Esc
Print Version
Interactive Discussion
©EGU 2004
led to conclude that micon-sized particles which enter the atmosphere at large angles will ablate at higher altitudes and could be regarded to some degree as the source for the ions which produce the descending layers and high altitude metallic layers.
Chau and Woodman(2003) using observations performed with the Jicamarca radar at 50 MHz showed that the detected particles have radiants within a narrow angular
5
range around the apex direction. Sulzer (2004) comfirm these results using regular incoherent scatter radar of the ionosphere performed at Arecibo. This “preferred” di-rectionality on the meteor radiant distribution helps also explaining at some degree the differences oberved in the meteor geocentric velocity distributions resulted from AO observations (Fig. 1 Janches et al., 2003) in the sense that the “South” distribution
10
results from observing close to the ecliptic plane right into the meteor flow, while the “North” distribution is the same flow but shifted by a cosine factor. However, the depen-dency of the hourly meteor rate with ecliptic latitude reported byJanches et al.(2003) suggests that the difference are more likely from a combination of both effects argue here, atmospheric filttering and geometrical, as well as additional characteristics of the
15
dust distribution at 1 AU. Finally, due to the pointing characteristics of the AO system during the observations presented here, the “South” distribution represents absolute velocities and the bi-modal characteristics suggests the presence of two populations of particles in the AO detections: a slow and less dominant with asteroidal orbital charac-teristics and a faster and more dominant, which orbits are mainly retrograde (Janches 20
et al., 2001) . The fast distribution can either be the results of particles of cometary origin or small charged particles that have been accelerated by electromagnetic effects with the interplanetary magnetic field (Morfill and Gr ¨un,1979;Janches et al.,2001). In any case, the fundamental result of this paper is that for a particular pointing direction, events are travelling within a narrow angular distribution with respect to the beam axis,
25
ACPD
4, 207–225, 2004Radiant distribution of micrometeors
D. Janches et al.
Title Page
Abstract Introduction
Conclusions References
Tables Figures
◭ ◮
◭ ◮
Back Close
Full Screen / Esc
Print Version
Interactive Discussion
©EGU 2004
4. Conclusions
In this paper we presented∼250 high signal-to-noise (SNR) ratio meteor head-echoes
observations obtained using the dual-beam 430 MHz Arecibo Observatory (AO) Radar in Puerto Rico. Using the known diffraction pattern of the telescope, we applied a geometrical calculation in order to estimate the distribution of the meteor off-axis angle
5
(i.e. angle between the vector velocity and the radar beam axis). We find that meteors mostly travel with radiants within∼15◦with respect to the radar beam axis, in excellent
agreement with previous estimates. This uncertainty does not introduce significant error to our general results of meteoric mass estimates and orbital characteristics of the dust.
10
Acknowledgements. The Arecibo Observatory is part of the National Astronomy and Iono-sphere Center, which is operated by Cornell University under cooperative agreement with the National Science Foundation. This work has been supported under NSF/CEDAR Post Doctoral program awarded to D. J. (ATM-0004284). D. J. wishes to thank S. Basu and R. Robinson at NSF and P. Bellaire and E. Murad at AFRL for the support that made the Radar Meteor
Work-15
shop at Arecibo possible, and all the participants for making it a very successful conference.
References
Ceplecha, Z., Boroviˇcka, J., Elford, W. G., Revelle, O. O., Hawkes, R. L., Porubˇcan, V., and ˇ
Simek, M.: Meteor Phenomena and Bodies, Space Sci. Rev., 84, 327–471, 1998. 213
Chau, J. L. and Woodman, R. F.: Observations of meteor-head echoes using the Jicamarca
20
50 MHz radar in interferometer mode, Atmos. Chem. Phys. Discuss., 3, 6063–6091, 2003.
214
Close, S., Oppenheim, M., Hunt, S. M., and Dyrud, L.: Scattering characteristics of high-resolution meteor head echoes detected at multiple frequencies, J. Geophys. Res., 107, A10, 1295, doi:10.1029/2002JA009253, 2002. 212
25
ACPD
4, 207–225, 2004Radiant distribution of micrometeors
D. Janches et al.
Title Page
Abstract Introduction
Conclusions References
Tables Figures
◭ ◮
◭ ◮
Back Close
Full Screen / Esc
Print Version
Interactive Discussion
©EGU 2004
Hughes, D. W.: Meteors, Cosmic Dust, edited by McDonnell, J. A. M., Chichester, John Willey, 123–186, 1978. 213
Janches, D., Mathews, J. D., Meisel, D. D., Getman, V. S., and Zhou, Q. H.: Doppler studies of near-antapex UHF radar micrometeors, Icarus, 143, 347–353, 2000a. 209
Janches, D., Mathews, J. D., Meisel, D. D., and Zhou, Q. H.: Micrometeor observations
Us-5
ing the Arecibo 430 MHz radar: I. Determination of the Ballistic Parameter from measured Doppler velocity and deceleration results, Icarus, 145, 53–63, 2000b. 209
Janches, D., Meisel, D. D., and Mathews, J. D.: Orbital Properties of the Arecibo Micrometeors at Earth Interception, Icarus, 150, 206–218, 2001. 209,214
Janches, D., Nolan, M. C., Meisel, D. D., Mathews, J. D., Zhou, Q. H., and Moser, D. E.:
10
On the geocentric micrometeor velocity distribution, J. Geophys. Res., 108, A6, 1222, doi:10.1029/2002JA009789, 2003. 208,209,210,214
Janches, D. and ReVelle, D. O.: Micrometeor initial ablation altitude: Comparisson between observations and theory, Geophys. Res. Lett, submitted, 2003. 209,212
Love, S. G. and Brownlee, D. E.: A direct measurement of the terrestrial mass accretion rate of
15
cosmic dust, Science, 262, 550–553, 1993. 213
Mathews, J. D., Janches, D., Meisel, D. D., and Zhou, Q. H.: The Micrometeoroid Mass Flux into the Upper Atmosphere: Arecibo Results and a Comparison with Prior Estimates, Geophys. Res. Lett., 28, 10, 1929–1932, 2001. 209,213
Meisel, D.D., Janches, D., and Mathews, J. D.: Extrasolar Micrometeors Radiating from the
20
Vicinity of the Local Interstellar Bubble, Ap. J., 567, 323–341, 2002. 208,209,213,214
Morfill, G. E. and Gr ¨un, E.: The motion of charged dust particles in interplanetary space–I. The zodiacal dust cloud, Planet. Sp. Sci., 27, 1269–1282, 1979. 214
Raizada, S., Tepley, C. A., Janches, D., Friedman, J. S., Zhou, Q. H., and Mathews, J. D.: Lidar observations of Ca and K metallic layers at Arecibo and comparison with micrometeor
25
sporadic activity, J. Atmos. Solar Terr. Phys., In Press, 2003. 209,213
Rietmeijer, F. J. M.: Interrelationships among meteoric metals, meteors, interplanetary dust, micrometeorites and meteorites, Meteoritics Planet. Sci., 35, 1025–1041, 2000. 213
Sulzer, M. P.: Meteor Science from Regular Incoherent Scatter Radar Ionospheric Observations at Arecibo, Atmos. Chem. Phys. Discuss., this issue, 2004. 214
30
ACPD
4, 207–225, 2004Radiant distribution of micrometeors
D. Janches et al.
Title Page
Abstract Introduction
Conclusions References
Tables Figures
◭ ◮
◭ ◮
Back Close
Full Screen / Esc
Print Version
Interactive Discussion
©EGU 2004
ACPD
4, 207–225, 2004Radiant distribution of micrometeors
D. Janches et al.
Title Page
Abstract Introduction
Conclusions References
Tables Figures
◭ ◮
◭ ◮
Back Close
Full Screen / Esc
Print Version
Interactive Discussion
©EGU 2004
Table 1.Gaussian fitting parameters.
Antenna Feed Pointing A0 α¯ (◦) σ(◦) Line Vertical 0.82 22.4 8.5 Gregorian North 0.72 22.6 9.0 Gregorian South 0.99 20.8 1.7
All t 0.86 21.7 9.3
ACPD
4, 207–225, 2004Radiant distribution of micrometeors
D. Janches et al.
Title Page
Abstract Introduction
Conclusions References
Tables Figures
◭ ◮
◭ ◮
Back Close
Full Screen / Esc
Print Version
Interactive Discussion
©EGU 2004
Table 2.Gaussian fitting parameters for Fig.6.
Beam Position Correction A0 α¯ (◦) σ(◦) Yes 0.86 1.9×10⁻⁶ 10.1
ACPD
4, 207–225, 2004Radiant distribution of micrometeors
D. Janches et al.
Title Page Abstract Introduction Conclusions References Tables Figures ◭ ◮ ◭ ◮ Back Close
Full Screen / Esc
Print Version
Interactive Discussion
©EGU 2004
Velocit y (km/ sec)
0 20 40 60 80
N u m b e r o f m e te o rs 0.0 0.2 0.4 0.6 0.8 1.0
Velocit y (km/ sec)
N u m b e r o f m e te o rs
0 20 40 60 80 0.0 0.2 0.4 0.6 0.8 1.0
Velocit y (km/ sec)
N u m b e r o f m e te o rs
0 20 40 60 80 0.2 0.4 0.6 0.8 1.0 0.0
β= 30 to 40
β= 15 to 25
β= 0 to 10
o o
o o
o o
# of events=680
# of events=2265
# of events=733
a.
b.
c.
ACPD
4, 207–225, 2004Radiant distribution of micrometeors
D. Janches et al.
Title Page
Abstract Introduction
Conclusions References
Tables Figures
◭ ◮
◭ ◮
Back Close
Full Screen / Esc
Print Version
Interactive Discussion
©EGU 2004
Vabs Vr
Vabs Vr 15
Vabs Vr 15
Vr (km/ sec)
Vr (km/ sec)
Vr (km/ sec)
x
z South
Vertical
North
ACPD
4, 207–225, 2004Radiant distribution of micrometeors
D. Janches et al.
Title Page
Abstract Introduction
Conclusions References
Tables Figures
◭ ◮
◭ ◮
Back Close
Full Screen / Esc
Print Version
Interactive Discussion
©EGU 2004
Radar main beam
First side lobe
1/6 (305 m) diameter at 100 kmo
0.3 (1000 m) diameter at 100 kmo
AS Time from 04:34:25 (ms)
A
lt
it
u
d
e
(
k
m
)
TMB
Fig. 3. Range-time-intensity (RTI) plot showing a meteor event that begins at∼93 km and
ACPD
4, 207–225, 2004Radiant distribution of micrometeors
D. Janches et al.
Title Page
Abstract Introduction
Conclusions References
Tables Figures
◭ ◮
◭ ◮
Back Close
Full Screen / Esc
Print Version
Interactive Discussion
©EGU 2004
~305 m ~500 m
Main beam First side lobe
ACPD
4, 207–225, 2004Radiant distribution of micrometeors
D. Janches et al.
Title Page
Abstract Introduction
Conclusions References
Tables Figures
◭ ◮
◭ ◮
Back Close
Full Screen / Esc
Print Version
Interactive Discussion
©EGU 2004
α (degree)
R
e
la
ti
v
e
#
o
f
m
e
te
o
rs
Uncorrected
Beam position corrected usin Monte Carlo simulation
ACPD
4, 207–225, 2004Radiant distribution of micrometeors
D. Janches et al.
Title Page
Abstract Introduction
Conclusions References
Tables Figures
◭ ◮
◭ ◮
Back Close
Full Screen / Esc
Print Version
Interactive Discussion
©EGU 2004
Uncorrected
Beam position corrected
α (degree)
R
e
la
ti
v
e
#
o
f
m
e
te
o
rs
p
e
r
u
n
it
o
f
so
li
d
a
n
g
le