BGD
12, 10233–10269, 2015
Co-occurrence patterns in aquatic
bacterial communities
J. Comte et al.
Title Page
Abstract Introduction
Conclusions References
Tables Figures
◭ ◮
◭ ◮
Back Close
Full Screen / Esc
Printer-friendly Version Interactive Discussion
Discussion
P
a
per
|
Discussion
P
a
per
|
Discussion
P
a
per
|
Discussion
P
a
per
|
Biogeosciences Discuss., 12, 10233–10269, 2015 www.biogeosciences-discuss.net/12/10233/2015/ doi:10.5194/bgd-12-10233-2015
© Author(s) 2015. CC Attribution 3.0 License.
This discussion paper is/has been under review for the journal Biogeosciences (BG). Please refer to the corresponding final paper in BG if available.
Co-occurrence patterns in aquatic
bacterial communities across changing
permafrost landscapes
J. Comte1,2, C. Lovejoy1,2,3, S. Crevecoeur1,2, and W. F. Vincent1
1
Centre d’études nordiques (CEN), Takuvik Joint International Laboratory and Département de biologie, Université Laval, Québec, QC G1V 0A6, Canada
2
Institut de Biologie Intégrative et des Systèmes (IBIS), Université Laval, Québec, QC G1V 0A6, Canada
3
Québec Océan, Université Laval, Québec, QC G1V 0A6, Canada
Received: 09 June 2015 – Accepted: 16 June 2015 – Published: 08 July 2015
Correspondence to: J. Comte ([email protected])
BGD
12, 10233–10269, 2015
Co-occurrence patterns in aquatic
bacterial communities
J. Comte et al.
Title Page
Abstract Introduction
Conclusions References
Tables Figures
◭ ◮
◭ ◮
Back Close
Full Screen / Esc
Printer-friendly Version Interactive Discussion
Discussion
P
a
per
|
Discussion
P
a
per
|
Discussion
P
a
per
|
Discussion
P
a
per
|
Abstract
Permafrost thaw ponds and lakes are widespread across the northern landscape and may play a central role in global biogeochemical cycles, yet knowledge about their mi-crobial ecology is limited. We sampled a set of thaw ponds and lakes as well as shallow rock-basin lakes that are located in distinct valleys along a North–South permafrost
5
degradation gradient. We applied high-throughput sequencing of the 16S rRNA gene to determine co-occurrence patterns among bacterial taxa, and then analyzed these results relative to environmental variables to identify factors controlling bacterial com-munity structure. Network analysis was applied to identify possible ecological linkages among the bacterial taxa and with abiotic and biotic variables. The results showed an
10
overall high level of shared taxa among bacterial communities within each valley, how-ever the bacterial co-occurrence patterns were non-random, with evidence of habitat preferences. There were taxonomic differences in bacterial assemblages among the different valleys that were statistically related to dissolved organic carbon concentra-tion, conductivity and phytoplankton biomass. Co-occurrence networks revealed
com-15
plex interdependencies within the bacterioplankton communities and showed contrast-ing linkages to environmental conditions among the main bacterial phyla. The thaw pond networks were composed of a limited number of highly connected taxa. This “small world network” property would render the communities more robust to environ-mental change but vulnerable to the loss of microbial keystone species.
20
1 Introduction
Permafrost is widespread in Arctic and boreal regions (Schuur et al., 2008) and con-tains ca. 1700 Pg of organic carbon (McGuire et al., 2009; Tarnocai et al., 2009). Per-mafrost thawing and erosion is evident by the northward retreat of the perPer-mafrost boundary (Thibault and Payette, 2009). In some northern regions this has led to the
25
BGD
12, 10233–10269, 2015
Co-occurrence patterns in aquatic
bacterial communities
J. Comte et al.
Title Page
Abstract Introduction
Conclusions References
Tables Figures
◭ ◮
◭ ◮
Back Close
Full Screen / Esc
Printer-friendly Version Interactive Discussion
Discussion
P
a
per
|
Discussion
P
a
per
|
Discussion
P
a
per
|
Discussion
P
a
per
|
2013), whereas in other regions there has been a contraction and loss of these wa-terbodies (e.g., Andresen and Lougheed, 2015). These thermokarst systems are part of circumpolar and global biogeochemical cycles (Abnizova et al., 2012; Walter et al., 2007). Although some are carbon sinks (Walter Anthony et al., 2014), others are net sources of carbon dioxide (CO2) and methane (CH4) to the atmosphere due to the
mo-5
bilization of ancient carbon stored in permafrost (Laurion et al., 2010; Negandhi et al., 2013; Walter et al., 2008).
Bacterial communities are among the main drivers of key biogeochemical processes (Ducklow, 2008), and in thermokarst systems are composed of functionally diverse taxa (Crevecoeur et al., 2015; Rossi et al., 2013). In particular, these systems are favorable
10
for bacterial methanotrophs (Crevecoeur et al., 2015) as well as archaeal methanogens (Mondav et al., 2014), and the relative activity of these two groups will affect methane balance and the net emission of greenhouse gases. Identifying factors that shape bac-terial communities in these aquatic systems is therefore essential for understanding the functional significance of these permafrost thaw systems in the global carbon budget.
15
Aquatic bacterial communities are thought to be selected by a combination of bottom-up (resource availability) and top-down (viral lysis, grazing) controls. Less studied are bacteria-bacteria interactions (facilitation, competition), which may further contribute to non-random distributions observed among microbial taxa (e.g., Horner-Devine et al., 2007). Examining co-occurrence patterns has the potential to unveil ecological
pro-20
cesses that structure bacterial communities. Specifically, patterns of co-occurrence may reveal to what extent groups of microbes share habitat preferences, to what ex-tent there may be ecological linkages among bacterial taxa and with other planktonic organisms, and the extent of phylogenetic closeness of co-occurring bacterial taxa.
Across northern landscapes, both regional (e.g., climate and the degradation state
25
BGD
12, 10233–10269, 2015
Co-occurrence patterns in aquatic
bacterial communities
J. Comte et al.
Title Page
Abstract Introduction
Conclusions References
Tables Figures
◭ ◮
◭ ◮
Back Close
Full Screen / Esc
Printer-friendly Version Interactive Discussion
Discussion
P
a
per
|
Discussion
P
a
per
|
Discussion
P
a
per
|
Discussion
P
a
per
|
them suitable models to investigate the co-occurrence patterns among bacterial taxa as well their network relationships within microbial consortia. The main objectives of this study were to characterize the ecological linkages within microbial communities as a response to permafrost thawing. Our hypotheses were that (i) bacterial communities follow co-occurrence patterns along the permafrost degradation gradient, due to
dis-5
tinct habitat preferences among bacteria, and (ii) these habitat preferences relate to differences in the phylogenetic structure of bacterial communities.
To test the above hypotheses, we employed high-throughput sequencing of the 16S rRNA gene to determine the composition of bacterial communities in thaw ponds and lakes of Nunavik (Quebec, Canada) along a North–South permafrost degradation
gra-10
dient. In addition, we sampled rock-basin lakes that were under the same regional climate but whose formation was not related to climate change. We investigated the relationships among bacterial taxa and local environmental conditions by means of network analysis, which has been applied with success elsewhere to evaluate micro-bial distribution patterns (Barberan et al., 2012; Peura et al., 2015; Steele et al., 2011)
15
and responses to environmental perturbation (Araújo et al., 2011). We then examined the potential linkages between the bacteria and phytoplankton, autotrophic picoplank-ton and zooplankpicoplank-ton biomass in the ponds.
2 Methods
2.1 Study sites and sampling
20
Surface water from 29 thermokarst ponds was collected from 1 to 13 August 2012 in two types of permafrost landscapes. Thaw ponds were located in the vicinity of Whapmagoostui–Kuujjuarapik (W–K: lat. 55◦15′N, long. 77◦45′W) and Umiujaq (lat. 56◦32′N, long. 76◦33′W), within four valleys in the eastern Canadian subarctic, Nunavik: the Sasapimakwananisikw River valley (SAS) and the Kwakwatanikapistikw
25
per-BGD
12, 10233–10269, 2015
Co-occurrence patterns in aquatic
bacterial communities
J. Comte et al.
Title Page
Abstract Introduction
Conclusions References
Tables Figures
◭ ◮
◭ ◮
Back Close
Full Screen / Esc
Printer-friendly Version Interactive Discussion
Discussion
P
a
per
|
Discussion
P
a
per
|
Discussion
P
a
per
|
Discussion
P
a
per
|
mafrost coverage; see Bhiry et al., 2011 for details); and the Sheldrake River valley (BGR) and Nastapoka River valley (NAS) that are in discontinuous permafrost land-scapes (10–50 % permafrost coverage). In addition, we sampled 5 rock-basin lakes as “reference lakes” (RBL) in catchments near the W–K village as a fifth “valley”; these waters occupy glacially scoured basins, and their origin is not related to permafrost
5
degradation.
At each site, temperature, conductivity, dissolved oxygen and pH were measured us-ing a 600R multiparametric probe (YSI, Yellow Sprus-ings, OH, USA). Water for dissolved organic carbon (DOC) and Chlorophylla(Chla) was filtered through a MilliQ water pre-rinsed 47 mm diameter, 0.22 µm pore size acetate filters and GF/F filters respectively
10
(Whatman, GE Healthcare Life Sciences, Little Chalfont, Buckinghamshire, UK). Water samples for total phosphorus (TP) and total nitrogen (TN) were preserved with H2SO4
(0.15 % final concentration) until further analyses.
Samples for zooplankton were collected using a 35 µm net and fixed in ethanol (final concentration: 75 %,v/v), and stored in cold (4◦C) dark conditions until analysis by
15
inverted microscopy. Microbial abundance samples for flow cytometry (FCM) analysis were further collected and fixed with glutaraldehyde (final concentration: 2 %,v/v) and stored frozen at−80◦C until analysis.
2.2 Chemical and plankton analyses
DOC and nutrient analyses were conducted at the Institut National de la Recherche
20
Scientifique, Centre Eau Terre Environnement (INRS-ETE, Quebec City, QC, Canada). DOC concentrations were analyzed on a Shimadzu TOC-5000A carbon analyzer and nutrients were analyzed using standard methods (Stainton et al., 1977). Colored dissolved organic matter (CDOM) was measured by spectrophotometric analysis of absorption at 254 nm by water filtered through 0.2 µm pore-size filters and the
dis-25
solved aromatic carbon content was determined using the SUVA254 index (Weishaar
BGD
12, 10233–10269, 2015
Co-occurrence patterns in aquatic
bacterial communities
J. Comte et al.
Title Page
Abstract Introduction
Conclusions References
Tables Figures
◭ ◮
◭ ◮
Back Close
Full Screen / Esc
Printer-friendly Version Interactive Discussion
Discussion
P
a
per
|
Discussion
P
a
per
|
Discussion
P
a
per
|
Discussion
P
a
per
|
Phytoplankton biomass was estimated as Chlorophyllaconcentrations (Chla), which were determined using high performance liquid chromatography (ProStar HPLC sys-tem, Varian, Palo Alto, CA, USA) following the procedures described in (Bonilla et al., 2005). Zooplankton, specifically copepods, rotifers and cladocerans, were enumer-ated following the Utermöhl procedure (1958) and inverted microscopy (Zeiss Axiovert,
5
Carl Zeiss Microscopy GmbH, Jena, Germany). Bacteria, picocyanobacteria and au-totrophic picoeukaryotes were enumerated using a FACScalibur flow cytometer (BD, Mississauga, ON, Canada), equipped with an argon laser, at the lowest flow rate (12 µL min−1), using 1 µm yellow green microspheres (Polysciences Inc, Warrington, PA, USA) in suspension as an internal standard. Bead concentration was controlled
10
using Truecount Absolute counting tubes (BD, Mississauga, ON, Canada). Bacteria were stained by adding 20 µL of a 50X SYBR Green I (Life Technologies, Thermo Fisher Scientific, Waltham, MA, USA) to 500 µL of sample for 10 min in the dark. Bac-terial cells were then discriminated on the basis of their green fluorescence (FL1) and side scatter signals (SSC) while excited at 488 nm, whereas autotrophic
picoeukary-15
otes and picocyanobacteria were discriminated on the basis of their red fluorescence (FL3) with a threshold in orange (FL2) and SSC. The resulting data were analyzed using the CellQuest Pro software with manual gating.
2.3 Bacterial community composition
Bacterial community composition (BCC) was determined by 454-pyrosequencing of
20
the V6–V8 regions of the 16S rRNA gene. In brief, water was sequentially filtered through a 20 µm mesh net to remove larger organisms, a 47 mm diameter, 3 µm pore size polycarbonate filter (Whatman) and a 0.2 µm pore size Sterivex unit (EMD Mil-lipore, Billerica, MA, USA) using a peristaltic pump. The filters were preserved with 1.8 mL of RNAlater (Life Technologies) and stored at −80◦C until further processing.
25
sepa-BGD
12, 10233–10269, 2015
Co-occurrence patterns in aquatic
bacterial communities
J. Comte et al.
Title Page
Abstract Introduction
Conclusions References
Tables Figures
◭ ◮
◭ ◮
Back Close
Full Screen / Esc
Printer-friendly Version Interactive Discussion
Discussion
P
a
per
|
Discussion
P
a
per
|
Discussion
P
a
per
|
Discussion
P
a
per
|
rate 20 µL PCR reactions using 1 µL of template (3 concentrations: 1, 0.5, and 0.2×) and a Phusion high-fidelity DNA polymerase kit (New England Biolabs, Whitby, ON, USA), and reverse 1406R and forward 969F primers with sample specific tags as in Comeau et al. (2011). Amplicons were purified using a PCR purification kit from Feldan (QC, Canada), quantified spectrophotometrically (Nanodrop, ND-1000,
Wilm-5
ington, DE, USA) and sequenced using Roche/454 GS FLX Titanium technology at Plateforme d’Analyses Génomiques, Institut de biologie intégrative et des systèmes, Université Laval (Québec, Canada). The raw reads have been deposited in the NCBI database under the accession number SRP044372.
All sequence data processing was within the QIIME v1.8.0 pipeline (Caporaso et al.,
10
2010b). Reads were first pre-processed by removing those with a length shorter than 300 nucleotides. The remaining reads were then processed through QIIME denoiser. Denoised sequence reads were quality controlled and chimeras were detected using UPARSE (Edgar, 2013). Operational taxonomic unit (OTU) sequence representatives were aligned using PyNAST (Caporaso et al., 2010a) with the pre-aligned Greengenes
15
16S core set (DeSantis et al., 2006) as a template and taxonomically classified us-ing Mothur Bayesian classifier (Schloss et al., 2009). The reference database was the SILVA reference database (Pruesse et al., 2007) modified to include sequences from our in-house, curated northern 16S rRNA gene sequence database. Sequences clas-sified as plastid or mitochondrial 16S were removed from the analyses.
20
2.4 Phylogenetic analyses
All phylogenetic analyses were based on a phylogenetic tree constructed with an ap-proximate maximum-likelihood (ML) approach using FastTree v.2.1 (Price et al., 2010) following the procedures described in Monier et al. (2015). UniFrac dw4000 (weighted) and duw4000 (unweighted) distances (Lozupone and Knight, 2005) among the different
25
BGD
12, 10233–10269, 2015
Co-occurrence patterns in aquatic
bacterial communities
J. Comte et al.
Title Page
Abstract Introduction
Conclusions References
Tables Figures
◭ ◮
◭ ◮
Back Close
Full Screen / Esc
Printer-friendly Version Interactive Discussion
Discussion
P
a
per
|
Discussion
P
a
per
|
Discussion
P
a
per
|
Discussion
P
a
per
|
assessed using 1000 jackknife replicates (on 75 % subsets). β-Diversity significance was assessed using UniFrac Monte Carlo significance test on dw4000 with 10 000 randomizations, as implemented in QIIME.
We then investigated the phylogenetic diversity (Faith, 1992) of these communities along with other species diversity metrics such as species richness and evenness
(Hel-5
mus et al., 2007) using the R package “picante” v1.5 (Kembel et al., 2010). Community phylogenetic structure was investigated with the calculation of the net relatedness index (NRI) that measures the phylogenetic relatedness for each community. Specifically NRI determines if OTUs are more closely related to co-occurring relatives than expected by chance (Webb et al., 2002).
10
2.5 Statistical analyses
All statistical analyses were carried out using R 3.0.3 (R Core Team, 2014). Abiotic and biotic environmental variables were log-transformed, with the exception of pH (al-ready on a log scale). All analyses were performed on the subsampled dataset (4000 sequences per sample) with a total number of 2166 OTUs.
15
Dissimilarities in community composition among the different valleys were visualized using cluster and principal coordinate analyses. A rank abundance plot was generated to identify the bacterial dominants.
The taxonomic uniqueness of sites as well as the taxa that contribute the most to these compositional differences were evaluated by means of local contribution to
20
beta-diversity (LCBD; Legendre and De Cáceres, 2013). Differences in LCBD, phy-logenetic diversity, species richness and structure across spatial scales were tested using ANOVA followed by Tukey’s HSD test and regression models to identify links between site uniqueness and environmental variables.
Significant associations between the abundance of bacterial OTUs and the five
val-25
leys were further assessed by correlation indices (as a measure of habitat prefer-ences), including the point biserial correlation statisticrpband its group-equalized value
permuta-BGD
12, 10233–10269, 2015
Co-occurrence patterns in aquatic
bacterial communities
J. Comte et al.
Title Page
Abstract Introduction
Conclusions References
Tables Figures
◭ ◮
◭ ◮
Back Close
Full Screen / Esc
Printer-friendly Version Interactive Discussion
Discussion
P
a
per
|
Discussion
P
a
per
|
Discussion
P
a
per
|
Discussion
P
a
per
|
tions) tested the null hypothesis that the abundance of OTUs in ponds of a given valley was not different from their abundances in ponds located in other valleys. Correction for multi-testing was applied using the method of Benjamini and Hochberg (1995) that con-trols the false discovery rate and is a less stringent condition than Bonferroni. OTUs that were significantly associated with valleys were submitted to BLASTn search in NCBI
5
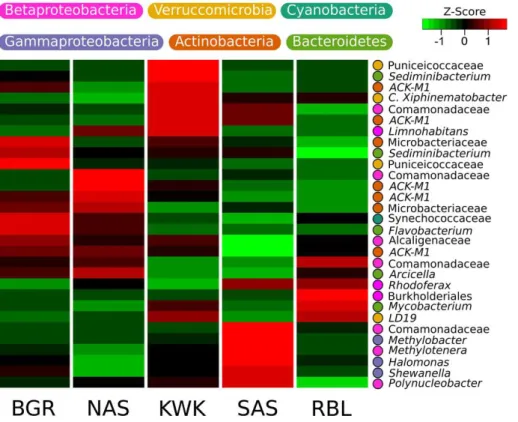
GenBank (http://blast.ncbi.nlm.nih.gov/Blast.cgi) to identify the lowest level of classifi-cation possible. A heatmap was produced to examine the variability in the ecological preference among the 30 most abundant taxa.
2.6 Co-occurrence patterns
Co-occurrence analyses were performed using the overall dataset and each of the
10
datasets for the 5 individual valleys. The data were filtered by using only those OTUs with a minimum of 20 reads and that were detected in at least three different ponds. This filtering step removed poorly represented OTUs and reduced the network com-plexity, resulting in a core community of 294 OTUs.
Randomness in co-occurrence of OTUs in the regional and individual valley datasets
15
was tested in a null model using the quasiswap algorithm (Miklós and Podani, 2004) andC-score metric (Stone and Roberts, 1990) under 50 000 simulations. SES (stan-dardized effect size) was used as a measure of OTU segregation as described Heino and Grönroos (2013) in order to determine whether this may relate to the overall en-vironmental heterogeneity, the heterogeneity in biotic and abiotic variables separately,
20
or to specific environmental variables. Environmental heterogeneity was determined using homogenization of group dispersion (Anderson et al., 2006) and defined as the mean distances of ponds to the centroid (central point) of each valley. Analyses were conducted on Euclidean distances on standardized variables and based on 1000 per-mutations.
25
BGD
12, 10233–10269, 2015
Co-occurrence patterns in aquatic
bacterial communities
J. Comte et al.
Title Page
Abstract Introduction
Conclusions References
Tables Figures
◭ ◮
◭ ◮
Back Close
Full Screen / Esc
Printer-friendly Version Interactive Discussion
Discussion
P
a
per
|
Discussion
P
a
per
|
Discussion
P
a
per
|
Discussion
P
a
per
|
a: phytoplankton biomass, BA: bacterial abundance, PC: picocyanobacteria, PE: au-totrophic picoeukaryotes, Rot: rotifers, Clad: cladocerans, Cop: copepods) data were also included in the network. For each environmental variable, any missing data were estimated as the mean for the corresponding valley and all data were then normalized by subtracting the mean value for the overall study and dividing by the corresponding
5
standard deviation.
To examine associations between the bacterial OTUs and their environment, we ana-lyzed the correlations of the OTUs with each other and with biotic and abiotic variables using the maximal information coefficient (MIC; Reshef et al., 2011). The MIC value indicates the strength of the relationship between two variables and is analogous to
10
R2in general linear models. Computational work was carried out using MINE (Reshef et al., 2011). Following the procedure described in Peura et al. (2015), relationships withp <0.05 were selected to construct networks, which corresponded to a MIC cutoff of 0.44 depending on the number of samples in our dataset. Parameters for analysis were set to default, and false discovery rates (Benjamini and Hochberg, 1995) were
15
below 0.03. MIC matrices were translated into networks using Cytoscape 3.2.0 (Shan-non et al., 2003). Nodes represented bacterial OTUs as well as both biotic and abiotic variables, which were connected by edges that denote the strength of the relationship between two variables (MIC). The topology of the resulting undirected network was investigated using the package igraph (Csardi and Nepusz, 2006) in R and compared
20
to an Erdős–Rényi random network of similar size. Following (Peura et al., 2015), high degree nodes were defined as “hubs” and the implication of their removal for network topology was evaluated. Networks were then visualized in Gephi 0.8.2 (Bastian et al., 2009) using the Fruchterman Reingold layout algorithm. Unconnected nodes were re-moved along with self-loops and duplicated edges.
BGD
12, 10233–10269, 2015
Co-occurrence patterns in aquatic
bacterial communities
J. Comte et al.
Title Page
Abstract Introduction
Conclusions References
Tables Figures
◭ ◮
◭ ◮
Back Close
Full Screen / Esc
Printer-friendly Version Interactive Discussion
Discussion
P
a
per
|
Discussion
P
a
per
|
Discussion
P
a
per
|
Discussion
P
a
per
|
3 Results
3.1 Bacterial phylogenetic structure
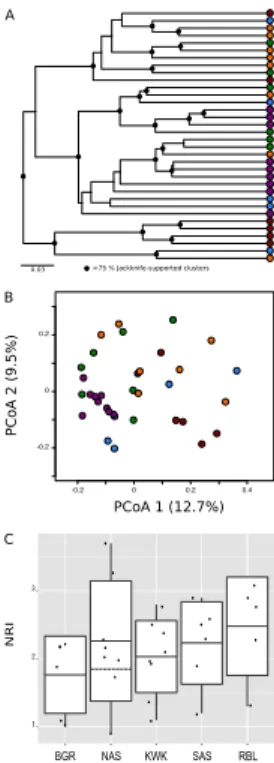
The phylogenetic composition of bacterial communities differed significantly among valleys (dw4000, UniFrac weighted significance test; p≤0.01). The clustering and principal coordinate analyses (PCoA) based on weighted UniFrac distances (dw4000;
5
Fig. 1a) showed that communities originating from SAS and to a lesser extent KWK were more similar to each other than those recovered from outside the respective valley. Permafrost landscape type had a moderate, significant, effect on phylogenetic composition (Permutational analysis of variance on dw4000;R2=0.31,P =0.001). In particular, the phylogenetic composition of communities originating from ponds located
10
in the discontinuous landscape (BGR and NAS valleys) varied more compared to those of other valleys (Fig. 1b). The reference lakes did not group together, likely reflecting their disparate catchments. There was significant clustering of ponds according to lo-cation in the analysis based on OTU presence or absence (Permutational analysis of variance on duw4000; R2=0.51; P =0.001). Cluster analysis based on unweighted
15
UniFrac distances indicated a stronger clustering according to permafrost landscape type by comparison with weighted UniFrac distances (SI Fig. 1; UniFrac unweighted significance test,p≤0.01). The discrepancy between dw4000 and duw4000 patterns indicated the presence of a few but highly abundant OTUs within the different valleys (SI Fig. 2). In fact, only 18 OTUs had a>1 % contribution to the total number of sequence
20
reads.
Community phylogenetic analysis based on NRI indices showed that all site clusters had significant phylogenetic structure (positive NRI values; one samplettest,t=18.9, df=33,P <0.0001; SI Table 1), indicating that bacterial communities within each valley were more closely related to each other than expected by chance. There was no
signif-25
BGD
12, 10233–10269, 2015
Co-occurrence patterns in aquatic
bacterial communities
J. Comte et al.
Title Page
Abstract Introduction
Conclusions References
Tables Figures
◭ ◮
◭ ◮
Back Close
Full Screen / Esc
Printer-friendly Version Interactive Discussion
Discussion
P
a
per
|
Discussion
P
a
per
|
Discussion
P
a
per
|
Discussion
P
a
per
|
the majority of the ponds located within the valley. Ponds located within the SAS valley showed significantly higher phylogenetic species richness and diversity than the KWK, NAS and BGR valleys (PSR:P =0.002,F =5.6,R2=0.36; PD:P <0.0001,F =11.3, R2=0.55).
3.2 Spatial bacterial taxonomic distribution
5
The local contribution toβ-diversity (LCBD) values indicated the compositional unique-ness of local bacterial communities. One-way ANOVA showed that pond location had a significant influence on compositional uniqueness (F =2.8,R2=0.27,P =0.04), with the rock basin lakes having the highest LCBD estimates (SI Fig. 3). There was high vari-ability among ponds within the same valley, and there was no significant difference in
10
taxonomic uniqueness among permafrost valleys. Stepwise backward selection iden-tified the best regression model for LCBD as a function of environmental variables, with four environmental variables (F =3.2, R2=0.22, P =0.03): DOC, conductivity, SUVA254and Chl-a.Sites with a high degree of taxonomic uniqueness had high DOC content and conductivity but low level Chl a. SUVA254 made no significant
contribu-15
tion to the model (P =0.07), and there was no relationship between LCBD, species richness and distance to the closest neighbor.
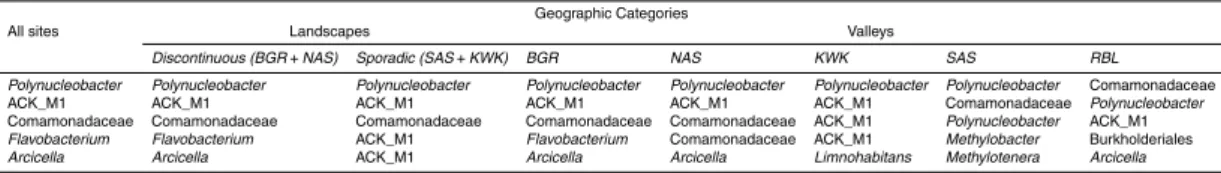
The thaw pond communities were dominated by OTUs that were assigned to Be-taproteobacteria, particularly the order Burkholderiales that was well represented in all communities (35.4 % of the total number of reads). Actinobacteria (24.5 % of total
20
reads) were mainly represented by OTUs assigned to the family ACK-M1 (60.5 % of Actinobacteria reads). Among Bacteroidetes, which accounted for up to 15.7 % of the total number of reads, Shingobacteriales were highly represented and were dominated by the family Chitinophagaceae that contributed up to 4.7 % of total number of reads. Other dominant OTUs were within the Verrucomicrobia (6.8 % of total reads), including
25
BGD
12, 10233–10269, 2015
Co-occurrence patterns in aquatic
bacterial communities
J. Comte et al.
Title Page
Abstract Introduction
Conclusions References
Tables Figures
◭ ◮
◭ ◮
Back Close
Full Screen / Esc
Printer-friendly Version Interactive Discussion
Discussion
P
a
per
|
Discussion
P
a
per
|
Discussion
P
a
per
|
Discussion
P
a
per
|
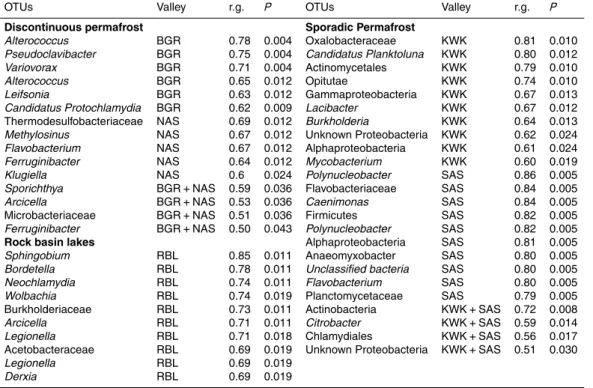
the 2166 OTUs (SI Fig. 4). Specifically, 272 OTUs (11.3 % of the 2166 detected in this dataset) showed a significant association in the indicator value analysis (the point biserial statistic r.g.) considering habitat combinations. Among the 272 OTUs showing a significant habitat preference, 246 were associated with a single valley: 13, 12, 31, 99 and 91 OTUs were associated with the BGR, NAS, KWK, SAS and RBL valleys
5
respectively. Four OTUs were associated with the discontinuous permafrost landscape and three with the sporadic permafrost landscape (Table 2). There were distinctions between ponds located in the sporadic vs. discontinuous permafrost landscapes. In particular, methanotrophs were prominent within the sporadic permafrost landscape type: Methylotenera and Methylobacter were among the five most abundant taxa at
10
SAS sites and the methanotrophic VerrucomicrobiaLD19(in the class Methylacidiphi-lae) was one of the most abundant taxa at the KWK site (Fig. 2).
3.3 Bacterial co-occurrence patterns
To test for differences in co-occurrence patterns between microbial communities across the permafrost landscape, we first selected OTUs that had at least 20 reads and were
15
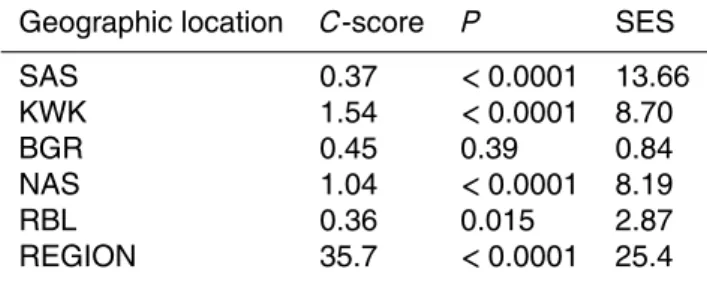
detected in at least 3 different ponds. The bacterial OTUs were not randomly dis-tributed among the different valleys when considering the entire region (C-score=35.7, P <0.0001, SES=25.4). At the individual valley scale, the OTUs were not randomly distributed among ponds except for BGR valley (Table 3). No significant relationship was detected between the level of OTUs segregation, determined by SES, and the
20
overall environmental heterogeneity, and both abiotic and biotic heterogeneity. In ad-dition, no significant relationship between SES and individual environmental variables was detected.
The OTU co-occurrence patterns as well as the relationships with both biotic and abiotic variables were investigated by network analysis. In general, correlations among
25
(au-BGD
12, 10233–10269, 2015
Co-occurrence patterns in aquatic
bacterial communities
J. Comte et al.
Title Page
Abstract Introduction
Conclusions References
Tables Figures
◭ ◮
◭ ◮
Back Close
Full Screen / Esc
Printer-friendly Version Interactive Discussion
Discussion
P
a
per
|
Discussion
P
a
per
|
Discussion
P
a
per
|
Discussion
P
a
per
|
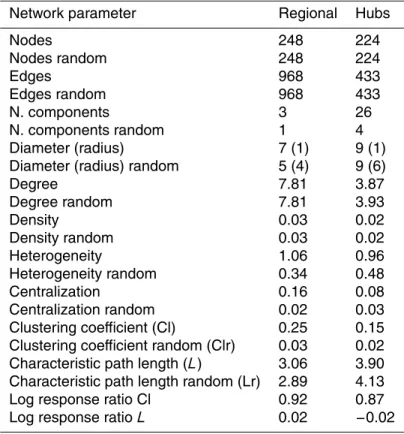
totrophic picoeukaryotes) variables were observed. The topology of the networks is presented in Table 4. For the whole regional network, a total of 248 nodes and 968 edges were detected, which was fragmented in 3 components including 2 small com-ponents composed of 2 and 3 nodes (SI Fig. 5). The observed characteristic path length of 3.06 and clustering coefficient of 0.25 were both greater than estimates
orig-5
inating from the random network of similar size. In addition, the observed:random net-work clustering coefficient ratio (log response ratio of 0.92) showed that the network had “small world” properties; i.e., the nodes were more connected than expected in a random network (Table 4). The frequency distribution of nodes followed a power law function, which indicated that the network was composed of few highly connected
10
nodes, as opposed to an even distribution of connectivity.
Four main bacterial phyla were well represented in the networks: Proteobacteria (83 nodes), Bacteroidetes (57 nodes), Actinobacteria (42 nodes), and Verrucomicro-bia (24 nodes). The average node degree for each phylum did not follow the pattern observed for abundance, such that the mean node degree was 7.8, 6.2, 10.6, 8.2 for
15
Proteobacteria, Bacteroidetes, Actinobacteria, and Verrucomicrobia respectively. This in turn showed that the phylum of Actinobacteria, despite its moderate presence in the regional network in comparison to Proteobacteria and Bacteroidetes, was composed of highly connected members. Although edges between nodes that referred to bacte-rial OTUs dominated the network, connection between bactebacte-rial OTUs and both biotic
20
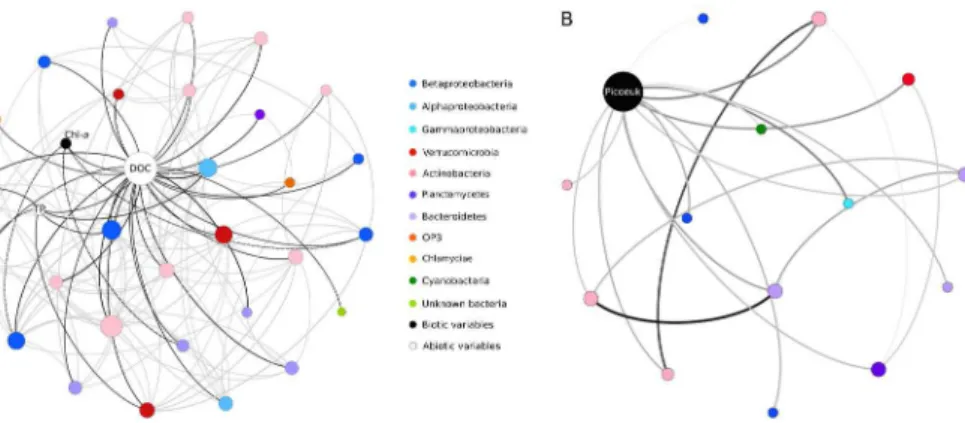
and abiotic variables were detected (SI Fig. 5). For example, conductivity and DOC were amongst the most connected nodes, illustrating their importance in the network. The subnetwork built around DOC showed a diverse bacterial consortium with a slight dominance of Actinobacteria (Fig. 3a). Autotrophic picoeukaryotes were the most con-nected node among biotic variables. The subnetwork built around that variable showed
25
BGD
12, 10233–10269, 2015
Co-occurrence patterns in aquatic
bacterial communities
J. Comte et al.
Title Page
Abstract Introduction
Conclusions References
Tables Figures
◭ ◮
◭ ◮
Back Close
Full Screen / Esc
Printer-friendly Version Interactive Discussion
Discussion
P
a
per
|
Discussion
P
a
per
|
Discussion
P
a
per
|
Discussion
P
a
per
|
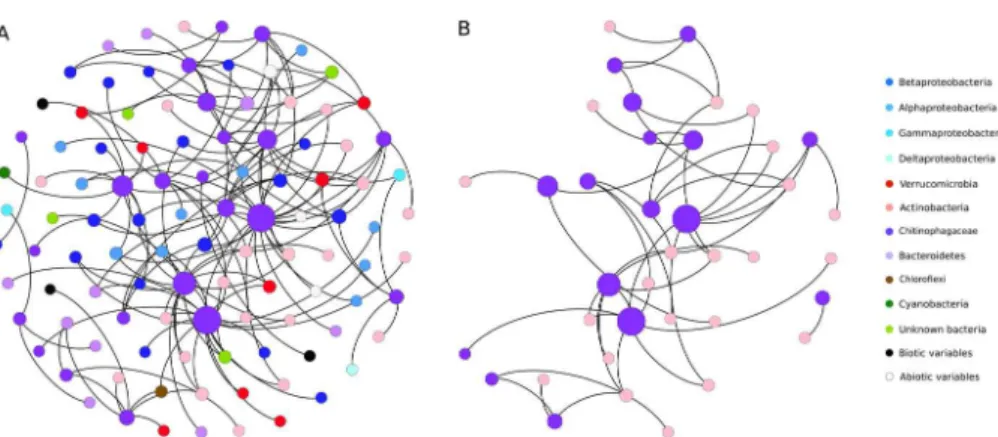
DOC, dissolved oxygen, conductivity, abundance of picoeukaryotes, cladocerans and rotifers (Fig. 4a) and had recurrent, strong co-occurrences with Actinobacteria (Fig. 4b). We further investigated the implications of the removal of the top 24 connected OTU nodes (hubs), which represented a removal of 10 % of nodes and the results showed a high level of fragmentation of the network and a drop in node degree (Table 4, SI
5
Fig. 6).
Analysis of the network hubs further showed that the top 24 were mainly composed of Actinobacteria OTUs, in particular members of Actinomycetales and Acidimicro-biales. In addition, OTUs assigned to Betaproteobacteria represented a large fraction of these highly connected OTUs including the typical freshwaterLimnohabitans, whereas
10
Verruccomicrobia and Bacteroidetes were represented by only a few highly connected OTUs. Interestingly, the anaerobic photosynthetic sulphur bacterium Chloroflexi was also identified as a hub in the overall network (SI Table 2).
4 Discussion
The main goal of the present study was to identify co-occurrence patterns among
bac-15
terial communities in thaw ponds and lakes in the changing subarctic landscape. Con-sistent with our first hypothesis, there was a non-random distribution of bacterial taxa across the distinct valleys sampled in this study. The results showed that thaw ponds communities from the same valley, especially those located in the sporadic permafrost landscape, tended to be more similar in terms of bacterial community composition
20
than communities originating from ponds located in other valleys. Furthermore, the thaw ponds differed taxonomically from the rock-basin reference lakes, with specific bacterial OTUs associated with a particular valley or permafrost landscape type. Con-trary to our second hypothesis, that differences in habitat preferences among bacterial communities were related to distinct phylogenetic structure, we found no evidence for
25
BGD
12, 10233–10269, 2015
Co-occurrence patterns in aquatic
bacterial communities
J. Comte et al.
Title Page
Abstract Introduction
Conclusions References
Tables Figures
◭ ◮
◭ ◮
Back Close
Full Screen / Esc
Printer-friendly Version Interactive Discussion
Discussion
P
a
per
|
Discussion
P
a
per
|
Discussion
P
a
per
|
Discussion
P
a
per
|
The same bacterial phyla occurred throughout the region, and variability among ponds in the same valley was greater than the differences among valleys.
4.1 Local community composition uniqueness and habitat preference among
bacterial communities
Non-random distribution patterns among bacterial taxa were detected, indicating that
5
bacterial taxa in our study region tended to co-occur more than expected by chance. Non-random assembly patterns indicate the dominance of deterministic processes such as environmental filtering in shaping community composition (Horner-Devine et al., 2007). The bacterial communities of freshwater ecosystems elsewhere (Eiler et al., 2011), as well as in certain terrestrial (Barberan et al., 2012) and marine (Steele
10
et al., 2011) ecosystems, have also been reported to have distributional patterns that relate to the environment. Such patterns may depend on niche breadth and competitive abilities (Székely et al., 2012), grazing and viral lysis susceptibilities (Chow et al., 2014; Miki, 2008) and dispersal capabilities (Fahlgren et al., 2010; Hervàs and Casamayor, 2009).
15
No significant relationship was found between distribution patterns and environmen-tal heterogeneity. This was unexpected, as previous studies have shown that thaw ponds and lakes are heterogeneous environments with marked differences in com-munity composition across the different valleys associated with distinct environmental variables (Crevecoeur et al., 2015). In agreement with Heino and Grönroos (2013),
20
we suggest that the relationship between distribution pattern and environmental het-erogeneity may be scale-dependent such that environmental hethet-erogeneity may have effects on the bacterial taxa distribution patterns at the overall study region scale and not at the valley scale as tested here. The results did show differences in the phyloge-netic composition of bacterial communities among the different valleys, which highlight
25
BGD
12, 10233–10269, 2015
Co-occurrence patterns in aquatic
bacterial communities
J. Comte et al.
Title Page
Abstract Introduction
Conclusions References
Tables Figures
◭ ◮
◭ ◮
Back Close
Full Screen / Esc
Printer-friendly Version Interactive Discussion
Discussion
P
a
per
|
Discussion
P
a
per
|
Discussion
P
a
per
|
Discussion
P
a
per
|
bacterial communities and processes (Kritzberg et al., 2006). Along with the variations in permafrost degradation state across the study region, there were also differences among valleys in terms of availability and origin of carbon subsidies. The northern sites are located within the discontinuous permafrost area where most of the soil remains frozen and is thus not available for microbial degradation, while in the southern
spo-5
radic area, permafrost is highly degraded (Bouchard et al., 2014) and large amounts of ancient permafrost carbon may be available for microbial processes. Consistent with this pattern, elevated concentrations and high rates of CO2 and CH4 emission to the
atmosphere have been reported among the southern sites within the most degraded area of permafrost (Laurion et al., 2010; Deshpande et al., 2015). In addition, SAS
10
sites originated from palsas (organic permafrost mounds) and were likely different in DOC composition relative to other valleys, where the ponds were formed by the thaw-ing of lithalsas (mineral permafrost mounds). This may in turn explain the significantly higher bacterial richness and diversity observed in SAS thaw ponds communities and why functional specialists such as the methanotrophsMethylobacter and
Methyloten-15
erawere amongst the most abundant taxa detected in this valley (Fig. 2).
4.2 Bacterial phylogenetic structure
The mean NRI across all communities was significantly greater than zero. This pro-vides evidence for a dominant role of environmental filtering on community composi-tion (Kembel, 2009). The corollary is that a set of environmental variables constrained
20
community composition, resulting in taxa that were closer phylogenetically and more ecologically similar than if stochastic processes drove community assembly. Similar re-sults were obtained for microbial community studies in the ocean (Monier et al., 2015) and on groundwater communities (Stegen et al., 2012).
No significant difference in NRI was found among the different valleys, but this result
25
BGD
12, 10233–10269, 2015
Co-occurrence patterns in aquatic
bacterial communities
J. Comte et al.
Title Page
Abstract Introduction
Conclusions References
Tables Figures
◭ ◮
◭ ◮
Back Close
Full Screen / Esc
Printer-friendly Version Interactive Discussion
Discussion
P
a
per
|
Discussion
P
a
per
|
Discussion
P
a
per
|
Discussion
P
a
per
|
suspended clay particles and low phytoplankton concentrations, which may have fa-vored certain environmental specialists. The rock-basin waters had higher NRI values than the thaw ponds, indicating that their assemblages were more ecologically similar to each other than those originating from thaw ponds and lakes. This could relate to their respective histories in that the rock- basin lakes originate from deglaciation
fol-5
lowed by retreat of the Tyrell Sea ca. 8000 years ago and have thus been exposed to longer term ecological processes. In contrast, the high environmental heterogeneity in the permafrost landscape is consistent with the higher degree of community related-ness observed among thaw ponds.
The extent of permafrost erosion (permafrost landscape type) appeared to influence
10
phylogenetic structure. When controlling for the two outliers mentioned above (NAS-A and N(NAS-AS-B), the northern communities (BGR, N(NAS-AS) were more phylogenetically overdispersed (lower NRIs) than the thaw ponds located in valleys from sporadic per-mafrost (KWK, SAS). This suggests that taxa from SAS valley (and to a lesser extent KWK), tend to be more ecologically similar to each other than those from northern
15
valleys. These findings are in line with studies elsewhere that showed that clustered communities are mainly retrieved from environments that have constrained environ-mental conditions (Monier et al., 2015).
4.3 Network associations
The extent to which closely related bacteria taxa may coexist is still a subject of
consid-20
erable discussion (Mayfield and Levine, 2010). Previous studies on aquatic microbial communities have shown that closely related taxa have coherent temporal dynamics and share similar ecological niches (Andersson et al., 2009; Eiler et al., 2011). Co-occurrence networks enable the depiction and visualization of co-Co-occurrence patterns among OTUs, and they provide a way of identifying potential ecological niches within
25
BGD
12, 10233–10269, 2015
Co-occurrence patterns in aquatic
bacterial communities
J. Comte et al.
Title Page
Abstract Introduction
Conclusions References
Tables Figures
◭ ◮
◭ ◮
Back Close
Full Screen / Esc
Printer-friendly Version Interactive Discussion
Discussion
P
a
per
|
Discussion
P
a
per
|
Discussion
P
a
per
|
Discussion
P
a
per
|
and with environmental variables have been reported (Barberan et al., 2012; Chow et al., 2014; Eiler et al., 2011; Steele et al., 2011).
Our results point toward the importance of environmental filtering for community as-sembly in thaw ponds and lakes. In co-occurrence networks, correlations between OTUs and environmental variables highlight the conditions that may favor particular
5
assemblages. Specifically, our co-occurrence networks identified two abiotic variables (DOC and conductivity) to be among the most connected nodes (SI Fig. 5b), and these variables separated according to landscape type: the northern ponds located in the dis-continuous permafrost landscape had high conductivity and low DOC, whereas south-ern sites within the sporadic permafrost landscape had high DOC and lower
conductiv-10
ity. The analysis of the DOC subnetwork showed that only a few OTUs were significantly and directly related to DOC; these included Actinobacteria, some methanotrophs and taxa involved in the degradation of complex organic polymers (Fig. 3a). Among phy-logenetically related microbes, unique combinations tended to co-occur (Fig. 4a). For example, some OTUs assigned to the Chitinophagaceae appeared to be significantly
15
related to different abiotic and biotic variables, which in turn suggested niche separa-tion.
In addition to the bottom-up factors that shape bacterial communities, recent work on microbial networks has highlighted the role of top down processes such as graz-ing and viral lysis in affecting prokaryotic community structure and co-occurrence
20
patterns (Chow et al., 2014; Steele et al., 2011). In the present study, autotrophic picoeukaryote abundance (degree=14) was the most connected biotic node. Only autrophic picoeukaryotes were enumerated in this study, and although some may have a mixotrophic grazing capacity, their network importance may be the result of other factors, for example the release of photosynthate or their occurrence under conditions
25
BGD
12, 10233–10269, 2015
Co-occurrence patterns in aquatic
bacterial communities
J. Comte et al.
Title Page
Abstract Introduction
Conclusions References
Tables Figures
◭ ◮
◭ ◮
Back Close
Full Screen / Esc
Printer-friendly Version Interactive Discussion
Discussion
P
a
per
|
Discussion
P
a
per
|
Discussion
P
a
per
|
Discussion
P
a
per
|
via the production of acetate by fermentation processes (Chin and Janssen, 2002). They were also associated with the Chitinophagaceae, a group known to be involved in the degradation of chitin and other complex polymeric organic matter (del Rio et al., 2010), the methanotroph Methylotenera and picocyanobacteria, suggesting complex interdependencies or environmental selection by common variables
5
In general, relationships among microbes dominated the network, rather than those between microbes and abiotic or biotic environmental parameters (SI Fig. 5). There was overlap in terms of community composition among the different valleys (Fig. 1), with shared dominant taxa (Table 1, Fig. S2). Although this may indicate that some OTUs may respond similarly to specific environmental factors and outcompete others,
10
some associations may be the result of substrate interdependencies. One example is the relationship between bacteria able to degrade chitin and others that take up the resulting hydrolysis products (Beier and Bertilsson, 2013). Bacteria in the Chitinopha-gaceae were well represented in our study area, and have also been found in other cold terrestrial environments (Franzetti et al., 2013; Ganzert et al., 2011). The subnetwork
15
built around this group showed that these bacteria are linked to other phyla (Fig. 4a), notably Actinobacteria (Fig. 4b). The dominants were assigned to clade Ac1, which is known to include specialists that use hydrolysis products from chitinolytic bacteria (Beier and Bertilsson, 2011).
The microbial networks for the thaw ponds had “small world” properties, with only
20
a few, highly connected nodes. This property would render the networks more resilient to environmental change, but vulnerable to the loss of these keystone species (Mon-toya et al., 2006). The bacterial hubs were identified as typical freshwater, terrestrial and marine taxa (SI Table 2), and some of them were assigned to taxa involved in key biogeochemical processes such as nitrogen fixation and degradation of complex
25
BGD
12, 10233–10269, 2015
Co-occurrence patterns in aquatic
bacterial communities
J. Comte et al.
Title Page
Abstract Introduction
Conclusions References
Tables Figures
◭ ◮
◭ ◮
Back Close
Full Screen / Esc
Printer-friendly Version Interactive Discussion
Discussion
P
a
per
|
Discussion
P
a
per
|
Discussion
P
a
per
|
Discussion
P
a
per
|
the hub taxa identified in this study could be defined as a keystone microbial species (SI Table 2). For example, the nitrogen-fixing bacterium Beijerinckia was among the most connected node in the co-occurrence network despite its low relative abundance.
5 Conclusions
The thaw ponds and lakes sampled in the present study showed large variability in their
5
bacterial community structure, even among sites in a single valley. This underscores the heterogeneous nature of permafrost aquatic environments, and is consistent with their known limnological variability. A small number of taxa occurred in high abundance and dominated many of the communities; these northern dominants included members of the betaproteobacterial order Burkholdiales and the Actinobacterial family ACK-M1;
10
other dominants included members of the Bacteroidetes family Chitinophagaceae and Verrucomicrobia, including the obligate anaerobeOpitutus.Despite this variability and the existence of common taxa, there were taxonomic differences among different val-leys and between permafrost landscape types, implying some degree of habitat selec-tion.
15
The bacterial networks similarly showed differences among valleys, corresponding at least in part to differences in DOC and conductivity. These networks were composed of a limited number of highly connected OTUs. This “small world network” property would render these communities more resilient to environmental change, but sensitive to the loss of these hub OTUs. With ongoing global warming, these waters are likely to
ex-20
perience the effects of increased permafrost erosion and associated changes in their chemical environment, including shifts in DOC and conductivity. If such changes even-tually cause the loss of keystone species that form the hubs of the present microbial networks, there would be a major disruption of thaw pond community structure, with potentially large biogeochemical consequences.
BGD
12, 10233–10269, 2015
Co-occurrence patterns in aquatic
bacterial communities
J. Comte et al.
Title Page
Abstract Introduction
Conclusions References
Tables Figures
◭ ◮
◭ ◮
Back Close
Full Screen / Esc
Printer-friendly Version Interactive Discussion
Discussion
P
a
per
|
Discussion
P
a
per
|
Discussion
P
a
per
|
Discussion
P
a
per
|
The Supplement related to this article is available online at doi:10.5194/bgd-12-10233-2015-supplement.
Acknowledgements. We are grateful to M. Bartosiewicz, B. Deshpande, A. Matveev, A. Przytulska-Bartosiewicz as well as C. Tremblay from Whapmagoostui-Kuujjuarapik CEN sta-tion and the pilots of Canadian Helicopter Ltd., for their assistance in the field. We are also 5
grateful to Paschale N. Begin for zooplankton enumeration, Marie-Josée Martineau for pigment analyses, Isabelle Laurion (INRS-ETE) for flow cytometry and INRS-ETE for chemical analy-ses. Computing support from CLUMEQ/Compute Canada, aid from A. Monier for bioinformatics and phylogenetic analyses and advices from A. Eiler for network analyses were appreciated. We acknowledge the Natural Sciences and Engineering Council (NSERC) of Canada funding 10
for Discovery grants to WFV and CL and Discovery Frontier (ADAPT) grant to WFV, the sup-port from the Network of Centres of Excellence program ArcticNet to WFV and CL, and the Canadian Research Chair Program to WFV. Additional support from Fonds de Recherche du Québec Nature et Technologies (FRQNT) to CEN is acknowledged. JC was partially supported by a FRQNT postdoctoral fellowships and the EnviroNorth CREATE program from NSERC. 15
References
Abnizova, A., Siemens, J., Langer, M., and Boike, J.: Small ponds with major impact: the rel-evance of ponds and lakes in permafrost landscapes to carbon dioxide emissions, Global Biogeochem. Cy., 26, doi:10.1029/2011GB004237, 2012.
Anderson, M. J., Ellingsen, K. E., and McArdle, B. H.: Multivariate dispersion as a measure of 20
beta diversity, Ecol. Lett., 9, 683–693, doi:10.1111/j.1461-0248.2006.00926.x, 2006.
Andersson, A. F., Riemann, L., and Bertilsson, S.: Pyrosequencing reveals contrasting sea-sonal dynamics of taxa within Baltic Sea bacterioplankton communities, ISME J., 4, 171–181, doi:10.1038/ismej.2009.108, 2009.
Andresen, C. G. and Lougheed, V. L.: Disappearing Arctic tundra ponds: fine-scale analysis of 25
surface hydrology in drained thaw lake basins over a 65 year period (1948–2013), J. Geo-phys. Res.-Biogeo., 120, doi:10.1002/2014JG002778, 2015.
BGD
12, 10233–10269, 2015
Co-occurrence patterns in aquatic
bacterial communities
J. Comte et al.
Title Page
Abstract Introduction
Conclusions References
Tables Figures
◭ ◮
◭ ◮
Back Close
Full Screen / Esc
Printer-friendly Version Interactive Discussion
Discussion
P
a
per
|
Discussion
P
a
per
|
Discussion
P
a
per
|
Discussion
P
a
per
|
Barberan, A., Bates, S. T., Casamayor, E. O., and Fierer, N.: Using network analysis to explore co-occurrence patterns in soil microbial communities, ISME J., 6, 343–351, doi:10.1038/ismej.2011.119, 2012.
Bastian, M., Heymann, S., and Jacomy, M.: Gephi: an open source software for exploring and manipulating networks, ICWSM, 8, 361–362, 2009.
5
Beier, S. and Bertilsson, S.: Uncoupling of chitinase activity and uptake of hydrolysis products in freshwater bacterioplankton, Limnol. Oceanogr., 56, 1179–1188, 2011.
Beier, S. and Bertilsson, S.: Bacterial chitin degradation-mechanisms and ecophysiological strategies, Front. Microbiol., 4, 149, doi:10.3389/fmicb.2013.00149, 2013.
Benjamini, Y. and Hochberg, Y.: Controlling the false discovery rate: a practical and powerful 10
approach to multiple testing, J. Roy. Stat. Soc. B, 57, 289–300, 1995.
Bhiry, N., Delwaide, A., Allard, M., Bégin, Y., Filion, L., Lavoie, M., Nozais, C., Payette, S., Pienitz, R., Saulnier-Talbot, É., and Vincent, W. F.: Environmental change in the Great Whale River region, Hudson Bay: five decades of multidisciplinary research by Centre d’études nordiques (CEN), Ecoscience 18, 182–203, 2011.
15
Bonilla, S., Villeneuve, V., and Vincent, W. F.: Benthic and planktonic algal communities in a high arctic lake: pigment structure and contrasting responses to nutrient enrichment, J. Phycol., 41, 1120–1130, 2005.
Bouchard, F., Francus, P., Pienitz, R., Laurion, I., and Feyte, S.: Subarctic thermokarst ponds: investigating recent landscape evolution and sediment dynamics in thawed permafrost of 20
northern Québec (Canada), Arct. Antarct. Alp. Res., 46, 251–271, doi:10.1657/1938-4246-46.1.251, 2014.
Caporaso, J. G., Bittinger, K., Bushman, F. D., DeSantis, T. Z., Andersen, G. L., and Knight, R.: PyNAST: a flexible tool for aligning sequences to a template alignment, Bioinformatics, 26, 266–267, doi:10.1093/bioinformatics/btp636, 2010a.
25
Caporaso, J. G., Kuczynski, J., Stombaugh, J., Bittinger, K., Bushman, F. D., Costello, E. K., Fierer, N., Peña, A. G., Goodrich, J. K., Gordon, J. I., Huttley, G. A., Kelley, S. T., Knights, D., Koenig, J. E., Ley, R. E., Lozupone, C. A., McDonald, D., Muegge, B. D., Pirrung, Meg, Reeder, J., Sevinsky, J. R., Turnbaugh, P. J., Walters, W. A., Widmann, J., Yatsunenko, T., Zaneveld, J., and Knight, R.: QIIME allows analysis of high-throughput community sequenc-30
BGD
12, 10233–10269, 2015
Co-occurrence patterns in aquatic
bacterial communities
J. Comte et al.
Title Page
Abstract Introduction
Conclusions References
Tables Figures
◭ ◮
◭ ◮
Back Close
Full Screen / Esc
Printer-friendly Version Interactive Discussion
Discussion
P
a
per
|
Discussion
P
a
per
|
Discussion
P
a
per
|
Discussion
P
a
per
|
Chin, K. J. and Janssen, P. H.: Propionate formation by Opitutus terraein pure culture and in mixed culture with a hydrogenotrophic methanogen and implications for carbon fluxes in anoxic rice paddy soil, Appl. Environ. Microb., 68, 2089–2092, 2002.
Chow, C.-E. T., Kim, D. Y., Sachdeva, R., Caron, D. A., and Fuhrman, J. A.: Top-down controls on bacterial community structure: microbial network analysis of bacteria, T4-like viruses and 5
protists, ISME J., 8, 816–829, doi:10.1038/ismej.2013.199, 2014.
Comeau, A. M., Li, W. K. W., Tremblay, J.-É., Carmack, E. C., and Lovejoy, C.: Arctic Ocean microbial community structure before and after the 2007 record sea ice minimum, PLoS ONE, 6, e27492, doi:10.1371/journal.pone.0027492.s012, 2011.
Crevecoeur, S., Vincent, W. F., Comte, J., and Lovejoy, C.: Bacterial community structure across 10
environmental gradients in permafrost thaw ponds: methanotroph-rich ecosystems, Front. Microbiol., 6, 192, doi:10.3389/fmicb.2015.00192, 2015.
Csardi, G. and Nepusz, T.: The igraph software package for complex network research, Inter. J. Complex Sys., 1695, 1–9, 2006.
De Cáceres, M. and Legendre, P.: Associations between species and groups of sites: indices 15
and statistical inference, Ecology, 90, 3566–3574, 2009.
del Rio, T. G., Abt, B., Spring, S., Lapidus, A., Nolan, M., Tice, H., Copeland, A., Cheng, J.-F., Chen, J.-F., Bruce, D., Goodwin, L., Pitluck, S., Ivanova, N., Mavromatis, K., Mikhailova, N., Pati, A., Chen, A., Palaniappan, K., Land, M., Hauser, L., Chang, Y.-J., Jeffries, C. D.,
Chain, P., Saunders, E., Detter, J. C., Brettin, T., Rohde, M., Göker, M., Bristow, J., Eisen, 20
J. A., Markowitz, V., Hugenholtz, P., Kyrpides, N. C., Klenk, H.-P., and Lucas, S.: Complete genome sequence ofChitinophaga pinensistype strain (UQM 2034), Stand. Genomic Sci., 2, 87–95, doi:10.4056/sigs.661199, 2010.
DeSantis, T. Z., Hugenholtz, P., Larsen, N., Rojas, M., Brodie, E. L., Keller, K., Huber, T., Dalevi, D., Hu, P., and Andersen, G. L.: Greengenes, a chimera-checked 16S rRNA gene 25
database and workbench compatible with ARB, Appl. Environ. Microb., 72, 5069–5072, doi:10.1128/AEM.03006-05, 2006.
Deshpande, B., MacIntyre, S., Matveev, A., and Vincent, W. F.: Oxygen dynamics in permafrost thaw lakes: anaerobic bioreactors in the Canadian subarctic, Limnol. Oceanogr., in press, doi:10.1002/lno.10126, 2015.
30
BGD
12, 10233–10269, 2015
Co-occurrence patterns in aquatic
bacterial communities
J. Comte et al.
Title Page
Abstract Introduction
Conclusions References
Tables Figures
◭ ◮
◭ ◮
Back Close
Full Screen / Esc
Printer-friendly Version Interactive Discussion
Discussion
P
a
per
|
Discussion
P
a
per
|
Discussion
P
a
per
|
Discussion
P
a
per
|
Edgar, R. C.: UPARSE: highly accurate OTU sequences from microbial amplicon reads, Nat. Methods, 10, 996–998, doi:10.1038/nmeth.2604, 2013.
Eiler, A., Heinrich, F., and Bertilsson, S.: Coherent dynamics and association networks among lake bacterioplankton taxa, ISME J., 6, 330–342, doi:10.1038/ismej.2011.113, 2011.
Fahlgren, C., Hagstrom, A., Nilsson, D., and Zweifel, U. L.: Annual variations in the di-5
versity, viability, and origin of airborne bacteria, Appl. Environ. Microb., 76, 3015–3025, doi:10.1128/AEM.02092-09, 2010.
Faith, D. P.: Conservation evaluation and phylogenetic diversity, Biol. Conserv., 61, 1–10, 1992. Franzetti, A., Tatangelo, V., Gandolfi, I., Bertolini, V., Bestetti, G., Diolaiuti, G., D’Agata, C.,
Mihalcea, C., Smiraglia, C., and Ambrosini, R.: Bacterial community structure on two alpine 10
debris-covered glaciers and biogeography of Polaromonas phylotypes, ISME J., 7, 1483– 1492, doi:10.1038/ismej.2013.48, 2013.
Ganzert, L., Lipski, A., Hubberten, H.-W., and Wagner, D.: The impact of different soil param-eters on the community structure of dominant bacteria from nine different soils located on Livingston Island, South Shetland Archipelago, Antarctica, FEMS Microbiol. Ecol., 76, 476– 15
491, doi:10.1111/j.1574-6941.2011.01068.x, 2011.
Grosse, G., Jones, B., and Arp, C.: Thermokarst lakes, drainage, and drained basins, in: Trea-tise on Geomorphology, Volume 8, edited by: Shroder, J. F., Academic Press, San Diego, 325–353, 2013.
Heino, J. and Grönroos, M.: Does environmental heterogeneity affect species co-occurrence in
20
ecological guilds across stream macroinvertebrate metacommunities? Ecography, 36, 926– 936, doi:10.1111/j.1600-0587.2012.00057.x, 2013.
Helmus, M. R., Bland, T. J., Williams, C. K., and Ives, A. R.: Phylogenetic measures of biodi-versity, Am. Nat., 169, E68–E83, doi:10.1086/511334, 2007.
Hervàs, A. and Casamayor, E. O.: High similarity between bacterioneuston and airborne bac-25
terial community compositions in a high mountain lake area, FEMS Microbiol. Ecol., 67, 219–228, doi:10.1111/j.1574-6941.2008.00617.x, 2009.
Horner-Devine, M. C., Silver, J. M., Leibold, M. A., Bohannan, B. J., Colwell, R. K., Fuhrman, J. A., Green, J. L., Kuske, C. R., Martiny, J. B., and Muyzer, G.: A comparison of taxon co-occurrence patterns for macro-and microorganisms, Ecology, 88, 1345–1353, 30
BGD
12, 10233–10269, 2015
Co-occurrence patterns in aquatic
bacterial communities
J. Comte et al.
Title Page
Abstract Introduction
Conclusions References
Tables Figures
◭ ◮
◭ ◮
Back Close
Full Screen / Esc
Printer-friendly Version Interactive Discussion
Discussion
P
a
per
|
Discussion
P
a
per
|
Discussion
P
a
per
|
Discussion
P
a
per
|
Kembel, S. W.: Disentangling niche and neutral influences on community assembly: assess-ing the performance of community phylogenetic structure tests, Ecol. Lett., 12, 949–960, doi:10.1111/j.1461-0248.2009.01354.x, 2009.
Kembel, S. W., Cowan, P. D., Helmus, M. R., Cornwell, W. K., Morlon, H., Ackerly, D. D., Blomberg, S. P., and Webb, C. O.: Picante: R tools for integrating phylogenies and ecology, 5
Bioinformatics, 26, 1463–1464, doi:10.1093/bioinformatics/btq166, 2010.
Kritzberg, E. S., Langenheder, S., and Lindström, E. S.: Influence of dissolved organic mat-ter source on lake bacmat-terioplankton structure and function-implications for seasonal dy-namics of community composition, FEMS Microbiol. Ecol., 56, 406–417, doi:10.1111/j.1574-6941.2006.00084.x, 2006.
10
Laurion, I., Vincent, W. F., MacIntyre, S., Retamal, L., Dupont, C., Francus, P., and Pienitz, R.: Variability in greenhouse gas emissions from permafrost thaw ponds, Limnol. Oceanogr., 55, 115, doi:10.4319/lo.2010.55.1.0115, 2010.
Legendre, P. and De Cáceres, M.: Beta diversity as the variance of community data: dissimilarity coefficients and partitioning, Ecol. Lett., 16, 951–963, doi:10.1111/ele.12141, 2013.
15
Lozupone, C. and Knight, R.: UniFrac: a new phylogenetic method for comparing microbial com-munities, Appl. Environ. Microb., 71, 8228–8235, doi:10.1128/AEM.71.12.8228-8235.2005, 2005.
Mayfield, M. M. and Levine, J. M.: Opposing effects of competitive exclusion on the
phylogenetic structure of communities, Ecol. Lett., 13, 1085–1093, doi:10.1111/j.1461-20
0248.2010.01509.x, 2010.
McGuire, A. D., Anderson, L. G., Christensen, T. R., Dallimore, S., Guo, L., Hayes, D. J., Heimann, M., Lorenson, T. D., Macdonald, R. W., and Roulet, N.: Sensitivity of the carbon cycle in the Arctic to climate change, Ecol. Monogr., 79, 523–555, doi:10.1890/08-2025.1, 2009.
25
Miki, T.: A new graphical model for untangling complex relationships among environment, biodi-versity, and ecosystem functioning, Ecol. Res., 24, 937–941, doi:10.1007/s11284-008-0552-7, 2008.
Miklós, I. and Podani, J.: Randomization of presence-absence matrices: comments and new algorithms, Ecology, 85, 86–92, 2004.
30
BGD
12, 10233–10269, 2015
Co-occurrence patterns in aquatic
bacterial communities
J. Comte et al.
Title Page
Abstract Introduction
Conclusions References
Tables Figures
◭ ◮
◭ ◮
Back Close
Full Screen / Esc
Printer-friendly Version Interactive Discussion
Discussion
P
a
per
|
Discussion
P
a
per
|
Discussion
P
a
per
|
Discussion
P
a
per
|
Tyson, G. W.: Discovery of a novel methanogen prevalent in thawing permafrost, Nat. Com-mun., 5, 1–7, doi:10.1038/ncomms4212, 2014.
Monier, A., Comte, J., Babin, M., Forest, A., Matsuoka, A., and Lovejoy, C.: Oceanographic structure drives the assembly processes of microbial eukaryotic communities, ISME J., 9, 990–1002, doi:10.1038/ismej.2014.197, 2015.
5
Montoya, J. M., Pimm, S. L., and Solé, R. V.: Ecological networks and their fragility, Nature, 442, 259–264, doi:10.1038/nature04927, 2006.
Negandhi, K., Laurion, I., Whiticar, M. J., Galand, P. E., Xu, X., and Lovejoy, C.: Small thaw ponds: an unaccounted source of methane in the Canadian High Arctic, edited by V. Shah, PLoS ONE, 8, e78204, doi:10.1371/journal.pone.0078204.s001, 2013.
10
Peura, S., Bertilsson, S., Jones, R. I., and Eiler, A.: Resistant microbial co-occurrence patterns inferred by network topology, Appl. Environ. Microb., 81, 2090–2097, doi:10.1128/AEM.03660-14, 2015.
Price, M. N., Dehal, P. S., and Arkin, A. P.: FastTree 2 – approximately maximum-likelihood trees for large alignments, PLoS ONE, 5, e9490, doi:10.1371/journal.pone.0009490.s003, 15
2010.
R Core Team: R: A language and environment for statistical computing. R Foundation for Sta-tistical Computing, Vienna, Austria, available at: http://www.R-project.org/, 2014.
Reshef, D. N., Reshef, Y. A., Finucane, H. K., Grossman, S. R., McVean, G., Turnbaugh, P. J., Lander, E. S., Mitzenmacher, M., and Sabeti, P. C.: Detecting novel associations in large data 20
sets, Science, 334, 1518–1524, doi:10.1126/science.1205438, 2011.
Rossi, P. G., Laurion, I., and Lovejoy, C.: Distribution and identity of bacteria in subarctic per-mafrost thaw ponds, Aquat. Microb. Ecol., 69, 231–245, doi:10.3354/ame01634, 2013. Schloss, P. D., Westcott, S. L., Ryabin, T., Hall, J. R., Hartmann, M., Hollister, E. B.,
Lesniewski, R. A., Oakley, B. B., Parks, D. H., Robinson, C. J., Sahl, J. W., Stres, B., 25
Thallinger, G. G., Van Horn, D. J., and Weber, C.: Introducing mothur: open-source, platform-independent, community-supported software for describing and comparing microbial com-munities, Appl. Environ. Microb., 75, 7537–7541, doi:10.1128/AEM.01541-09, 2009.
Schuur, E. A., Bockheim, J., Canadell, J. G., Euskirchen, E., Field, C. B., Goryachkin, S. V., Hagemann, S., Kuhry, P., Lafleur, P. M., and Lee, H.: Vulnerability of permafrost car-30