www.biogeosciences.net/13/175/2016/ doi:10.5194/bg-13-175-2016
© Author(s) 2016. CC Attribution 3.0 License.
Co-occurrence patterns in aquatic bacterial communities across
changing permafrost landscapes
J. Comte1,2, C. Lovejoy1,2,3, S. Crevecoeur1,2, and W. F. Vincent1
1Centre d’études nordiques (CEN), Takuvik Joint International Laboratory & Département de biologie, Université Laval, Québec, QC G1V 0A6, Canada
2Institut de Biologie Intégrative et des Systèmes (IBIS), Université Laval, Québec, QC G1V 0A6, Canada 3Québec Océan, Université Laval, Québec, QC G1V 0A6, Canada
Correspondence to:J. Comte ([email protected])
Received: 9 June 2015 – Published in Biogeosciences Discuss.: 8 July 2015
Revised: 2 December 2015 – Accepted: 10 December 2015 – Published: 15 January 2016
Abstract. Permafrost thaw ponds and lakes are widespread across the northern landscape and may play a central role in global biogeochemical cycles, yet knowledge about their mi-crobial ecology is limited. We sampled a set of thaw ponds and lakes as well as shallow rock-basin lakes that are located in distinct valleys along a north–south permafrost degrada-tion gradient. We applied high-throughput sequencing of the 16S rRNA gene to determine co-occurrence patterns among bacterial taxa (operational taxonomic units, OTUs), and then analyzed these results relative to environmental variables to identify variables controlling bacterial community structure. Network analysis was applied to identify possible ecological linkages among the bacterial taxa and with abiotic and biotic variables. The results showed an overall high level of shared taxa among bacterial communities within each valley; how-ever, the bacterial co-occurrence patterns were non-random, with evidence of habitat preferences. There were taxonomic differences in bacterial assemblages among the different val-leys that were statistically related to dissolved organic car-bon concentration, conductivity and phytoplankton biomass. Co-occurrence networks revealed complex interdependen-cies within the bacterioplankton communities and showed contrasting linkages to environmental conditions among the main bacterial phyla. The thaw pond networks were com-posed of a limited number of highly connected taxa. This “small world network” property would render the communi-ties more robust to environmental change but vulnerable to the loss of microbial “keystone species”. These highly con-nected nodes (OTUs) in the network were not merely the nu-merically dominant taxa, and their loss would alter the
orga-nization of microbial consortia and ultimately the food web structure and functioning of these aquatic ecosystems.
1 Introduction
Permafrost is widespread in Arctic and boreal regions (Schuur et al., 2008) and is estimated to contain ca. 1700 Pg of organic carbon (McGuire et al., 2009; Tarnocai et al., 2009). Permafrost thawing and erosion is evident by the northward retreat of the permafrost boundary (Thibault and Payette, 2009). In some northern regions this has led to the expansion of permafrost thaw ponds and lakes (thermokarst systems; Grosse et al., 2013), whereas in other regions there has been a contraction and loss of these waterbodies (e.g., Andresen and Lougheed, 2015). These thermokarst systems are part of circumpolar and global biogeochemical cycles (Abnizova et al., 2012; Walter et al., 2007). Although some are carbon sinks (Walter Anthony et al., 2014), others are net sources of carbon dioxide (CO2)and methane (CH4)to the atmosphere (Walter et al., 2008).
microbial communities in these aquatic systems is there-fore essential for understanding the functional significance of these permafrost thaw systems in the global carbon bud-get.
Aquatic bacterial communities are thought to be se-lected by a combination of bottom-up (resource availabil-ity) and top-down (viral lysis, grazing) controls. Less stud-ied are bacteria–bacteria interactions (facilitation, competi-tion), which may further contribute to nonrandom distribu-tions observed among microbial taxa (e.g., Horner-Devine et al., 2007). Examining co-occurrence patterns has the po-tential to unveil ecological processes that structure bacterial communities. Specifically, patterns of co-occurrence may re-veal to what extent groups of microbes share habitat prefer-ences, to what extent there may be ecological linkages among bacterial taxa and with other planktonic organisms, and the extent of phylogenetic closeness of co-occurring bacterial taxa given that closely related taxa may share life strategies and ecological traits.
Across northern landscapes, both regional (e.g., climate and the degradation state of permafrost) and local (e.g., nu-trients, dissolved organic carbon and oxygen) conditions are likely to influence the distribution of bacterial communities of thaw ponds and lakes. These thermokarst systems show a high degree of limnological (Deshpande et al., 2015) and bacterial heterogeneity (Crevecoeur et al., 2015), making them suitable models to investigate the co-occurrence pat-terns among bacterial taxa as well as their network relation-ships within microbial consortia. The main objectives of this study were to characterize the ecological linkages within mi-crobial communities as a response to permafrost thawing. Our hypotheses were that (i) bacterial communities follow co-occurrence patterns along the permafrost degradation gra-dient, due to distinct habitat preferences among bacteria, and (ii) these habitat preferences relate to differences in the phy-logenetic structure of bacterial communities.
To test the above hypotheses, we employed high-throughput sequencing of the 16S rRNA gene to determine the composition of bacterial communities in thaw ponds and lakes of Nunavik (Québec, Canada) along a north–south per-mafrost degradation gradient. In addition, we sampled rock-basin lakes that were under the same regional climate but whose formation was not related to climate change. We in-vestigated the relationships among bacterial taxa and lo-cal environmental conditions by means of network analysis, which has been applied with success elsewhere to evaluate microbial distribution patterns (Barberan et al., 2012; Peura et al., 2015; Steele et al., 2011) and responses to environmen-tal perturbation (Araújo et al., 2011). We then examined the potential linkages between the bacteria and phytoplankton, phototrophic picoplankton and zooplankton biomass in the ponds and lakes.
2 Methods
2.1 Study sites and sampling
Surface water (0.2 m) from 29 thermokarst ponds was col-lected from 1 to 13 August 2012 in two types of per-mafrost landscapes. Thaw ponds were located in the vicin-ity of Whapmagoostui-Kuujjuarapik (W-K: lat 55◦15′N, long 77◦45′W) and Umiujaq (lat 56◦32′N, long 76◦33′W), within four valleys in the eastern Canadian subarctic, Nunavik, along a north–south permafrost degradation gra-dient as described in Comte et al. (2015): the Sasapimak-wananisikw River valley (SAS) and the Kwakwatanikapis-tikw River valley (KWK), in sporadic, highly degraded per-mafrost landscapes (< 10 % perper-mafrost coverage; see Bhiry et al., 2011, for details), and the Sheldrake River valley (BGR) and Nastapoka River valley (NAS), which are in dis-continuous permafrost landscapes (10–50 % permafrost cov-erage). In addition, we sampled five rock-basin lakes as “ref-erence lakes” (RBL) in catchments near the W-K village as a fifth valley type; these waters occupy glacially scoured basins, and their origin is not related to permafrost degra-dation.
At each site, temperature, conductivity, dissolved oxygen and pH were measured using a 600R multiparametric probe (YSI, Yellow Springs, OH, USA). Water for dissolved or-ganic carbon (DOC) and chlorophylla (Chla) was filtered through Milli-Q water-rinsed 47 mm diameter, 0.22 µm pore size acetate filters and onto GF/F filters, respectively (What-man, GE Healthcare Life Sciences, Little Chalfont, Bucking-hamshire, UK). Water samples for total phosphorus (TP) and total nitrogen (TN) were preserved with H2SO4(0.15 % final concentration) until subsequent analyses.
Samples for zooplankton were collected using a 35 µm net, fixed in ethanol (final concentration: 75 %,v/v), and stored in cold (4◦C) dark conditions until analysis by inverted mi-croscopy. Microbial abundance samples for flow cytometry (FCM) analysis were further collected and fixed with glu-taraldehyde (final concentration: 2 %,v/v) and stored frozen at−80◦C until analysis.
2.2 Chemical and plankton analyses
DOC concentrations were analyzed on a Shimadzu TOC-5000A carbon analyzer and nutrients were analyzed using standard methods (Stainton et al., 1977). Colored dissolved organic matter (CDOM) was measured by spectrophotomet-ric analysis of absorbance at 254 nm by water filtered through 0.2 µm pore size filters and the dissolved aromatic carbon content was determined using the SUVA254index (Weishaar et al., 2003).
al. (2005). Zooplankton, specifically copepods, rotifers and cladocerans, were enumerated following the Utermöhl pro-cedure (1958) and inverted microscopy (Zeiss Axiovert, Carl Zeiss Microscopy GmbH, Jena, Germany). Bacteria, pico-cyanobacteria and phototrophic picoeukaryotes were enu-merated using a FACScalibur flow cytometer (BD, Missis-sauga, ON, Canada), equipped with an argon laser, at the lowest flow rate (12 µL min−1), using 1 µm yellow-green mi-crospheres (Polysciences Inc., Warrington, PA, USA) in sus-pension as an internal standard. Bead concentration was con-trolled using Trucount Absolute counting tubes (BD, Missis-sauga, ON, Canada). Bacteria were stained by adding 20 µL of 50X SYBR Green I (Life Technologies, Thermo Fisher Scientific, Waltham, MA, USA) to 500 µL of sample for 10 min in the dark. Bacterial cells were then discriminated on the basis of their green fluorescence (FL1) and side-scatter signals (SSC) while excited at 488 nm, whereas pho-totrophic picoeukaryotes and picocyanobacteria were dis-criminated from unstained samples on the basis of their red autofluorescence (FL3) with a threshold in orange (FL2) and SSC. The resulting data were analyzed using the CellQuest Pro software with manual gating.
2.3 Bacterial community composition
Bacterial community composition (BCC) was determined by 454-pyrosequencing of the V6–V8 regions of the 16S rRNA gene. In brief, water was sequentially filtered through a 20 µm mesh net to remove larger organisms, a 47 mm di-ameter, 3 µm pore size polycarbonate filter (Whatman) and a 0.2 µm pore size Sterivex unit (EMD Millipore, Billerica, MA, USA) using a peristaltic pump. The filters were pre-served with 1.8 mL of RNA later (Life Technologies) and stored at−80◦C until further processing. For this study, the bacterial community composition of the free-living fraction (< 3 µm) was examined. DNA was extracted from cells col-lected onto Sterivex units using the PowerWater Sterivex DNA Isolation Kit (MO BIO Laboratories Inc., Carlsbad, CA, USA) following the manufacturer’s instructions. Ex-tracted DNA was amplified in three separate 20 µL PCR re-actions using 1 µL of template (three concentrations: undi-luted, 0.5, and 0.2 times diluted) and a Phusion high-fidelity DNA polymerase kit (New England Biolabs, Whitby, ON, USA), as well as reverse 1406R and forward 969F primers with sample-specific tags as in Comeau et al. (2011). Am-plicons were purified using a PCR purification kit from Fel-dan (QC, Canada), quantified spectrophotometrically (Nan-odrop, ND-1000, Wilmington, DE, USA) and sequenced us-ing Roche/454 GS FLX Titanium technology at Plateforme d’Analyses Génomiques, Institut de Biologie Intégrative et des Systèmes, Université Laval (Québec, Canada). The raw reads have been deposited in the NCBI database under the accession number SRP044372.
All sequence data processing was within the QIIME v1.8.0 pipeline (Caporaso et al., 2010b). Reads were first
pre-processed by removing those with a length shorter than 300 nucleotides. The remaining reads were then pro-cessed through a QIIME denoiser. Denoised sequence reads were quality-controlled and chimeras were detected using UPARSE (Edgar, 2013). Operational taxonomic unit (OTU) sequence representatives were aligned using PyNAST (Ca-poraso et al., 2010a) with the pre-aligned Greengenes 16S core set (DeSantis et al., 2006) as a template and taxonomi-cally classified using the Mothur Bayesian classifier (Schloss et al., 2009). The reference database was the SILVA refer-ence database (Pruesse et al., 2007) modified to include se-quences from our in-house, curated northern 16S rRNA gene sequence database (Lovejoy et al., 2015). Sequences classi-fied as plastid or mitochondrial 16S were removed from the analyses.
2.4 Phylogenetic analyses
All phylogenetic analyses were based on a phylogenetic tree constructed with an approximate maximum-likelihood (ML) approach using FastTree v.2.1 (Price et al., 2010) following the procedures described in Monier et al. (2015). UniFrac dw4000 (weighted) and duw4000 (unweighted) distances (Lozupone and Knight, 2005) among the different microbial communities were all computed based on the OTU approxi-mate ML phylogenetic tree. Clustering of UniFrac distances was performed using the unweighted pair group method with arithmetic mean (UPGMA) algorithm, and cluster robustness was assessed using 1000 jackknife replicates (on 75 % sub-sets). Beta-diversity significance was assessed using UniFrac Monte Carlo significance test on dw4000 with 10 000 ran-domizations, as implemented in QIIME.
We investigated community phylogenetic diversity as de-fined by Faith (1992), along with other diversity metrics such as phylogenetic species richness and evenness (Helmus et al., 2007), using the R package “picante” v1.5 (Kembel et al., 2010). Community phylogenetic structure was investigated with the calculation of the net relatedness index (NRI) that measures the phylogenetic relatedness for each community. Specifically NRI determines whether OTUs are more closely related to co-occurring relatives than expected by chance (Webb et al., 2002).
2.5 Statistical analyses
All statistical analyses were carried out using R 3.0.3 (R Core Team, 2014). Abiotic and biotic environmental vari-ables were log-transformed, with the exception of pH (al-ready on a log scale). All analyses were performed on the subsampled data set (4000 sequences per sample) with a to-tal number of 2166 OTUs.
The taxonomic uniqueness of sites as well as the taxa that contribute the most to these compositional differences was evaluated by means of local contribution to beta-diversity (LCBD; Legendre and De Cáceres, 2013). Differences in LCBD, phylogenetic diversity, species richness and structure across spatial scales were tested using ANOVA followed by Tukey’s HSD test and regression models to identify links be-tween site uniqueness and environmental variables.
Significant associations between the abundance of bacte-rial OTUs and the five valleys were further assessed by cor-relation indices (as a measure of habitat preferences), includ-ing the point biserial correlation statisticrpb and its group-equalized value r.g. as defined by De Cáceres and Legen-dre (2009). Permutation tests (1000 permutations) tested the null hypothesis that the abundance of OTUs in ponds of a given valley was not different from their abundances in ponds located in other valleys. Correction for multi-testing was ap-plied using the method of Benjamini and Hochberg (1995) that controls the false discovery rate and is a less stringent condition than Bonferroni. OTUs that were significantly as-sociated with valleys were submitted to BLASTn search in NCBI GenBank (http://blast.ncbi.nlm.nih.gov/Blast.cgi) to identify the lowest level of classification possible. A heat map was produced to examine the variability in the ecologi-cal preference among the 30 most abundant OTUs.
2.6 Co-occurrence patterns
Co-occurrence analyses were performed using the overall data set and each of the data sets for the five individual val-leys. The data were filtered by using only those OTUs with a minimum of 20 reads and that were detected in at least three different ponds. This filtering step removed poorly rep-resented OTUs and reduced the network complexity, result-ing in a core community of 294 OTUs.
Randomness in co-occurrence of OTUs in the regional and individual valley data sets was tested in a null model using the quasiswap algorithm (Miklós and Podani, 2004) andC -score metric (Stone and Roberts, 1990) under 50 000 simu-lations. SES (standardized effect size) was used as a mea-sure of OTU segregation as described in Heino and Grön-roos (2013) in order to determine whether this may relate to the overall environmental heterogeneity, the heterogeneity in biotic and abiotic variables separately, or to specific envi-ronmental variables. Envienvi-ronmental heterogeneity was deter-mined using homogenization of group dispersion (Anderson et al., 2006) and defined as the mean distances of ponds to the centroid (central point) of each valley. Analyses were con-ducted on Euclidean distances on standardized variables and based on 1000 permutations. Similarly, the homogenization of group dispersion method was used to determine whether communities among ponds within a given valley were more similar than within other valleys.
Network analyses were conducted on the filtered OTU data set. In addition, a total of eight physicochemical
vari-ables (DOC; TP; TN; pH; SUVA254; COND: conductivity; T: water temperature; DO: dissolved oxygen concentration) and 7 biotic variables (Chla: phytoplankton biomass; BA: bac-terial abundance; PC: abundance of picocyanobacteria; PE: abundance of phototrophic picoeukaryotes; Rot: abundance of rotifers; Clad: abundance of cladocerans; Cop: abundance of copepods) data were also included in the network. For each environmental variable, any missing data were esti-mated as the mean for the corresponding valley and all data were then normalized by subtracting the mean value for the overall study and dividing by the corresponding standard de-viation.
To examine associations between the bacterial OTUs and their environment, we analyzed the correlations of the OTUs with each other and with biotic and abiotic variables us-ing the maximal information coefficient (MIC; Reshef et al., 2011). The MIC value indicates the strength of the relation-ship between two variables and is analogous toR2in general linear models. MIC does not provide information on the sign of the association between two nodes, and we therefore ex-tracted the linearity metric (MIC-ρ2)from the edges of the network, which indicates the type of association: an MIC-ρ2 value greater than 0.2 implies a strong nonlinear association and likely “non-coexistence” among OTUs (Reshef et al., 2011). Computations were carried out using MINE (Reshef et al., 2011). Following the procedure described in Peura et al. (2015), relationships withp< 0.05 were selected to con-struct networks, which corresponded to a MIC cutoff of 0.44 depending on the number of samples in our data set. Parame-ters for analysis were set to default, and false discovery rates (Benjamini and Hochberg, 1995) were below 0.03. MIC ma-trices were translated into networks using Cytoscape 3.2.0 (Shannon et al., 2003). Nodes represented bacterial OTUs as well as both biotic and abiotic variables, which were con-nected by edges that denote the strength of the relationship between two variables (MIC). The topology of the result-ing undirected network was investigated usresult-ing the package “igraph” (Csardi and Nepusz, 2006) in R and compared to an Erd˝os–Rényi random network of similar size. Following Peura et al. (2015), high degree nodes were defined as “hubs” and the implication of their removal for network topology was evaluated. Networks were then visualized in Gephi 0.8.2 (Bastian et al., 2009) using the Fruchterman–Reingold lay-out algorithm. Unconnected nodes were removed along with self-loops and duplicated edges.
in the ecological preference among the 30 most connected OTUs.
3 Results
3.1 Bacterial phylogenetic structure
The phylogenetic composition of bacterial communities differed significantly among valleys (dw4000, UniFrac weighted significance test; p≤0.01). The clustering and principal coordinate analyses (PCoA) based on weighted UniFrac distances (dw4000; Fig. 1a, b) suggested that com-munities within the SAS valley tend to clustered together, as did the KWK communities. However, a test for homo-geneity of multivariate dispersions did not support this as no significant difference in the distance to group (valley) cen-troid was detected (P =0.39, F =1.08). Permafrost land-scape type had a significant effect on phylogenetic com-position (permutational analysis of variance on dw4000; R2=0.31, P =0.001). The reference lakes did not group together, likely reflecting their disparate catchment prop-erties. The cluster analysis based on unweighted UniFrac distances indicated a stronger clustering according to per-mafrost landscape type (permutational analysis of variance on duw4000; R2=0.51; P =0.001) by comparison with weighted UniFrac distances (Fig. S1 in the Supplement; UniFrac unweighted significance test, p≤0.01). The dis-crepancy between dw4000 and duw4000 patterns indicated the presence of a small number of highly abundant OTUs within different valleys (Fig. S2). In fact, only 18 OTUs had a > 1 % contribution to the total number of sequence reads.
Community phylogenetic analysis based on NRI indices showed that all site clusters had significant phylogenetic structure (positive NRI values; one-sample t test, t=18.9, df =33, P< 0.0001; Table S1 in the Supplement), indi-cating that bacterial communities within each valley were more closely related to each other than expected by chance. There was no significant difference in phylogenetic structure among valleys (ANOVA, P =0.4; Fig. 1c), but there were large differences within individual valleys, with some ponds less phylogenetically clustered than others. For example, the NAS valley two ponds had higher NRI values than the ma-jority of the ponds located within the valley. Ponds located within the SAS valley showed significantly higher phylo-genetic species richness and diversity than the KWK, NAS and BGR valleys (PSR:P =0.002,F =5.6,R2=0.36; PD: P < 0.0001,F =11.3,R2=0.55).
3.2 Spatial bacterial taxonomic distribution
The local contribution to beta-diversity (LCBD) values indi-cated the compositional uniqueness of local bacterial com-munities. One-way ANOVA showed that pond location had a significant influence on compositional uniqueness (F =2.8, R2=0.27,P =0.04), with the rock-basin lakes having the
Figure 1. (a) UPGMA clustering based on weighted and
nor-malized UniFrac distances among bacterial community samples. Clustering statistics were computed using 100 jackknife replicates.
(b)Principal coordinate analysis (PCoA) using UniFrac weighted distance metric. The SAS and KWK valleys are located in sporadic (highly degraded) permafrost landscapes, while the NAS and BGR valleys are located in discontinuous (less degraded) permafrost landscapes, and reference rock-based lakes are located in the RBL valleys.(c)Differences in the phylogenetic structure (NRI, net
highest LCBD estimates (Fig. S3). There was high variabil-ity among ponds within the same valley, and there was no significant difference in taxonomic uniqueness among per-mafrost valleys. Stepwise backward selection identified the best regression model for LCBD as a function of environ-mental variables (Table S2), with four environenviron-mental vari-ables (F =3.2, R2=0.22, P =0.03): DOC, conductivity, SUVA254 and Chla. Sites with a high degree of taxonomic uniqueness had high DOC content and conductivity but low Chlaconcentrations. SUVA254made no significant contribu-tion to the model (P =0.07), and there was no relationship between LCBD, species richness and distance to the closest neighbor.
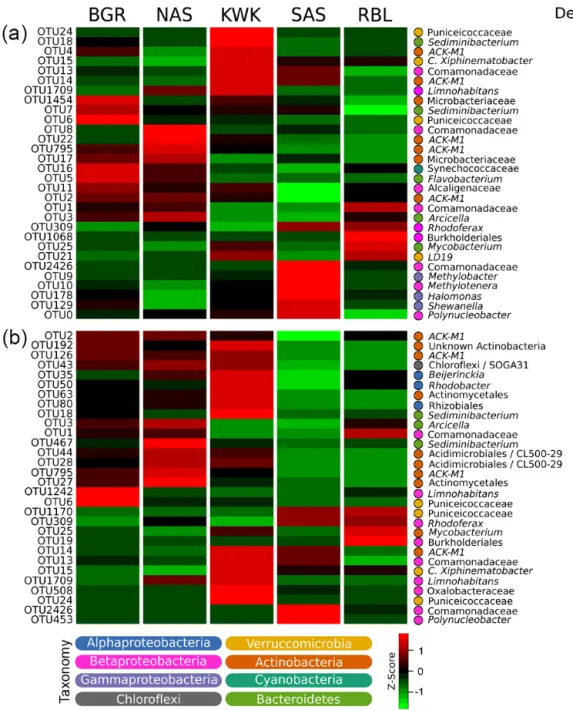
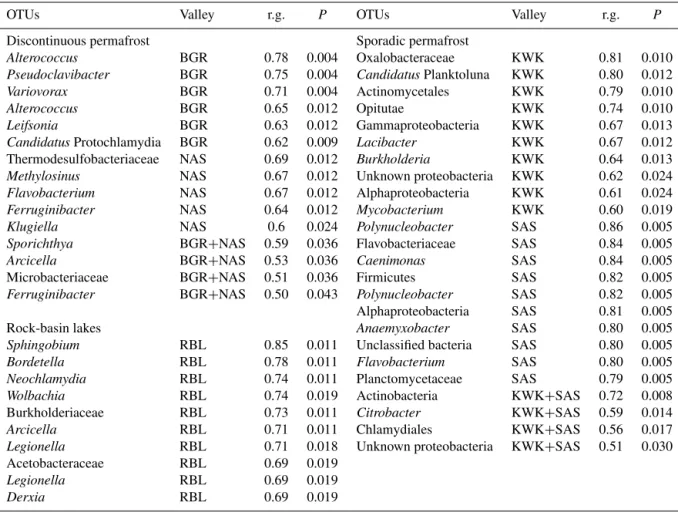
The thaw pond communities were dominated by OTUs that were assigned to Betaproteobacteria, particularly the or-der Burkholor-deriales, which was well represented in all com-munities (35.4 % of the total number of reads). Actinobacte-ria (24.5 % of total reads) were mainly represented by OTUs assigned to the family ACK-M1 (60.5 % of Actinobacte-ria reads). Among Bacteroidetes, which accounted for up to 15.7 % of the total number of reads, Sphingobacteriales were highly represented and were dominated by the family Chitinophagaceae that contributed up to 4.7 % of total num-ber of reads. Other dominant OTUs were within the Ver-rucomicrobia (6.8 % of total reads) (Table 1). Among the 30 most abundant taxa, some were highly associated with a specific valley, whereas others were not detected in cer-tain valleys (Fig. 2a). This pattern remained when consid-ering the ensemble of the 2166 OTUs (Fig. S4). Specifi-cally, 272 OTUs (11.3 % of the 2166 detected in this data set) showed a significant association in the indicator value analysis (the point biserial statistic r.g.) considering habitat combinations. Among the 272 OTUs showing a significant habitat preference, 246 were associated with a single valley: 13, 12, 31, 99 and 91 OTUs were associated with the BGR, NAS, KWK, SAS and RBL valleys, respectively. Four OTUs were associated with the discontinuous permafrost landscape and three with the sporadic permafrost landscape (Table 2). There were distinctions between ponds located in the spo-radic versus discontinuous permafrost landscapes. In partic-ular, OTUs closely related to methanotrophs were prominent within the sporadic permafrost landscape type: OTUs closely related toMethylotenera(OTU 10) andMethylobacter(OTU 9) were among the five most abundant taxa at SAS sites (3.5 and 3.6 % of the total number of SAS reads, respectively) and OTUs assigned to methanotrophic VerrucomicrobiaLD19(in the class Methylacidiphilae) was one of the most abundant at the KWK site (Fig. 2a, 1.4 % of KWK reads).
3.3 Bacterial co-occurrence patterns
To test for differences in co-occurrence patterns between microbial communities across the permafrost landscape, we first selected OTUs that had at least 20 reads and were detected in at least three different ponds. The bacterial
Figure 2. Heat map representation of habitat preference of the 30 most abundant(a)and most connected(b) bacterial OTUs. Habitat
preference was determined by point biserial correlation. The connectivity of OTUs was defined by the degree (number of edges) of nodes from an association network (Fig. S5a). Taxonomic assignment of OTUs is provided at the lowest level of classification possible from the BLASTn search in GenBank.
OTUs were not randomly distributed among the different valleys when considering the entire region (C score=35.7, P < 0.0001, SES=25.4). At the individual valley scale, the OTUs were not randomly distributed among ponds except for BGR valley (Table 3). No significant relationship was de-tected between the level of OTUs segregation, determined by SES, and the overall environmental heterogeneity, and both abiotic and biotic heterogeneity. In addition, no significant relationship between SES and individual environmental vari-ables was detected.
Table 2.Results of indicator species analysis. Valley refers to the valley (or combination of valleys) for which the OTUs obtained the highest correlation. We indicate the correlation value (r.g.) and its statistical significance (P) atα=0.05. Only OTUs with r.g.≥0.6 are presented
when associated with one valley (top 10 are presented for the KWK and SAS valleys). OTUs were classified at their finest taxonomic levels based on similarity to sequences in GenBank.
OTUs Valley r.g. P OTUs Valley r.g. P
Discontinuous permafrost Sporadic permafrost
Alterococcus BGR 0.78 0.004 Oxalobacteraceae KWK 0.81 0.010
Pseudoclavibacter BGR 0.75 0.004 CandidatusPlanktoluna KWK 0.80 0.012
Variovorax BGR 0.71 0.004 Actinomycetales KWK 0.79 0.010
Alterococcus BGR 0.65 0.012 Opitutae KWK 0.74 0.010
Leifsonia BGR 0.63 0.012 Gammaproteobacteria KWK 0.67 0.013
CandidatusProtochlamydia BGR 0.62 0.009 Lacibacter KWK 0.67 0.012
Thermodesulfobacteriaceae NAS 0.69 0.012 Burkholderia KWK 0.64 0.013
Methylosinus NAS 0.67 0.012 Unknown proteobacteria KWK 0.62 0.024
Flavobacterium NAS 0.67 0.012 Alphaproteobacteria KWK 0.61 0.024
Ferruginibacter NAS 0.64 0.012 Mycobacterium KWK 0.60 0.019
Klugiella NAS 0.6 0.024 Polynucleobacter SAS 0.86 0.005
Sporichthya BGR+NAS 0.59 0.036 Flavobacteriaceae SAS 0.84 0.005
Arcicella BGR+NAS 0.53 0.036 Caenimonas SAS 0.84 0.005
Microbacteriaceae BGR+NAS 0.51 0.036 Firmicutes SAS 0.82 0.005
Ferruginibacter BGR+NAS 0.50 0.043 Polynucleobacter SAS 0.82 0.005
Alphaproteobacteria SAS 0.81 0.005 Rock-basin lakes Anaemyxobacter SAS 0.80 0.005
Sphingobium RBL 0.85 0.011 Unclassified bacteria SAS 0.80 0.005
Bordetella RBL 0.78 0.011 Flavobacterium SAS 0.80 0.005
Neochlamydia RBL 0.74 0.011 Planctomycetaceae SAS 0.79 0.005
Wolbachia RBL 0.74 0.019 Actinobacteria KWK+SAS 0.72 0.008
Burkholderiaceae RBL 0.73 0.011 Citrobacter KWK+SAS 0.59 0.014
Arcicella RBL 0.71 0.011 Chlamydiales KWK+SAS 0.56 0.017
Legionella RBL 0.71 0.018 Unknown proteobacteria KWK+SAS 0.51 0.030
Acetobacteraceae RBL 0.69 0.019
Legionella RBL 0.69 0.019
Derxia RBL 0.69 0.019
path length of 3.06 and clustering coefficient of 0.25 were both greater than estimates originating from the random work of similar size. In addition, the observed : random net-work clustering coefficient ratio (log response ratio of 0.92) showed that the network had “small world” properties – i.e., the nodes were more connected than expected in a random network (Table 4). The frequency distribution of nodes fol-lowed a power law function, which indicated that the network was composed of a few highly connected nodes, as opposed to an even distribution of connectivity (Fig. S6).
Four main bacterial phyla were well represented in the net-works: Proteobacteria (83 nodes), Bacteroidetes (56 nodes), Actinobacteria (42 nodes), and Verrucomicrobia (24 nodes). Although edges between nodes that referred to bacterial OTUs dominated the network, connections between bacte-rial OTUs and both biotic and abiotic variables were detected (Fig. S5). For example, conductivity and DOC were amongst the most connected nodes, illustrating their importance in the network. The subnetwork built around DOC showed a di-verse bacterial consortium with a slight dominance of
Acti-Table 3.Results of co-occurrence analyses for the dominant OTUs
(20 reads, 3 sites). Significant results are presented in bold. SES refers to standardized effect size.
Geographic location Cscore P SES
SAS 0.37 < 0.0001 13.66
KWK 1.54 < 0.0001 8.70
BGR 0.45 0.39 0.84
NAS 1.04 < 0.0001 8.19
RBL 0.36 0.015 2.87
REGION 35.7 < 0.0001 25.4
clado-Table 4.Topology of the thermokarst systems co-occurrence net-works. Regional corresponds to a network built around the selected 294 OTUs whereas Hubs refers to a network where the most con-nected 24 OTUs from the whole network (Fig. S5a) were removed prior to this analysis. Random refers to topology characteristics of Erd˝os–Rényi random networks of similar size.
Network parameter Regional Hubs
Nodes 248 224
Nodes random 248 224
Edges 968 433
Edges random 968 433 No. components 3 26 No. components random 1 4 Diameter (radius) 7 (1) 9 (1) Diameter (radius) random 5 (4) 9 (6)
Degree 7.81 3.87
Degree random 7.81 3.93
Density 0.03 0.02
Density random 0.03 0.02 Heterogeneity 1.06 0.96 Heterogeneity random 0.34 0.48 Centralization 0.16 0.08 Centralization random 0.02 0.03 Clustering coefficient (Cl) 0.25 0.15 Clustering coefficient random (Clr) 0.03 0.02 Characteristic path length (L) 3.06 3.90
Characteristic path length random (Lr) 2.89 4.13 Log response ratio Cl 0.92 0.87 Log response ratioL 0.02 −0.02
cerans and rotifers (Fig. 4a) and had recurrent, strong co-occurrences with Actinobacteria, especially with organisms closely related to ACK-M1 (Fig. 4b). The analysis of the linearity of the latter association indicated a positive co-occurrence between OTUs closely related to members affil-iated with the ACK-M1 (aka AcI) group of Actinobacteria and Chitinophagaceae (Fig. 5c). Other examples of strong linkages between OTUs are given in Fig. 5, with illustra-tions of positive co-occurrence (Fig. 5a) and non-coexistence (Fig. 5b).
In general, our results indicated that the most abun-dant OTUs were also the most connected ones (R2=0.25, P < 0.001, Fig. S7). However, some of the most connected nodes (OTUs) had low abundance (Table S3, Fig. 2b). It is worth noting that some of these bacterial hubs showed some level of habitat preference, especially within KWK valley (Fig. 2b). In addition, these “valley-specific” hubs were mainly related to Actinobacteria and Betaproteobacte-ria (Fig. 2b).
We further investigated the implications of the removal of the top 24 connected OTU nodes (hubs), which represented a removal of 10 % of nodes, and the results showed a high level of fragmentation of the network and a drop in node degree (Table 4, Fig. S8).
Analysis of the network hubs further showed that the top 24 were mainly composed of Actinobacteria OTUs, in partic-ular members of Actinomycetales and Acidimicrobiales. In addition, OTUs assigned to Betaproteobacteria represented a large fraction of these highly connected OTUs, including the typical freshwaterLimnohabitans, whereas Verrucomicrobia and Bacteroidetes were represented by only a few highly con-nected OTUs. Interestingly, the anaerobic photosynthetic sul-fur bacteria Chloroflexi were also identified as a hub in the overall network (Table S3).
4 Discussion
The main goal of the present study was to identify co-occurrence patterns among bacterial communities in thaw ponds and lakes in the changing subarctic landscape. Con-sistent with our first hypothesis, there was a nonrandom dis-tribution of bacterial taxa across the distinct valleys sampled in this study. The results showed that thaw ponds commu-nities from the same valley, especially those located in the sporadic permafrost landscape, tended to be more similar in terms of bacterial community composition than communities originating from ponds located in other valleys. Furthermore, the thaw ponds differed taxonomically from the rock-basin reference lakes, with specific bacterial OTUs associated with a particular valley or permafrost landscape type. Contrary to our second hypothesis, that differences in habitat preferences among bacterial communities were related to distinct phylo-genetic structure, we found no evidence for differences in the community phylogenetic relatedness between the differ-ent valleys. The same bacterial phyla occurred throughout the region, and variability among ponds in the same valley was greater than the differences among valleys.
Figure 3.Subnetworks organized around DOC(a)and phototrophic picoeukaryotes(b). Subnetworks were extracted from the entire
co-occurrence network (Fig. S5). In(a), edge color refers to the type of relationship with significant connection between OTUs and both biotic
and abiotic variables presented in black, whereas relationships between bacterial taxa are presented in grey. In(b), edge color is proportional
to the association strength, with strong associations shown in black. The size of the nodes is proportional to node degree (the number of connections that a node has with other nodes).
Figure 4. Subnetworks organized around bacterial OTUs closely related to Chitinophagaceae. Panel(a) presents the ensemble of
co-occurrences between members of Chitinophagaceae and other bacteria. Panel (b)shows the specific linkages between Chitinophagaceae and Actinobacteria. The size of the nodes is proportional to node degree (the number of connections that a node has with other nodes).
fraction of the communities. The latter may represent a sub-stantial part of the total communities given that these water-bodies can contain a large content of suspended solids. Previ-ous studies comparing the compositional patterns in bacterial communities between the free-living and attached fractions showed that these two distinct lifestyle have a similar com-munity composition (Crevecoeur et al., 2015), indicating that the patterns described here may reflect patterns for the entire community.
No significant relationship was found between distribu-tion patterns and environmental heterogeneity. This was un-expected, as previous studies have shown that thermokarst systems are heterogeneous environments with marked differ-ences in community composition across the different valleys associated with distinct environmental variables (Crevecoeur
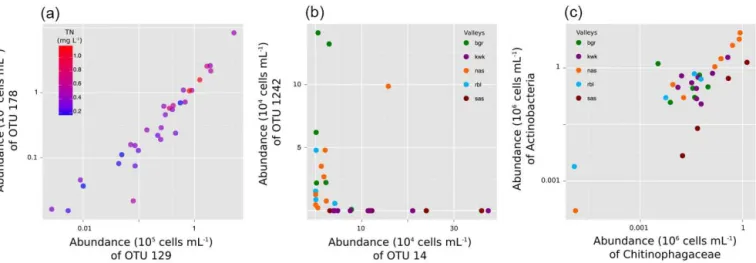
Figure 5.Associations between bacterial OTUs in permafrost thaw ponds and lakes.(a)Co-occurrence between two representatives of
Gammaproteobacteria that is partially explained by total nitrogen. (b)Non-coexistence that is explained by the valley identity. (c)
Co-occurrence between OTUs closely related to Actinobacteria ACK-M1 and Bacteroidetes Chitinophagaceae bacteria.
in permafrost degradation state across the study region, there were also differences among valleys in terms of availability and origin of carbon subsidies. The northern sites are located within the discontinuous permafrost area where most of the soil remains frozen and is thus not available for microbial degradation, while in the southern sporadic area, permafrost is highly degraded (Bouchard et al., 2014) and large amounts of ancient permafrost carbon may be available for microbial processes. Consistent with this pattern, elevated concentra-tions and high rates of CO2and CH4emission to the atmo-sphere have been reported among the southern sites within the most degraded area of permafrost (Laurion et al., 2010; Deshpande et al., 2015). This may in turn explain the sig-nificantly higher bacterial richness and diversity observed in SAS thaw ponds communities and why OTUs assigned to methanotrophic bacteria such asMethylobacterand
Methy-lotenera were amongst the most abundant detected in this
valley (Fig. 2). In addition, SAS sites originated from pal-sas (organic permafrost mounds) and were likely different in DOC composition relative to other valleys, where the ponds were formed by the thawing of lithalsas (mineral permafrost mounds). This is consistent with recent observation of a di-rect link between community composition and the degrada-tion of terrestrially derived DOM (Logue et al., 2015).
4.2 Bacterial phylogenetic structure
The mean NRI across all communities was significantly greater than zero. This provides evidence for a dominant role of environmental filtering on community composition (Kem-bel, 2009). The corollary is that a set of environmental vari-ables constrained community composition, resulting in taxa that were closer phylogenetically and more ecologically sim-ilar than if stochastic processes (including dispersal) drove community assembly. In fact, there is no corridor such as
streams that connects the ponds, and thus local dispersal pro-cesses are unlikely to explain the local phylogenetic structure of the thaw pond communities (Comte et al., 2015). Similar results were obtained for microbial community studies in the ocean (Monier et al., 2015) and on groundwater communities (Stegen et al., 2012).
retrieved from environments that have constrained environ-mental conditions (Monier et al., 2015).
4.3 Network associations
The extent to which closely related bacterial taxa may co-exist is still a subject of considerable discussion (May-field and Levine, 2010). Previous studies on aquatic mi-crobial communities have shown that closely related taxa have coherent temporal dynamics and share similar ecolog-ical niches (Andersson et al., 2009; Eiler et al., 2011). Co-occurrence networks enable the depiction and visualization of co-occurrence patterns among OTUs, and they provide a way of identifying potential ecological niches within mi-crobial consortia. Network analyses have recently been ap-plied to a wide range of microbial communities and biomes, and specific associations among bacterial OTUs and with en-vironmental variables have been reported (Barberan et al., 2012; Chow et al., 2014; Eiler et al., 2011; Steele et al., 2011).
Our results point toward the importance of environmental filtering for community assembly in thaw ponds and lakes. In co-occurrence networks, correlations between OTUs and environmental variables highlight the conditions that may fa-vor particular assemblages. Specifically, our co-occurrence networks identified two abiotic variables (DOC and conduc-tivity) to be among the most connected nodes (Fig. S5b), and these variables separated according to landscape type: the northern ponds located in the discontinuous permafrost land-scape had high conductivity and low DOC, whereas southern sites within the sporadic permafrost landscape had high DOC and lower conductivity (Table S2; further details are given in Comte et al., 2015). The analysis of the DOC subnetwork showed that only a few OTUs were significantly and directly related to DOC; these included OTUs assigned to Actinobac-teria as well as OTUs closely related to bacActinobac-terial methan-otrophs and taxa involved in the degradation of complex or-ganic polymers (Fig. 3a). Among phylogenetically related microbes, unique combinations tended to co-occur (Fig. 4a). For example, some OTUs assigned to the Chitinophagaceae appeared to be significantly related to different abiotic and biotic variables, which in turn suggested niche separation.
In addition to the bottom-up factors that shape bacterial communities, recent work on microbial networks has high-lighted the role of top down processes such as grazing and vi-ral lysis in affecting prokaryotic community structure and co-occurrence patterns (Chow et al., 2014; Steele et al., 2011). In the present study, phototrophic picoeukaryote abundance (degree=14) was the most connected biotic node. Only pho-totrophic picoeukaryotes were enumerated in this study, and although some may have a mixotrophic grazing capacity, their network importance may be the result of other factors, for example the release of photosynthate or their occurrence under conditions that mutually favor both themselves and certain bacterial taxa.
In general, relationships among microbes dominated the network, rather than those between microbes and abiotic or biotic environmental parameters (Fig. S5). There was over-lap in terms of community composition among the differ-ent valleys (Fig. 1), with shared dominant taxa (Table 1, Fig. S2). Although this may indicate that some OTUs may respond similarly to specific environmental factors and out-compete others, some associations may be the result of sub-strate interdependencies. One example is the relationship be-tween bacteria able to degrade chitin and others that take up the resulting hydrolysis products (Beier and Bertilsson, 2013). OTUs closely related to bacteria in the Chitinopha-gaceae, a group known to be involved in the degradation of chitin and other complex polymeric organic matter (del Rio et al., 2010), were well represented in our study area, and have also been found in other cold terrestrial environments (Franzetti et al., 2013; Ganzert et al., 2011). The subnet-work built around this group showed that these OTUs are linked to other phyla (Fig. 4a), notably certain Actinobac-teria (Fig. 4b). The dominants were closely related to clade Ac1, which is known to include specialists that use hydroly-sis products from chitinolytic bacteria (Beier and Bertilsson, 2011). The analysis of linearity of the associations between the corresponding OTUs showed a positive co-occurrence (Fig. 5c), consistent with bacterial network relationships. Al-though other examples of positive co-occurrence among bac-terial OTUs were identified in the data set (Fig. 5a), there was also evidence of “non-coexistence” (sensu Reshef et al., 2011) among certain OTUs: in the northern, less de-graded permafrost valley (BGR), OTU 1242 (Betaproteobac-teria Limnohabitans) dominated, whereas in the southern highly degraded permafrost valleys (SAS, KWK), OTU 14 (Actinobacteria ACK-M1) dominated (Fig. 5b). These trade-offs among OTUs were partially explained by the geographic location of the valleys, suggesting that environmental vari-ables not only drive the composition of the bacterial assem-blages within the individual valleys but may also determine the ecological associations within microbial consortia. Fur-thermore, the positive relationship found between the con-nectivity and the habitat specificity among the most abundant OTUs (Fig. 2a) is most likely driven by the dominance of highly connected OTUs in the southern highly degraded per-mafrost valleys in comparison to the northern less degraded permafrost valleys. In addition, the OTUs retrieved from the southern thaw ponds were closely related to specific bacterial functional groups such as methanotrophs and nitrogen fixing bacteria (Fig. 5).
are involved in key biogeochemical processes such as nitro-gen fixation and degradation of complex polymers, or that are known to be restricted in niche breadth, for example to cold environments. In accordance with Peura et al. (2015), the im-portance of a taxon in a microbial network may be less asso-ciated with its abundance but instead determined by its con-nectivity, as represented by node degree for example. Thus many of the hub taxa identified in this study could be defined as keystone microbial species (Table S3). These “keystone” OTUs identified as hubs were not merely the abundant OTUs (Fig. 2b), but some were rare and potentially important ac-tors for the functioning of these ecosystems. For example, the nitrogen-fixing bacteriumBeijerinckiawas among the most connected nodes in the co-occurrence network despite its low relative abundance. This in turn highlights the potentially im-portant ecological role of diazotrophs in these nutrient-rich aquatic systems.
5 Conclusions
The thaw ponds and lakes sampled in the present study showed large variability in their bacterial community struc-ture, even among waterbodies in a single valley. This under-scores the heterogeneous nature of permafrost aquatic envi-ronments, and is consistent with their known limnological variability. A small number of taxa occurred in high abun-dance and dominated many of the communities; these north-ern dominants included members of the betaproteobacterial order Burkholderiales and the actinobacterial family ACK-M1; other dominants included members of the Bacteroidetes family Chitinophagaceae and Verrucomicrobia. Despite this variability and the existence of common taxa, there were tax-onomic differences among different valleys and between per-mafrost landscape types, implying some degree of habitat se-lection.
The bacterial networks further showed that DOC and con-ductivity played an important role in the co-occurrence pat-terns of bacterial OTUs, corresponding at least in part to differences in these two environmental variables among val-leys (Table S2). Strong positive associations as well as non-coexistence among OTUs were detected, and the resultant networks were composed of a limited number of highly con-nected OTUs. This “small world network” property would render these communities more resistant to environmental change but sensitive to the loss of their hub OTUs, which themselves showed some degree of habitat specificity. With ongoing global warming, these waters are likely to expe-rience the effects of increased permafrost erosion and as-sociated changes in their chemical environment, including shifts in DOC and conductivity. If such changes eventually cause the loss of “keystone species” that form the hubs of the present microbial networks, there would be a major disrup-tion of community structure, with potentially large biogeo-chemical consequences.
The Supplement related to this article is available online at doi:10.5194/bg-13-175-2016-supplement.
Acknowledgements. We are grateful to M. Bartosiewicz, B.
Desh-pande, A. Matveev, A. Przytulska-Bartosiewicz and C. Tremblay from Whapmagoostui-Kuujjuarapik CEN station and the pilots of Canadian Helicopter Ltd. for their assistance in the field. We are also grateful to Paschale N. Bégin for zooplankton enumeration, M.-J. Martineau for pigment analyses, and I. Laurion (INRS-ETE) for flow cytometry. Computing support from CLUMEQ/Compute Canada, aid from A. Monier for bioinformatics and phylogenetic analyses, advice from A. Eiler for network analyses, and insightful comments from the two anonymous reviewers and the editor were also greatly appreciated. We acknowledge the Natural Sciences and Engineering Council (NSERC) of Canada funding for Discovery grants to W. F. Vincent and C. Lovejoy and Discovery Frontier (ADAPT) grant to W. F. Vincent, the support from the Networks of Centres of Excellence program ArcticNet to W. F. Vincent and C. Lovejoy, and the Canadian Research Chairs Program to W. F. Vincent. Additional support from Fonds de Recherche du Québec Nature et Technologies (FRQNT) to CEN is acknowl-edged. J. Comte was partially supported by a FRQNT postdoctoral fellowship and the EnviroNorth CREATE program from NSERC. Edited by: I. Laurion
References
Abnizova, A., Siemens, J., Langer, M., and Boike, J.: Small ponds with major impact: The relevance of ponds and lakes in per-mafrost landscapes to carbon dioxide emissions, Global Bio-geochem. Cy., 26, 1–9, doi:10.1029/2011GB004237, 2012. Andersson, A. F., Riemann, L., and Bertilsson, S.:
Pyrose-quencing reveals contrasting seasonal dynamics of taxa within Baltic Sea bacterioplankton communities, ISME J., 4, 171–181, doi:10.1038/ismej.2009.108, 2009.
Andresen, C. G. and Lougheed, V. L.: Disappearing Arctic tundra ponds: Fine-scale analysis of surface hydrology in drained thaw lake basins over a 65 year period (1948–2013), J. Geophys. Res.-Biogeo., 120, doi:10.1002/2014JG002778, 2015.
Araújo, M. B., Rozenfeld, A., Rahbek, C., and Marquet, P. A.: Us-ing species co-occurrence networks to assess the impacts of cli-mate change, Ecography, 34, 897–908, 2011.
Anderson, M. J., Ellingsen, K. E., and McArdle, B. H.: Multivariate dispersion as a measure of beta diversity, Ecol. Lett., 9, 683–693, doi:10.1111/j.1461-0248.2006.00926.x, 2006.
Barberan, A., Bates, S. T., Casamayor, E. O., and Fierer, N.: Using network analysis to explore co-occurrence pat-terns in soil microbial communities, ISME J., 6, 343–351, doi:10.1038/ismej.2011.119, 2012.
Bastian, M., Heymann, S., and Jacomy, M.: Gephi: an open source software for exploring and manipulating networks, ICWSM, 8, 361–362, 2009.
Lim-nol. Oceanogr., 56, 1179–1188, doi:10.4319/lo.2011.56.4.1179, 2011.
Beier, S. and Bertilsson, S.: Bacterial chitin degradation-mechanisms and ecophysiological strategies, Front. Microbiol., 4, 149, doi:10.3389/fmicb.2013.00149, 2013.
Benjamini, Y. and Hochberg, Y.: Controlling the false discovery rate: a practical and powerful approach to multiple testing, J. Roy. Stat. Soc. B, 57, 289–300, 1995.
Bhiry, N., Delwaide, A., Allard, M., Bégin, Y., Filion, L., Lavoie, M., Nozais, C., Payette, S., Pienitz, R., Saulnier-Talbot, É., and Vincent, W. F.: Environmental change in the Great Whale River region, Hudson Bay: Five decades of multidisciplinary research by Centre d’études nordiques (CEN), Ecoscience, 18, 182–203, 2011.
Bonilla, S., Villeneuve, V., and Vincent, W. F.: Benthic and plank-tonic algal communities in a high arctic lake: Pigment structure and contrasting responses to nutrient enrichment, J. Phycol., 41, 1120–1130, 2005.
Bouchard, F., Francus, P., Pienitz, R., Laurion, I., and Feyte, S.: Subarctic thermokarst ponds: Investigating recent landscape evo-lution and sediment dynamics in thawed permafrost of north-ern Québec (Canada), Arct. Antarct. Alp. Res., 46, 251–271, doi:10.1657/1938-4246-46.1.251, 2014.
Caporaso, J. G., Bittinger, K., Bushman, F. D., DeSantis, T. Z., An-dersen, G. L., and Knight, R.: PyNAST: a flexible tool for align-ing sequences to a template alignment, Bioinformatics, 26, 266– 267, doi:10.1093/bioinformatics/btp636, 2010a.
Caporaso, J. G., Kuczynski, J., Stombaugh, J., Bittinger, K., Bush-man, F. D., Costello, E. K., Fierer, N., Peña, A. G., Goodrich, J. K., Gordon, J. I., Huttley, G. A., Kelley, S. T., Knights, D. Koenig, J. E., Ley, R. E., Lozupone, C. A., McDonald, D., Muegge, B. D., Pirrung, M., Reeder, J., Sevinsky, J. R., Turn-baugh, P. J., Walters, W. A., Widmann, J., Yatsunenko, T., Zaneveld, J., and Knight, R.: QIIME allows analysis of high-throughput community sequencing data, Nat. Methods, 7, 335– 336, doi:10.1038/nmeth.f.303, 2010b.
Chow, C.-E. T., Kim, D. Y., Sachdeva, R., Caron, D. A., and Fuhrman, J. A.: Top-down controls on bacterial community structure: microbial network analysis of bacteria, T4-like viruses and protists, ISME J., 8, 816–829, doi:10.1038/ismej.2013.199, 2014.
Comeau, A. M., Li, W. K. W., Tremblay, J.-É., Carmack, E. C., and Lovejoy, C.: Arctic Ocean microbial community structure before and after the 2007 record sea ice minimum, PLoS ONE, 6, e27492, doi:10.1371/journal.pone.0027492.s012, 2011. Comte, J., Monier, A., Crevecoeur, S., Lovejoy, C., and
Vin-cent, W. F.: Microbial biogeography of permafrost thaw ponds across the changing northern landscape, Ecography, 38, doi:10.1111/ecog.01667, 2015.
Crevecoeur, S., Vincent, W. F., Comte, J., and Lovejoy, C.: Bacte-rial community structure across environmental gradients in per-mafrost thaw ponds: methanotroph-rich ecosystems, Front. Mi-crobiol., 6, 192, doi:10.3389/fmicb.2015.00192, 2015.
Csardi, G. and Nepusz, T.: The igraph software package for com-plex network research, Inter J. Comcom-plex Sys., 1695, 1–9, 2006. De Cáceres, M. and Legendre, P.: Associations between species and
groups of sites: indices and statistical inference, Ecology, 90, 3566–3574, 2009.
del Rio, T. G., Abt, B., Spring, S., Lapidus, A., Nolan, M., Tice, H., Copeland, A., Cheng, J.-F., Chen, F., Bruce, D., Good-win, L., Pitluck, S., Ivanova, N., Mavromatis, K., Mikhailova, N., Pati, A., Chen, A., Palaniappan, K., Land, M., Hauser, L., Chang, Y.-J., Jeffries, C. D., Chain, P., Saunders, E., Detter, J. C., Brettin, T., Rohde, M., Göker, M., Bristow, J., Eisen, J. A., Markowitz, V., Hugenholtz, P., Kyrpides, N. C., Klenk, H.-P., and Lucas, S.: Complete genome sequence ofChitinophaga pinen-sis type strain (UQM 2034), Stand. Genomic Sci., 2, 87–95,
doi:10.4056/sigs.661199, 2010.
DeSantis, T. Z., Hugenholtz, P., Larsen, N., Rojas, M., Brodie, E. L., Keller, K., Huber, T., Dalevi, D., Hu, P., and Andersen, G. L.: Greengenes, a chimera-checked 16S rRNA gene database and workbench compatible with ARB, Appl. Environ. Microb., 72, 5069–5072, doi:10.1128/AEM.03006-05, 2006.
Deshpande, B., MacIntyre, S., Matveev, A., and Vincent, W. F.: Oxygen dynamics in permafrost thaw lakes: Anaerobic biore-actors in the Canadian subarctic, Limnol. Oceanogr., 60, 1656– 1670, doi:10.1002/lno.10126, 2015.
Ducklow, H.: Microbial services: challenges for microbial ecol-ogists in a changing world, Aquat. Microb. Ecol., 53, 13–19, doi:10.3354/ame01220, 2008.
Edgar, R. C.: UPARSE: highly accurate OTU sequences from microbial amplicon reads, Nat. Methods, 10, 996–998, doi:10.1038/nmeth.2604, 2013.
Eiler, A., Heinrich, F., and Bertilsson, S.: Coherent dynamics and association networks among lake bacterioplankton taxa, ISME J., 6, 330–342, doi:10.1038/ismej.2011.113, 2011.
Fahlgren, C., Hagström, A., Nilsson, D., and Zweifel, U. L.: Annual variations in the diversity, viability, and origin of airborne bacteria, Appl. Environ. Microb., 76, 3015–3025, doi:10.1128/AEM.02092-09, 2010.
Faith, D. P.: Conservation evaluation and phylogenetic diversity, Biol. Conserv., 61, 1–10, 1992.
Franzetti, A., Tatangelo, V., Gandolfi, I., Bertolini, V., Bestetti, G., Diolaiuti, G., D’Agata, C., Mihalcea, C., Smiraglia, C., and Am-brosini, R.: Bacterial community structure on two alpine debris-covered glaciers and biogeography ofPolaromonasphylotypes,
ISME J., 7, 1483–1492, doi:10.1038/ismej.2013.48, 2013. Ganzert, L., Lipski, A., Hubberten, H.-W., and Wagner, D.: The
impact of different soil parameters on the community struc-ture of dominant bacteria from nine different soils located on Livingston Island, South Shetland Archipelago, Antarc-tica, FEMS Microbiol. Ecol., 76, 476–491, doi:10.1111/j.1574-6941.2011.01068.x, 2011.
Grosse, G., Jones, B., and Arp, C.: Thermokarst Lakes, Drainage, and Drained Basins, in: Treatise on Geomorphology, edited by: Shroder. J. F., Volume 8, Academic Press, San Diego, 325–353, 2013.
Heino, J. and Grönroos, M.: Does environmental heterogeneity af-fect species co-occurrence in ecological guilds across stream macroinvertebrate metacommunities?, Ecography, 36, 926–936, doi:10.1111/j.1600-0587.2012.00057.x, 2013.
Helmus, M. R., Bland, T. J., Williams, C. K., and Ives, A. R.: Phylogenetic measures of biodiversity, Am. Nat., 169, E68–E83, doi:10.1086/511334, 2007.
high mountain lake area, FEMS Microbiol. Ecol., 67, 219–228, doi:10.1111/j.1574-6941.2008.00617.x, 2009.
Horner-Devine, M. C., Silver, J. M., Leibold, M. A., Bohannan, B. J., Colwell, R. K., Fuhrman, J. A., Green, J. L., Kuske, C. R., Martiny, J. B., and Muyzer, G.: A comparison of taxon co-occurrence patterns for macro-and microorganisms, Ecology, 88, 1345–1353, 2007.
Kembel, S. W.: Disentangling niche and neutral influences on community assembly: assessing the performance of commu-nity phylogenetic structure tests, Ecol. Lett., 12, 949–960, doi:10.1111/j.1461-0248.2009.01354.x, 2009.
Kembel, S. W., Cowan, P. D., Helmus, M. R., Cornwell, W. K., Morlon, H., Ackerly, D. D., Blomberg, S. P., and Webb, C. O.: Picante: R tools for integrating phylogenies and ecology, Bioin-formatics, 26, 1463–1464, doi:10.1093/bioinformatics/btq166, 2010.
Kritzberg, E. S., Langenheder, S., and Lindström, E. S.: Influ-ence of dissolved organic matter source on lake bacterioplank-ton structure and function–implications for seasonal dynamics of community composition, FEMS Microbiol. Ecol., 56, 406–417, doi:10.1111/j.1574-6941.2006.00084.x, 2006.
Laurion, I., Vincent, W. F., MacIntyre, S., Retamal, L., Dupont, C., Francus, P., and Pienitz, R.: Variability in greenhouse gas emis-sions from permafrost thaw ponds, Limnol. Oceanogr., 55, 115– 133, doi:10.4319/lo.2010.55.1.0115, 2010.
Legendre, P. and De Cáceres, M.: Beta diversity as the variance of community data: dissimilarity coefficients and partitioning, Ecol. Lett., 16, 951–963, doi:10.1111/ele.12141, 2013.
Logue, J. B., Stedmon, C. A., Kellerman, A. M., Nielsen, N. J., Andersson, A. F., Laudon, H., Lindström, E. S., and Kritzberg, E. S.: Experimental insights into the importance of aquatic bacterial community composition to the degradation of dissolved organic matter, ISME J., 1–13, doi:10.1038/ismej.2015.131, 2015. Lovejoy, C., Comeau, A., and Thaler M.: Curated reference
database of SSU rRNA for northern marine and freshwater com-munities of Archaea, Bacteria and microbial eukaryotes, v. 1.0, Nordicana, D23, doi:10.5885/45409XD-79A199B76BCC4110, 2015.
Lozupone, C. and Knight, R.: UniFrac: a new phylogenetic method for comparing microbial communities, Appl. Environ. Microb., 71, 8228–8235, doi:10.1128/AEM.71.12.8228-8235.2005, 2005. Mayfield, M. M. and Levine, J. M.: Opposing effects of competitive exclusion on the phylogenetic structure of communities, Ecol. Lett., 13, 1085–1093, doi:10.1111/j.1461-0248.2010.01509.x, 2010.
McGuire, A. D., Anderson, L. G., Christensen, T. R., Dallimore, S., Guo, L., Hayes, D. J., Heimann, M., Lorenson, T. D., Mac-donald, R. W., and Roulet, N.: Sensitivity of the carbon cycle in the Arctic to climate change, Ecol. Monogr., 79, 523–555, doi:10.1890/08-2025.1, 2009.
Miki, T.: A new graphical model for untangling complex relation-ships among environment, biodiversity, and ecosystem function-ing, Ecol. Res., 24, 937–941, doi:10.1007/s11284-008-0552-7, 2008.
Miklós, I. and Podani, J.: Randomization of presence-absence ma-trices: comments and new algorithms, Ecology, 85, 86–92, 2004. Mondav, R., Woodcroft, B. J., Kim, E.-H., McCalley, C. K., Hodgkins, S. B., Crill, P. M., Chanton, J., Hurst, G. B., VerBerkmoes, N. C., Saleska, S. R., Hugenholtz, P., Rich,
V. I., and Tyson, G. W.: Discovery of a novel methanogen prevalent in thawing permafrost, Nat. Commun., 5, 1–7, doi:10.1038/ncomms4212, 2014.
Monier, A., Comte, J., Babin, M., Forest, A., Matsuoka, A., and Lovejoy, C.: Oceanographic structure drives the assembly pro-cesses of microbial eukaryotic communities, ISME J., 9, 990– 1002, doi:10.1038/ismej.2014.197, 2015.
Montoya, J. M., Pimm, S. L., and Solé, R. V.: Ecolog-ical networks and their fragility, Nature, 442, 259–264, doi:10.1038/nature04927, 2006.
Peura, S., Bertilsson, S., Jones, R. I., and Eiler, A.: Resistant micro-bial co-occurrence patterns inferred by network topology, Appl. Environ. Microb., 81, 2090–2097, doi:10.1128/AEM.03660-14, 2015.
Price, M. N., Dehal, P. S., and Arkin, A. P.: FastTree 2– approximately maximum-likelihood trees for large alignments, PLoS ONE, 5, e9490, doi:10.1371/journal.pone.0009490, 2010. Pruesse, E., Quast, C., Knittel, K., Fuchs, B. M., Ludwig, W., Peplies, J., and Glöckner, F. O.: SILVA: a comprehensive on-line resource for quality checked and aligned ribosomal RNA se-quence data compatible with ARB, Nucl. Acids Res., 35, 7188– 7196, doi:10.1093/nar/gkm864, 2007.
R Core Team: R: A language and environment for statistical com-puting., edited by R Foundation for Statistical Computing, Vi-enna, Austria, http://www.R-project.org/ (May 2015), 2014. Reshef, D. N., Reshef, Y. A., Finucane, H. K., Grossman, S. R.,
McVean, G., Turnbaugh, P. J., Lander, E. S., Mitzenmacher, M., and Sabeti, P. C.: Detecting novel associations in large data sets, Science, 334, 1518–1524, doi:10.1126/science.1205438, 2011. Rossi, P. G., Laurion, I., and Lovejoy, C.: Distribution and identity
of bacteria in subarctic permafrost thaw ponds, Aquat. Microb. Ecol., 69, 231–245, doi:10.3354/ame01634, 2013.
Ruiz-González, C., Niño-García, J. P., Lapierre, J.-F., and Del Giorgio, P. A.: The quality of organic matter shapes the func-tional biogeography of bacterioplankton across boreal fresh-water ecosystems, Global Ecol. Biogeogr., 24, 1487–1498„ doi:10.1111/geb.12356, 2015.
Schloss, P. D., Westcott, S. L., Ryabin, T., Hall, J. R., Hartmann, M., Hollister, E. B., Lesniewski, R. A., Oakley, B. B., Parks, D. H., Robinson, C. J., Sahl, J. W., Stres, B., Thallinger, G. G., Van Horn, D. J., and Weber, C. F.: Introducing mothur: Open-source, platform-independent, community-supported software for de-scribing and comparing microbial communities, Appl. Environ. Microb., 75, 7537–7541, doi:10.1128/AEM.01541-09, 2009. Schuur, E. A., Bockheim, J., Canadell, J. G., Euskirchen, E., Field,
C. B., Goryachkin, S. V., Hagemann, S., Kuhry, P., Lafleur, P. M., and Lee, H.: Vulnerability of permafrost carbon to climate change: Implications for the global carbon cycle, BioScience, 58, 701–714, doi:10.1641/B580807, 2008.
Shannon, P., Markiel, A., Ozier, O., Baliga, N. S., Wang, J. T., Ram-age, D., Amin, N., Schwikowski, B., and Ideker, T.: Cytoscape: a software environment for integrated models of biomolecular interaction networks, Genome Res., 13, 2498–2504, 2003. Stainton, M. P., Capel, M. J., and Armstrong, F. A. J.: The
Chem-ical Analysis of Fresh Water, Winnipeg, Canadian Fisheries and Marine Service, Special Publication 25, 1–168, 1977.
D. A., and Fuhrman, J. A.: Marine bacterial, archaeal and protis-tan association networks reveal ecological linkages, ISME J., 5, 1414–1425, doi:10.1038/ismej.2011.24, 2011.
Stegen, J. C., Lin, X., Konopka, A. E., and Fredrickson, J. K.: Stochastic and deterministic assembly processes in subsurface microbial communities, ISME J., 6, 1653–1664, doi:10.1038/ismej.2012.22, 2012.
Stone, L. and Roberts, A.: The checkerboard score and species dis-tributions, Oecologia, 85, 74–79, 1990.
Székely, A. J., Berga, M., and Langenheder, S.: Mechanisms deter-mining the fate of dispersed bacterial communities in new envi-ronments, ISME J., 7, 61–71, doi:10.1038/ismej.2012.80, 2013. Tarnocai, C., Canadell, J. G., Schuur, E. A. G., Kuhry, P.,
Mazhi-tova, G., and Zimov, S.: Soil organic carbon pools in the north-ern circumpolar permafrost region, Global Biogeochem. Cy., 23, GB2023, doi:10.1029/2008GB003327, 2009.
Thibault, S. and Payette, S.: Recent permafrost degradation in bogs of the James Bay area, northern Quebec, Canada, Permafrost Periglac., 20, 383–389, 2009.
Utermöhl, H.: Zur Vervollkommnung der quantitativen Phytoplankton-Metodik, Mitt. Int. Ver. Theor. Angew. Limnol. 9, 1–38, 1958.
Walter, K. M., Smith, L. C., and Stuart Chapin, F.: Methane bub-bling from northern lakes: present and future contributions to the global methane budget, Philos. T. R. Soc. A, 365, 1657–1676, doi:10.1126/science.1128908, 2007.
Walter, K. M., Chanton, J. P., Chapin, F. S., Schuur, E., and Zimov, S. A.: Methane production and bubble emis-sions from arctic lakes: Isotopic implications for source path-ways and ages, J. Geophys. Res-Biogeo., 113, G00A08, doi:10.1029/2007JG000569, 2008.
Walter Anthony, K. M., Zimov, S. A., Grosse, G., Jones, M. C., An-thony, P. M., Chapin, F. S., Finlay, J. C., Mack, M. C., Davydov, S., Frenzel, P., and Frolking, S.: A shift of thermokarst lakes from carbon sources to sinks during the Holocene epoch, Nature, 511, 452–456, doi:10.1038/nature13560, 2014.
Webb, C. O., Ackerly, D. D., McPeek, M. A., and Donoghue, M. J.: Phylogenies and community ecology, Annu. Rev. Ecol. Syst., 33, 475–505, doi:10.1146/annurev.ecolsys.33.010802.150448, 2002.