Submitted7 November 2014 Accepted 15 November 2014 Published16 December 2014
Corresponding author
Peter Kennedy, [email protected]
Academic editor Francis Martin
Additional Information and Declarations can be found on page 16
DOI10.7717/peerj.686
Copyright 2014 Kennedy et al.
Distributed under
Creative Commons CC-BY 4.0
OPEN ACCESS
Missing checkerboards? An absence of
competitive signal in
Alnus
-associated
ectomycorrhizal fungal communities
Peter Kennedy1,2, Nhu Nguyen1, Hannah Cohen2and Kabir Peay3 1Department of Plant Biology, University of Minnesota, St. Paul, MN, USA
2Department of Biology, Lewis & Clark College, Portland, OR, USA 3Department of Biology, Stanford University, Palo Alto, CA, USA
ABSTRACT
A number of recent studies suggest that interspecific competition plays a key role in determining the structure of ectomycorrhizal (ECM) fungal communities. Despite this growing consensus, there has been limited study of ECM fungal community dy-namics in abiotically stressful environments, which are often dominated by positive rather than antagonistic interactions. In this study, we examined the ECM fungal communities associated with the host genusAlnus, which live in soils high in both nitrate and acidity. The nature of ECM fungal species interactions (i.e., antagonistic, neutral, or positive) was assessed using taxon co-occurrence and DNA sequence abundance correlational analyses. ECM fungal communities were sampled from root tips or mesh in-growth bags in three monodominantA. rubraplots at a site in Oregon, USA and identified using Illumina-based amplification of the ITS1 gene region. We found a total of 175 ECM fungal taxa; 16 of which were closely related to knownAlnus-associated ECM fungi. Contrary to previous studies of ECM fungal communities, taxon co-occurrence analyses on both the total andAlnus-associated ECM datasets indicated that the ECM fungal communities in this system were not structured by interspecific competition. Instead, the co-occurrence patterns were consistent with either random assembly or significant positive interactions. Pair-wise correlational analyses were also more consistent with neutral or positive interactions. Taken together, our results suggest that interspecific competition does not appear to determine the structure of all ECM fungal communities and that abiotic conditions may be important in determining the specific type of interaction occurring among ECM fungi.
Subjects Ecology, Mycology
Keywords Interspecific competition, Next-generation sequencing, Checkerboard analysis, Species interactions, Co-occurrence patterns, Fungi
INTRODUCTION
is less feasible due to the inability to selectively manipulate species-level neighborhood composition. A widely proposed alternative is to look at species distribution patterns, withDiamond’s (1975) study of bird distributions in the New Guinea archipelago being one of most well-recognized examples. In that study, the presence of certain bird species on a given island was associated with the absence of other species (and vice versa on other islands), resulting in a series of ‘forbidden species combinations’ or ‘checkerboard distributions’, which were posited to be the result of competitive exclusion (Diamond, 1975). This technique provided an important step forward in assessing the role of species interactions in field-based studies at the community level, but it has been frequently noted that analyses of species co-occurrence patterns need to include comparisons with patterns generated from communities assembled randomly to maximize inference (Connor & Simberloff, 1979;Gotelli & Graves, 1996).
Since the 1970s, species co-occurrence analyses have been used to assess the possibility of species interactions in a wide range of organisms, including both macro- and microorganisms (Gotelli & McCabe, 2002;Horner-Devine et al., 2007). Plant-associated fungal communities, which have diverse ecological roles in ecosystems (Smith & Read, 2008;Rodriguez et al., 2009), have shown a full range of co-occurrence patterns, including those consistent with both positive and antagonistic interactions (Koide et al., 2005;Pan & May, 2009;Gorzelak, Hambleton & Massicotte, 2012;Ovaskainen, Hottola & Siitonen, 2010;Pickles et al., 2012;Toju et al., 2013). For ectomycorrhizal (ECM) fungi, the dominant microbial eukaryotes in many temperate and some tropical forest soils (Smith & Read, 2008), these analyses have consistently found evidence of less species co-occurrence than expected by chance (Koide et al., 2005;Pickles et al., 2010;Pickles et al., 2012). This suggests that competitive interactions may play a significant role in structuring the communities of this fungal guild (Kennedy, 2010). The initial studies of species co-occurrence patterns in ECM fungal communities looked only in forests dominated by conifer hosts, but a recent study inFagus sylvaticaforests in Europe also found evidence of significantly lower than expected co-occurrence patterns (Wubet et al., 2012). This latter result indicates that the predominance of antagonistic interactions in determining ECM fungal community structure may be a common, host-lineage independent phenomenon. However, other ecological and evolutionary factors aside from species interactions can also be responsible for non-random species co-occurrence patterns (Gotelli & McCabe, 2002;Ovaskainen, Hottola & Siitonen, 2010), so caution must be applied in inferring underlying mechanisms.
to the high inputs and decomposition of nitrogen-rich leaf litter) results in significantly higher nitrate and acidity levels than those present in most other ECM-dominated forest soilsDani`ere, Capellano & Moiroud, 1986;Miller, Koo & Molina, 1992;Martin, Posavatz & Myrold, 2003;Walker et al., 2014. Elevated levels of both of these abiotic factors have been shown to inhibit the growth of many ECM fungi (Hung & Trappe, 1983;Lilleskov et al., 2002) and, using an experimental pure culture approach,Huggins et al. (in press)
recently demonstrated thatAlnus-associated ECM fungi have a greater ability to tolerate high nitrate and acidity conditions compared to non-Alnus-associated ECM fungi.
Given the ability ofAlnus-associated ECM fungi to grow in conditions that are generally considered abiotically stressful, we hypothesized that ECM fungal species co-occurrence patterns inAlnusforests may differ from those present in forests dominated by other ECM hosts. Specifically, we speculated that competitive interactions would be less prevalent in this study system, based on the fact that many studies of vascular plants have shown that the nature of species interactions often changes from antagonistic to positive with increasing levels of abiotic stress (Bertness & Callaway, 1994;G´omez-Aparicio et al., 2004, but seeMichalet et al., 2006). To examine this hypothesis, we examined the co-occurrence patterns of the ECM fungal communities present in three mono-dominant plots ofAlnus rubrain the western United States. ECM fungal communities were sampled on root tips and in soil. For the latter, we used sand-filled mesh in-growth bags, which allow for efficient, well-replicated community sampling of fungal hyphae growing in soil (Wallander et al., 2001;Branco, Bruns & Singleton, 2013). To identify the ECM fungi present in the study, we used high throughput Illumina sequencing, which has been increasingly used to profile ECM fungal community composition (McGuire et al., 2013;Smith & Peay, 2014).
MATERIALS & METHODS
Study locationThe study site was located on the eastern side of the Coast Range mountains in northwestern Oregon, U.S.A. (latitude: N 45.820 W 123.05376, elevation: 462 m). Tem-peratures at the site are moderate (mean annual temperature=8.7◦C, min
= −1.2◦C, max=23.8◦
C), with significant precipitation between October and May followed by drier summer months (total=1742 mm). The specific study location is part of a long-term research project examining the effects of different forest management practices onA. rubra growth (see the Hardwood Silvicultural Cooperative (HSC) website for details,http:// www.cof.orst.edu/coops/hsc). The HSC site used, Scappoose (HSC 3209), was established in 1995. Prior to the implementation of the HSC work, the site was a second-growth coniferous forest, which was clear-cut and replanted with a series of monodominantA. rubraplots.A. rubraseedlings were planted from nursery stock (Brooks Tree Farm, Brooks, OR) during the beginning of their second year of growth. Seedling ECM status at the time of planting was not assessed (Frankianodules were noted to be absent), but nursery fumigation practices indicate colonization was unlikely (A Bluhm, pers. comm., 2009).
(Plot 2=628, Plot 4=1,557, and Plot 8=3,559 stems/ha), but had no other forest management practices applied. Despite the differences in stem density,A. rubrafine root density did not differ significantly among the three plots (Fig. S1). The understories in all three plots were colonized by arbuscular mycorrhizal plants (dominated byMahonia nervosaandClaytonia perfoliata), with no other ECM hosts besidesA. rubrapresent. Soils were classified as well-drained Tolamy loams (USDA Soil Survey, Columbia County, OR). Within each plot, we located a 9×9 m subplot and overlaid a 100 point grid, with each point being separated by 1 m. We chose this subplot size to avoid any dead stems in the canopy immediately above the sampling area, while at the same time maximizing the number of samples taken per subplot. At each point in Plot 4, which was sampled for ECM root tips, a 5 cm diameter×10 cm deep soil core was taken on May 31, 2013. In Plots 2 and 8, which were sampled for ECM communities present in soil, a 5×5 cm mesh bag was buried at each point 5 cm below the soil surface. The bags were made of anti-static polyester fabric with 300µm diameter pores. This pore size allowed fungal hyphae to
grow into the bags, but prevented penetration of plant roots. We filled the bags with twice autoclaved #3 grade Monterey aquarium sand (Cemex, Marina, CA, USA). Aluminum tags on fluorescent string were added to facilitate bag recovery. The mesh bags at Plot 2 were buried on February 1, 2013 and at Plot 8 on February 22. They were left undisturbed in the soil until May 31, when all were harvested. After removal from the soil, we placed the mesh bags into individual plastic bags and then onto ice for transport back to the laboratory. Soil cores and bags were stored at 4◦C for<96 h before further processing.
Molecular analyses
We processed the root tip samples by gently washing all roots away from the soil and removing all ECM colonized root tips from each core under a 10X dissecting scope (∼10–50 root tips/core). All roots from each core were extracted using individual MoBio PowerSoil kits (Hercules, CA, USA), following manufacturer’s instructions for maximum DNA yields. For the mesh bags, we followed the protocol outlined inBranco, Bruns & Singleton (2013), which provided a cheaper and quicker protocol compared to direct DNA extraction from the sand within the mesh bags. Briefly, each bag (including a negative control that was taken to the field, but not buried) was emptied into a sterile 50 ml centrifuge tube. We added 10 ml of sterile deionized water and vortexed each tube for two minutes, followed by a five minute settling period (hyphae have been previously observed to float to the water surface). We then transferred the top two ml top of water to a new 2 ml centrifuge tube and contents were pelleted via centrifugation. On the same day, we extracted total genomic DNA from the pellets using the Sigma REDExtract-N-Amp kit (Sigma-Aldrich, St, Louis, MO, USA) following manufacturer’s instructions. Root tips and extracts were stored for one week at−20◦
C prior to PCR amplification.
interested in the spatial co-occurrence patterns in the soil hyphal ECM fungal communities and therefore only used the root tip samples to create a local sequence reference set of knownAlnus-associated ECM taxa against which the mesh bag data could be compared. For all PCR reactions, we used the barcoded ITS1F and ITS2 primer set ofSmith & Peay (2014), with each sample run in triplicate and pooled to minimize heterogeneity. Successful PCR products were determined by gel electrophoresis and magnetically cleaned using the Agencourt AMPure XP kit (Beckman Coulter, Brea, CA, USA) according to manufacturer’s instructions. Final product concentrations were quantified using a Qubit dsDNA HS Fluorometer (Life Technologies, Carlsbad, CA, USA). Root tip and bag samples were run at different sequencing facilities under the same general conditions. For the root tips, the single PCR product was run at the University of Minnesota Genomics Center us-ing 250 bp paired-end sequencus-ing on the MiSeq Illumina platform. For the bags, we pooled the 192 successfully amplified bag samples at equimolar concentration and ran them on the same platform at the Stanford Functional Genomics Facility using 250 bp paired-end sequencing on the MiSeq Illumina platform. A spike of 20% and 30% PhiX was added to the runs to achieve sufficient sample heterogeneity, respectively. Raw sequence data and associated metadata from both the root tip and bag samples were deposited at MG-RAST (http://metagenomics.anl.gov/) under project #1080.
Bioinformatic analyses
were typically non-fungal, we further filtered out sequences with matches≤90% to BLAST (i.e., at least 90% of the bases in the input sequence matches to another sequence in the database at some identity level).
Using the remaining sequence dataset, we rarefied all samples to 12946 sequences, which was the lowest number of sequences obtained across the 192 samples. Since there has recently been a question raised about the validity of rarefaction in next generation sequencing analyses (McMurdie & Holmes, 2014), we also analyzed the data without rarefaction. We obtained very similar results (Table S1), so present the data based on rarefied samples only. ECM OTUs within each sample were parsed out using a python script that searches for genera names from a list of 189 known ECM genera and their synonyms (Branco, Bruns & Singleton, 2013, appended fromTedersoo, May & Smith, 2010). While this script provides a strong general filter for sorting the data by fungal lifestyle, some taxa belonging to clades that are polyphyletic for the ECM habit (e.g.,Lyophyllum, Sebacinales) as well as taxa with low matches to Genbank (e.g., Uncultured Fungus) can be of questionable trophic status. For each of these groups, we carefully checked both the sequence matches and placement of our OTUs within phylogenetic trees of the clades to determine whether these taxa were properly classified at ECM. The resulting sample x OTU matrix contained 190 ECM taxa represented by at least one sequence per sample (min=1, median=34, mean=1,334, max=209,187). We found that 15 of the 190 OTUs present were highly similar (>97% similar) to ECM fungi present in the dipterocarp rainforests of Malaysia, which were concurrently being studied in the Peay lab using the same next-generation sequencing approach (Fig. 1). Because these OTUs represented accidental contamination probably during library construction, they were eliminated from the final analyses. Although an additional 80 OTUs had>97% similarity to taxa found in the Borneo study, because their closest BLAST match was not from Borneo, we conservatively considered these taxa as having cosmopolitan distributions and included them in the final analyses. The final OTU×sample matrix, including taxonomic matches
and representative of sequences for each OTU, can be found inTable S2.
Statistical analyses
Taxon co-occurrence patterns of the ECM fungal communities present in bag samples were assessed using the program EcoSim (Gotelli & Entsminger, 2009), with presence-absence matrices for Plots 2 and 8 being analyzed separately. (The root data from Plot 4 could not be analyzed for sample-level co-occurrence due to the pooled sequencing approach for those samples). We utilized the C-score algorithm (Stone & Roberts, 1990), which compares the number of checkerboard units (i.e., 1,0×0,1) between all pairs of species in the observed matrix(Cobserved)to that based in random permutations of
the same matrix (Cexpected, i.e., the null models). Since randomized permutations of
Figure 1 Rank-abundance plot of all 190 (inset) and top 20 ectomycorrhizal (ECM) fungal taxa sampled in this study.The top 20 ECM fungal taxa are color coded by whether they are known to be associated withAlnushosts (black), of unknown host origin (grey), or laboratory contaminants (white).
total abundances of each taxon in the observed and null matrices were identical. In the ‘fixed-equiprobable’ option, however, the column (i.e., sample) totals in the null matrices were no longer equivalent to those in the observed matrix. Instead, all samples in the null matrices had an equal probability of being colonized by any of the taxa in the observed matrix, which effectively eliminates differences in taxon richness among samples.
using the largerAlnusmatrix, the fourth matrix excluded the three most frequent and abundant species (Tomentella3,Alnicola1,Tomentella2) (referred to asAlnusMinusTop3). Finally, the fifth matrix included just the 10 taxa in the genusTomentella(from the larger Alnusmatrix) to look for evidence of species interactions among this subset of closely related taxa (referred to asAlnusTomentellaOnly). For all of the aforementioned C-score analyses, taxa present in less than 5 bag samples were removed, as low frequency taxa are generally considered non-informative (Koide et al., 2005). The observed input matrices were compared to 5000 null matrices. Significant differences between the observed matrix C-score and that of the null matrices were determined along with standardized effect sizes (SES). Observed C-scores significantly higher than those generated from the null matrices are consistent with a community being structured by competitive interactions, whereas Cobservedsignificantly lower than the Cexpectedis consistent with positive interactions.
To further assess the degree of association among knownAlnusECM fungal taxa, we also used an abundance-based approach (as opposed to the co-occurrence analyses, which are based on binary presence/absence data). Specifically, we calculated the pair-wise Spearman rank correlation coefficients among all pairs of the 16Alnus-associated taxa using thecorfunction in R (R Core Team, 2013). Coefficients>0.30 were tested for significance with thecor.testfunction. To account for multiple tests(n=13), we used a Bonferroni-correctedPvalue of 0.003. With the same data set, we also tested for the presence of spatial autocorrelation using themgramfunction in the ECODIST package in R. We first converted the sequence abundance datasets in both Plots 2 and 8 into dissimilarity matrices using the Bray-Curtis Index and then compared those to a Euclidean distance matrix of sampling points for each plot. For the Mantel correlogram tests, we used then.class=0option, which uses Sturge’s equation to determine the appropriate number of distance classes.
RESULTS
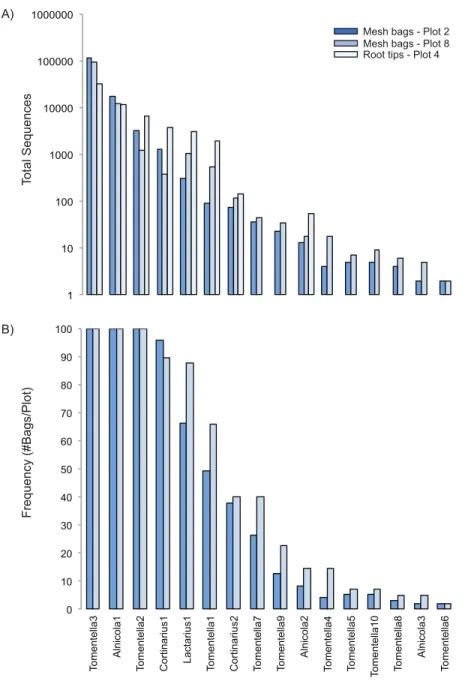
We found 175 total ECM fungal taxa in the study (Table S2); 16 of which matched closely to knownAlnus-associated ECM fungi. In the mesh bags,Alnus-associated ECM fungal taxa represented six of the ten most abundant OTUs present, including the dominant ECM fungal taxon,Tomentella3, which was present in all the bag samples in both plots and had sequence abundances nearly ten-fold higher than any other taxon (Figs. 2Aand2B). Two otherAlnus-associated fungal taxa,Alnicola1 andTomentella2, were also present in all samples, whereas the remainingAlnus-associated ECM fungal taxa had frequencies varying from 2 to 96% (Plot 2 mean=25%, Plot 8 mean=31%) and lower sequence abundances. Eight of the 16Alnus-associated ECM fungal taxa were present on both roots and in the bags, with abundances that were very similar (Fig. 1A). Of the eight ECM fungal taxa found on root tips, all were previously encountered onA. rubraroot tips at other sites in Oregon, while the eight fungal taxa found exclusively in bags had not been previously documented (Kennedy & Hill, 2010).
Figure 2 Rank-abundance (A) and rank-frequency (B) plots of Alnus-associated ectomycorrhizal
fungal taxa sampled in mesh bags and root tips.
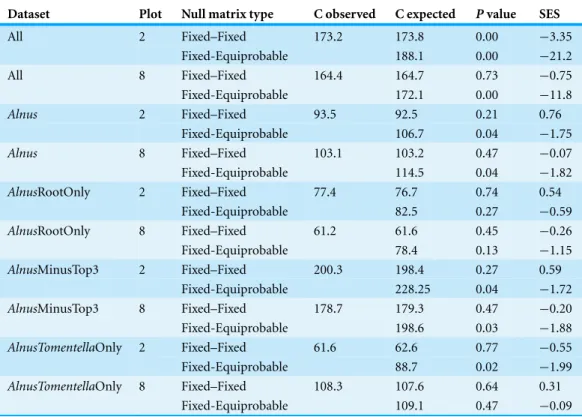
Table 1 C-score taxon occurrence analyses of ECM fungal communities in Plots 2 and 8.See methods for details about datasets and null matrix type definitions.
Dataset Plot Null matrix type C observed C expected Pvalue SES
All 2 Fixed–Fixed 173.2 173.8 0.00 −3.35
Fixed-Equiprobable 188.1 0.00 −21.2
All 8 Fixed–Fixed 164.4 164.7 0.73 −0.75
Fixed-Equiprobable 172.1 0.00 −11.8
Alnus 2 Fixed–Fixed 93.5 92.5 0.21 0.76
Fixed-Equiprobable 106.7 0.04 −1.75
Alnus 8 Fixed–Fixed 103.1 103.2 0.47 −0.07
Fixed-Equiprobable 114.5 0.04 −1.82
AlnusRootOnly 2 Fixed–Fixed 77.4 76.7 0.74 0.54
Fixed-Equiprobable 82.5 0.27 −0.59
AlnusRootOnly 8 Fixed–Fixed 61.2 61.6 0.45 −0.26
Fixed-Equiprobable 78.4 0.13 −1.15
AlnusMinusTop3 2 Fixed–Fixed 200.3 198.4 0.27 0.59
Fixed-Equiprobable 228.25 0.04 −1.72
AlnusMinusTop3 8 Fixed–Fixed 178.7 179.3 0.47 −0.20
Fixed-Equiprobable 198.6 0.03 −1.88
AlnusTomentellaOnly 2 Fixed–Fixed 61.6 62.6 0.77 −0.55
Fixed-Equiprobable 88.7 0.02 −1.99
AlnusTomentellaOnly 8 Fixed–Fixed 108.3 107.6 0.64 0.31
Fixed-Equiprobable 109.1 0.47 −0.09
Notes.
SES, Standardized Effect Size.
AlnusECM fungal communities whether the top three taxa were removed or not. The AlnusandAlnusRootOnly analyses did differ under the ‘fixed-equiprobable’ option, with the former showing greater than expected co-occurrence and the latter having a pattern no different than one based on random assembly. Additionally, in theAlnusTomentellaOnly analysis, the ECM fungal community showed greater than expected co-occurrence in Plot 2 but not in Plot 8. In all of these cases, significant antagonistic patterns were not observed.
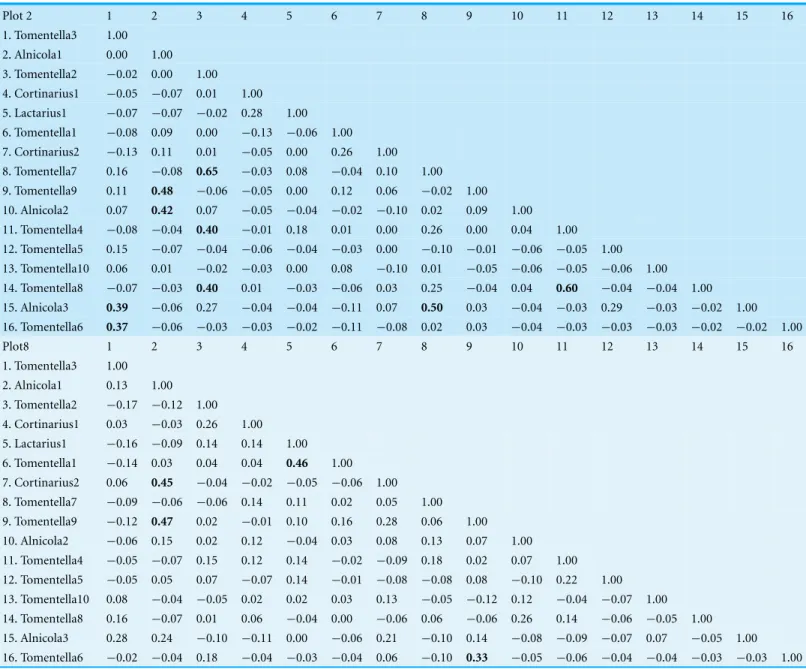
Table 2 Spearman rank correlation coefficient matrices for ECM fungal communities in Plots 2 and 8.Significant correlations are indicated in bold. Numbers over the columns of both matrices correspond to the number of the ECM fungal taxon identified in the first row.
Plot 2 1 2 3 4 5 6 7 8 9 10 11 12 13 14 15 16
1. Tomentella3 1.00 2. Alnicola1 0.00 1.00 3. Tomentella2 −0.02 0.00 1.00 4. Cortinarius1 −0.05 −0.07 0.01 1.00 5. Lactarius1 −0.07 −0.07 −0.02 0.28 1.00 6. Tomentella1 −0.08 0.09 0.00 −0.13 −0.06 1.00 7. Cortinarius2 −0.13 0.11 0.01 −0.05 0.00 0.26 1.00 8. Tomentella7 0.16 −0.08 0.65 −0.03 0.08 −0.04 0.10 1.00 9. Tomentella9 0.11 0.48 −0.06 −0.05 0.00 0.12 0.06 −0.02 1.00 10. Alnicola2 0.07 0.42 0.07 −0.05 −0.04 −0.02 −0.10 0.02 0.09 1.00 11. Tomentella4 −0.08 −0.04 0.40 −0.01 0.18 0.01 0.00 0.26 0.00 0.04 1.00 12. Tomentella5 0.15 −0.07 −0.04 −0.06 −0.04 −0.03 0.00 −0.10 −0.01 −0.06 −0.05 1.00 13. Tomentella10 0.06 0.01 −0.02 −0.03 0.00 0.08 −0.10 0.01 −0.05 −0.06 −0.05 −0.06 1.00 14. Tomentella8 −0.07 −0.03 0.40 0.01 −0.03 −0.06 0.03 0.25 −0.04 0.04 0.60 −0.04 −0.04 1.00 15. Alnicola3 0.39 −0.06 0.27 −0.04 −0.04 −0.11 0.07 0.50 0.03 −0.04 −0.03 0.29 −0.03 −0.02 1.00 16. Tomentella6 0.37 −0.06 −0.03 −0.03 −0.02 −0.11 −0.08 0.02 0.03 −0.04 −0.03 −0.03 −0.03 −0.02 −0.02 1.00
Plot8 1 2 3 4 5 6 7 8 9 10 11 12 13 14 15 16
1. Tomentella3 1.00 2. Alnicola1 0.13 1.00 3. Tomentella2 −0.17 −0.12 1.00 4. Cortinarius1 0.03 −0.03 0.26 1.00 5. Lactarius1 −0.16 −0.09 0.14 0.14 1.00 6. Tomentella1 −0.14 0.03 0.04 0.04 0.46 1.00 7. Cortinarius2 0.06 0.45 −0.04 −0.02 −0.05 −0.06 1.00 8. Tomentella7 −0.09 −0.06 −0.06 0.14 0.11 0.02 0.05 1.00 9. Tomentella9 −0.12 0.47 0.02 −0.01 0.10 0.16 0.28 0.06 1.00 10. Alnicola2 −0.06 0.15 0.02 0.12 −0.04 0.03 0.08 0.13 0.07 1.00 11. Tomentella4 −0.05 −0.07 0.15 0.12 0.14 −0.02 −0.09 0.18 0.02 0.07 1.00 12. Tomentella5 −0.05 0.05 0.07 −0.07 0.14 −0.01 −0.08 −0.08 0.08 −0.10 0.22 1.00 13. Tomentella10 0.08 −0.04 −0.05 0.02 0.02 0.03 0.13 −0.05 −0.12 0.12 −0.04 −0.07 1.00 14. Tomentella8 0.16 −0.07 0.01 0.06 −0.04 0.00 −0.06 0.06 −0.06 0.26 0.14 −0.06 −0.05 1.00 15. Alnicola3 0.28 0.24 −0.10 −0.11 0.00 −0.06 0.21 −0.10 0.14 −0.08 −0.09 −0.07 0.07 −0.05 1.00 16. Tomentella6 −0.02 −0.04 0.18 −0.04 −0.03 −0.04 0.06 −0.10 0.33 −0.05 −0.06 −0.04 −0.04 −0.03 −0.03 1.00
DISCUSSION
were either no different from random assembly or consistent with positive interactions. Although we did not measure soil nitrate and acidity conditions in this study (seeMartin, Posavatz & Myrold (2003)andWalker et al. (2014)for values from comparable ageA. rubraforests at other sites in Oregon),Alnussoils are consistently characterized by abiotic conditions are generally considered stressful to ECM fungi. The results we obtained are thus consistent with the ‘stress gradient hypothesis’, which posits that species interactions shift from negative to positive as environmental conditions become harsher (Bertness & Callaway, 1994). Although we emphasize that the patterns we found in this study are based solely on correlative inference, there is some experimental evidence that may support the stress gradient hypothesis for ECM fungal community dynamics.Koide et al. (2005)
found a shift from significant negative co-occurrence patterns in their control plots to non-significant co-occurrence patterns in plots where either tannins or nitrogen were added experimentally. While they did not explicitly analyze these manipulations in terms of stress, both increased tannin and nitrogen levels have been shown to inhibit the growth of multiple ECM fungal taxa (Koide et al., 1998;Cox et al., 2010). The direction of the response in theKoide et al. (2005)study is consistent with greater abiotic stress resulting in a decrease in antagonistic ECM fungal interactions. At the same time, it is plausible that resource limitation was eliminated with the addition of nitrogen, which could have allowed for greater spatial co-existence among ECM fungi. Since theAlnussystem has naturally higher nitrogen availability than most ECM forests due to the co-presence of nitrogen-fixingFrankiabacteria, it is also possible that greater resource abundance could drive the co-occurrence patterns we observed. Given the fact that the pattern could be explained by either increasing stress or resource availability, additional studies are needed to distinguish among these explanations. One promising approach would be to examine the taxon co-occurrence patterns in younger and olderAlnusforests, since soil nitrate and acidity concentrations increase in these forests over time (Dani`ere, Capellano & Moiroud, 1986;Martin, Posavatz & Myrold, 2003). If the stress gradient hypothesis were the most plausible explanation, then we would expect to see competitive and facilitative interactions to be dominant, respectively.
relatedness as a good proxy for competitive strength by showing that in certain abiotic environments competition may actually select for more closely related taxa than expected by chance (i.e., phylogenetic clustering). TheAlnusECM system is particularly interesting in this respect because while the fungal communities associated withAlnushosts are both species poor and highly host specific, they include taxa from a number of distantly related lineages (Rochet et al., 2011). Although explanations for this higher-level phylogenetic patterning are still lacking, our current results suggest that competitive processes among both closely and more distantly related taxa are not a key factor generating the atypical structure ofAlnusECM fungal communities.
Some positive spatial associations have been observed in other studies of ECM fungal communities (Agerer, Grote & Raidl, 2002;Koide et al., 2005;Pickles et al., 2012), and have been suggested to be due to complementary resource acquisition abilities of among individual taxa (Jones et al., 2010). We speculate that inAlnusforests positive associations among ECM fungi could also reflect possible amelioration of local abiotic conditions.
Huggins et al. (in press)found thatAlnus-associated ECM fungi could more effectively buffer changes in local pH environments than non-AlnusECM fungi, which may be key to persistence in the high acidity soils present in Alnusforests. While the exact buffering mechanism is not yet known, if it involves the release of molecules into the external environment, growing directly adjacent to another ECM fungus may result in greater buffering of local pH conditions than when growing in isolation. We believe it is important to note, however, that the patterning of positive associations were patchy and not consistent between plots, so it is hard to determine if local pH buffering is actually significant without local measurements of pH for each sample. Furthermore, sequence abundance of individual taxa has been shown not to correlate linearly with initial fungal tissue or DNA abundance in other studies using NGS techniques (Amend, Seifert & Bruns, 2010;Nguyen et al., in press), so caution must be applied in using sequence abundance as an accurate ecological proxy.
Like the co-occurrence and correlation-based patterns, we found that spatial auto-correlation patterns observed inAlnusECM fungal communities were also anomalous relative to other studies. The specific distance of spatial autocorrelation appears to vary among systems, but there is typically strong spatial autocorrelation among community samples located less than 5 m apart (e.g.,Lilleskov et al., 2004;Bahram et al., 2013). While the spatial extent of our study was very limited (the most distant samples within plots were only∼12 m apart), the absence of spatial signal was not surprising, based
on previous studies ofAlnusECM fungal communities. BothPritsch et al. (2010)and
studied across the New Guinea archipelago were not dispersal limited, yet exhibited many checkerboard distribution patterns. As such, we do not think the atypical nature of the taxon co-occurrence patterns inAlnusECM fungal communities that we observed were driven by the also atypical spatial correlation patterns.
As the results observed in this study differed in multiple ways from those found previously, we had some concern they were caused by an artifact of our identification or sampling methodology. Unlike previous examinations of taxon co-occurrence for ECM fungi, we used next-generation sequencing (NGS) to identify the communities present. NGS methods provide much greater sequencing depth per sample (Smith & Peay, 2014), which may have allowed us to more effectively document the ECM fungal communities present in each sample compared to previous studies. We found that the three most abundantAlnus-associated ECM fungi were present in every bag sample in both plots, which has not been observed in other systems. Although the presence of spatially ubiquitous taxa will result in a lower total number of checkerboard units observed (as 1,0 is possible but not 0,1), it has the same effect on both the observed and null matrices and therefore should not bias statistical comparisons of Cobservedversus Cexpected. We
checked this by eliminating the three ECM fungal taxa present in every sample and found functionally identical results to those when those taxa were included (Table 2). A second difference between this and related studies was the sampling of ECM fungal hyphal communities in mesh bags. Previous studies assessing co-occurrence patterns have largely focused on ECM root tips, butKoide et al. (2005)found very similar taxon co-occurrence patterns for root-tip and soil-based analyses of ECM fungal communities in the samePinus resinosaforest. Based on that result, and the fact that the sequence abundances of all the ECM fungi present onA. rubraroot tips and the mesh bags showed highly similar patterns (Table S2), we do not believe assessing ECM hyphal communities was the source of our incongruous results either (however, in hindsight, a better experimental design would have been to sample the mesh bags and the ECM root tips directly around them within each plot). A third difference is the restricted taxonomic richness ofAlnusECM fungal communities. This explanation, however, also seems unwarranted, asPickles et al. (2012)
NGS techniques clearly represent a powerful and efficient way to assess the richness and dynamics of fungal communities (Smith & Peay, 2014), but we found that additional data quality control analyses beyond the standard sequence quality thresholds and chimera checking were needed to properly characterize ECM fungal community composition. Specifically, we found that a relatively high number of ECM fungal taxa present appeared to be the result of PCR contamination. The PCR reactions of our extraction and PCR controls produced no bands indicating positive product, but the sensitivity of NGS techniques and the Illumina platform in particular makes the amplification of single DNA molecules highly probable (Tedersoo et al., 2010;Peay, Baraloto & Fine, 2013). Fortunately, the atypical and well-described nature ofAlnusECM fungal communities made it relatively easy to identify the most obvious non-Alnusassociated fungal taxa and remove them prior to the final analyses. For taxa that belonged to ECM fungal lineages known to associate withAlnushosts but which had not been previously documented, it was more difficult to determine their status (i.e., whether they represented PCR contaminants, were present in A. rubrasoils as spores, or actually colonizingA. rubraroot tips). In particular, the status of Thelephoraceae1, which had the third highest sequence abundance in the full dataset, was interesting because the closest BLAST match to Thelephoraceae1 was an ECM fungal root tip sample fromBetula occidentalisin British Columbia, Canada.Bogar & Kennedy (2013)
found that ECM fungal communities present onAlnusandBetulahosts can overlap, so it is possible this taxon was overlooked in previous surveys ofAlnusECM fungal communities that used less sensitive methods. However, the absence of this taxon from any the root tip samples in Plot 4 suggests that it was most likely present simply as spores rather than an active member of theAlnus-associated ECM fungal community. Despite the unclear status of this taxon as well as many others with lower abundance, the co-occurrence patterns showed the same general results whether taxa of unknown status were included or not, suggesting the overall results were robust. In less well-characterized ECM fungal and other microbial systems, however, the potential for inclusion of spurious taxa is sufficiently high that we strongly recommend the sequencing of negative extraction and PCR controls to help try to account for any lab-based contamination (Nguyen et al., in press).
ACKNOWLEDGEMENTS
We thank A Bluhm and D Hibbs for assistance using the HSC study location, L Bogar, V Engebretson, J Huggins, P King for assistance with experiment implementation and harvest, J Walker for assistance with DNA extractions, D Smith for assistance with NGS processing, and members of the Peay Lab, C Fernandez, R Koide, M Gardes and one anonymous reviewer for critical comments on a previous version of this manuscript.
ADDITIONAL INFORMATION AND DECLARATIONS
Funding
Support for this work came from NSF DEB Grant #1030275 to Peter Kennedy. The funders had no role in study design, data collection and analysis, decision to publish, or preparation of the manuscript.
Grant Disclosures
The following grant information was disclosed by the authors: NSF DEB: #1030275.
Competing Interests
The authors declare there are no competing interests.
Author Contributions
• Peter Kennedy conceived and designed the experiments, analyzed the data, wrote the paper, prepared figures and/or tables.
• Nhu Nguyen analyzed the data, contributed reagents/materials/analysis tools, reviewed drafts of the paper.
• Hannah Cohen performed the experiments, reviewed drafts of the paper.
• Kabir Peay contributed reagents/materials/analysis tools, reviewed drafts of the paper.
Field Study Permissions
The following information was supplied relating to field study approvals (i.e., approving body and any reference numbers):
No permit was needed as the study was conducted on private land.
DNA Deposition
The following information was supplied regarding the deposition of DNA sequences: We have provided access to the raw sequence reads with the MG-RAST (http:// metagenomics.anl.gov/) under project #1080.
Supplemental Information
REFERENCES
Agerer R, Grote R, Raidl S. 2002.The new method “micromapping”, a means to study
species-specific associations and exclusions of ectomycorrhizae.Mycological Progress1:155–166
DOI 10.1007/s11557-006-0015-x.
Altschul SF, Gish W, Miller W, Myers WE, Lipman DJ. 1990.Basic local alignment search tool.
Journal of Molecular Biology215:403–410DOI 10.1016/S0022-2836(05)80360-2. Amend AS, Seifert KA, Bruns TD. 2010. Quantifying microbial communities with
454 pyrosequencing: does read abundance count?Molecular Ecology 19:5555–5565
DOI 10.1111/j.1365-294X.2010.04898.x.
Bahram M, K˜oljalg U, Courty PE, Di´edhiou AG, Kjøller R, P˜olme S, Ryberg M, Veldre V, Tedersoo L. 2013.The distance decay of similarity in communities of ectomycorrhizal fungi in different ecosystems and scales.Journal of Ecology101:1335–1344
DOI 10.1111/1365-2745.12120.
Becerra A, Zak MR, Horton TR, Micolini J. 2005.Ectomycorrhizal and arbuscular mycorrhizal colonization ofAlnusacuminata from Calilegua National Park (Argentina).Mycorrhiza
15:525–531DOI 10.1007/s00572-005-0360-7.
Bertness MD, Callaway R. 1994.Positive interactions in communities.Trends in Ecology & Evolution9:191–193DOI 10.1016/0169-5347(94)90088-4.
Bogar LM, Kennedy PG. 2013.New wrinkles in an old paradigm: neighborhood effects can modify the structure and specificity ofAlnus-associated ectomycorrhizal fungal communities.FEMS Microbiology Ecology83:767–777DOI 10.1111/1574-6941.12032.
Branco S, Bruns TD, Singleton I. 2013.Fungi at a small scale: spatial zonation of fungal assemblages around single trees.PLoS ONE8:e78295DOI 10.1371/journal.pone.0078295. Cahill JF, Kembel SW, Lamb EG, Keddy PA. 2008.Does phylogenetic relatedness influence the
strength of competition among vascular plants?Perspectives in Plant Ecology, Evolution and Systematics10:41–50DOI 10.1016/j.ppees.2007.10.001.
Caporaso JG, Kuczynski J, Stombaugh J, Bittinger K, Bushman FD, Costello EK, Fierer N, Pe˜na AG, Goodrich JK, Gordon JI, Huttley GA, Kelley ST, Knights D, Koenig JE, Ley RE, Lozupone CA, McDonald D, Muegge BD, Pirrung M, Reeder J, Sevinsky JR, Turnbaugh PJ, Walters WA, Widmann J, Yatsunenko T, Zaneveld J, Knight R. 2010.QIIME allows
analysis of high-throughput community sequencing data.Nature Methods7:335–336
DOI 10.1038/nmeth.f.303.
Connell JH. 1983.On the prevalence and relative importance of interspecific competition: evidence from field experiments.American Naturalist122:661–696DOI 10.1086/284165. Connor EF, SimberloffD. 1979.The assembly of species communities—chance or competition.
Ecology60:1132–1140DOI 10.2307/1936961.
Cox F, Barsoum N, Lilleskov E, Bidartondo M. 2010. Nitrogen availability is a primary determinant of conifer mycorrhizas across complex environmental gradients.Ecology Letters
13:1103–1113DOI 10.1111/j.1461-0248.2010.01494.x.
Dani`ere C, Capellano A, Moiroud A. 1986.Nitrogen transfer in a natural stand ofAlnusincana
L. Moench.Acta Oecologica/Oecologia Plantarum7:165–175.
G ´omez-Aparicio L, Zamora R, G ´omez JM, H ´odar JA, Castro J, Baraza E. 2004.Applying plant facilitation to forest restoration: a meta-analysis of the use of shrubs at nurse plants.Ecological Applications14:1128–1138DOI 10.1890/03-5084.
Gorzelak MA, Hambleton S, Massicotte HB. 2012.Community structure of ericoid mycorrhizas and root-associated fungi of Vaccinium membranaceum across an elevation gradient in the Canadian Rocky Mountains.Fungal Ecology5:36–45DOI 10.1016/j.funeco.2011.08.008. Gotelli NJ, Entsminger GL. 2009.EcoSim: Null models software for ecology. Version 7.Available at:
http://garyentsminger.com/ecosim.htm.
Gotelli NJ, Graves GR. 1996.Null models in ecology. Washington, DC: Smithsonian Institution Press.
Gotelli NJ, McCabe DJ. 2002.Species co-occurrence: a meta-analysis of JM Diamond’s assembly rules model.Ecology83:2091–2096
DOI 10.1890/0012-9658(2002)083[2091:SCOAMA]2.0.CO;2.
Horner-Devine MC, Silver JM, Leibold MA, Bohannan BJM, Colwell RK, Fuhrman JA, Green JL, Kuske CR, Martiny JBH, Muyzer G, Ovre˚as L, Reysenbach AL, Smith VH. 2007. A comparison of taxon co-occurrence patterns for macro- and microorganisms.Ecology
88:1345–1353DOI 10.1890/06-0286.
Huggins JL, Talbot JM, Gardes M, Kennedy PG.Unlocking the environmental keys to host specificity: differential nitrate and acidity tolerance byAlnus-associated ectomycorrhizal fungi.
Fungal EcologyIn Press.
Hung L, Trappe J. 1983.Growth variation between and within species of ectomycorrhizal fungi in response to pHin vitrogrowth.Mycologia75:234–241DOI 10.2307/3792807.
Jones MD, Twieg BD, Ward V, Barker J, Durall DM, Simard SW. 2010. Functional
complementarity of Douglas-fir ectomycorrhizas for extracellular enzyme activity after wildfire or clearcut logging.Functional Ecology24:1139–1151DOI 10.1111/j.1365-2435.2010.01699.x. Kennedy PG. 2010.Ectomycorrhizal fungi and interspecific competition: species interactions,
community structure, coexistence mechanisms, and future research directions.New Phytologist
187:895–910DOI 10.1111/j.1469-8137.2010.03399.x.
Kennedy PG, Garibay-Orijel R, Higgins LH, Angeles-Arguiz R. 2011.Ectomycorrhizal fungi in MexicanAlnusforests support the host co-migration hypothesis and continental-scale patterns in phylogeography.Mycorrhiza21:559–568DOI 10.1007/s00572-011-0366-2.
Kennedy PG, Hill LT. 2010.A molecular and phylogenetic analysis of the structure and specificity of Alnus rubra ectomycorrhizal assemblages.Fungal Ecology 3:195–204
DOI 10.1016/j.funeco.2009.08.005.
Koide R, Fernandez CW, Malcolm G. 2014.Determining place and process: functional traits of ectomycorrhizal fungi that affect both community structure and ecosystem function.New Phytologist201:433–439DOI 10.1111/nph.12538.
Koide R, Suomi L, Stevens C, McCormick L. 1998.Interactions between needles of Pinus resinosa and ectomycorrhizal fungi.New Phytologist140:539–547
DOI 10.1046/j.1469-8137.1998.00293.x.
Koide RT, Xu B, Sharda J, Lekberg Y, Ostiguy N. 2005.Evidence of species interactions within an ectomycorrhizal fungal community.New Phytologist165:305–316
DOI 10.1111/j.1469-8137.2004.01216.x.
Lindahl BD, L¨ucking R, Mart´ın MR, Matheny PB, Nguyen NH, Niskanen T, Oja J,
Peay KG, Peintner U, Peterson M, P˜oldmaa K, Saag L, Saar I, Sch¨ußler A, Scott JA, Sen´es C, Smith ME, Suija A, Taylor DL, Telleria MT, Weiss M, Larsson KH. 2013.Towards a unified paradigm for sequence-based identification of fungi.Molecular Ecology 22:5271–5277
DOI 10.1111/mec.12481.
Lilleskov EA, Bruns TD, Horton TR, Taylor DL, Grogan P. 2004.Detection of forest stand-level spatial structure in ectomycorrhizal fungal communities.FEMS Microbiology Ecology
49:319–332DOI 10.1016/j.femsec.2004.04.004.
Lilleskov EA, Fahey TJ, Horton TR, Lovett GM. 2002.Belowground ectomycorrhizal fungal community change over a nitrogen deposition gradient in Alaska.Ecology83:104–115
DOI 10.1890/0012-9658(2002)083[0104:BEFCCO]2.0.CO;2.
Martin KJ, Posavatz NJ, Myrold DD. 2003.Nodulation potential of soils from red alder stands covering a wide age range.Plant and Soil254:187–192DOI 10.1023/A:1024955232386. Mayfield MM, Levine JM. 2010.Opposing effects of competitive exclusion on the phylogenetic
structure of communities.Ecology Letters13:1085–1093DOI 10.1111/j.1461-0248.2010.01509.x. McGuire KL, Payne SG, Palmer MI, Gillikin CM, Keefe D, Kim SJ, Gedallovich SM, Discenza J,
Rangamannar R, Koshner JA, Massmann AL, Orazi G, Essene A, LeffJW, Fierer N. 2013. Digging the New York city Skyline: soil fungal communities in green roofs and city parks.
PLoS ONE8:e58020DOI 10.1371/journal.pone.0058020.
McMurdie PJ, Holmes S. 2014. Waste not, want not: why rarefying microbiome data is inadmissable.PLoS Computional Biology10:e1003531DOI 10.1371/journal.pcbi.1003531. Michalet R, Brooker RW, Cavieres LA, Kikvidze Z, Lortie CJ, Pugnaire FI, Valiente-Banuet A,
Callaway RM. 2006.Do biotic interactions shape both sides of the humped-back model of species richness in plant communities?Ecology Letters9:767–773
DOI 10.1111/j.1461-0248.2006.00935.x.
Miller S, Koo CD, Molina R. 1992.Early colonization of red alder and Douglas fir by
ectomycorrhizal fungi andFrankiain soils from the Oregon coast range.Mycorrhiza2:53–61
DOI 10.1007/BF00203250.
Nguyen NH, Smith D, Peay KG, Kennedy PG.Parsing ecological signal from noise in next generation amplicon sequencing.New PhytologistIn PressDOI 10.1111/nph.12923. Ovaskainen O, Hottola J, Siitonen J. 2010.Modeling species co-occurrence by multivariate
logistic regression generates new hypotheses on fungal interactions.Ecology91:2514–2521
DOI 10.1890/10-0173.1.
Pan JJ, May G. 2009.Fungal–fungal associations affect the assembly of endophyte communities in maize (Zea mays).Microbial Ecology58:668–678DOI 10.1007/s00248-009-9543-7.
Peay KG, Baraloto C, Fine PVA. 2013.Strong coupling of plant and fungal community structure across western Amazonian rainforests. The ISME Journal 7:1852–1861
DOI 10.1038/ismej.2013.66.
Peay KG, Kennedy PG, Bruns TD. 2008.Fungal community ecology: a hybrid beast with a molecular master.Bioscience58:799–810DOI 10.1641/B580907.
Pickles BJ, Genney DR, Anderson IA, Alexander IJ. 2012.Spatial analysis of ectomycorrhizal fungi reveals that root tip communities are structured by competitive interactions.Molecular Ecology21:5110–5123DOI 10.1111/j.1365-294X.2012.05739.x.
Pickles BJ, Genney DR, Potts JM, Lennon JJ, Anderson IA, Alexander IJ. 2010. Spatial and temporal ecology of Scots pine ectomycorrhizas. New Phytologist 186:755–768
P˜olme S, Bahram M, Yamanaka T, Nara K, Dai YC, Grebenc T, Kraigher H, Toivonen M, Wang PH, Matsuda Y, Naadel T, Kennedy PG, K˜oljalg U, Tedersoo L. 2013.Biogeography of ectomycorrhizal fungi associated with alders (Alnusspp.) in relation to biotic and abiotic variables at the global scale.New Phytologist198:1239–1249DOI 10.1111/nph.12170. Pritsch K, Becerra A, Polme S, Tedersoo L, Schloter M, Agerer R. 2010.Description and
identification ofAlnusacuminata ectomycorrhizae from Argentinean alder stands.Mycologia
102:1263–1273DOI 10.3852/09-311.
R Core Team. 2013.R: A language and environment for statistical computing. Vienna: R Foundation for Statistical Computing.Available athttp://www.R-project.org/.
Richard L. 1968.Ecologie de l’aune vert (Alnusviridis Chaix).Documents pour la carte de la v´eg´etation des Alpes6:107–147.
Rochet J, Moreau PA, Manzi S, Gardes M. 2011.Comparative phylogenies and host specialization in the alder ectomycorrhizal fungi Alnicola, Alpova and Lactarius (Basidiomycota) in Europe.
BMC Evolutionary Biology11:40DOI 10.1186/1471-2148-11-40.
Rodriguez RJ, White JF, Arnold AE, Redman RS. 2009.Fungal endophytes: diversity and functional roles.New Phytologist182:314–330DOI 10.1111/j.1469-8137.2009.02773.x. Roy M, Rochet J, Manzi S, Jargeat P, Gryta H, Moreau PA, Gardes M. 2013.What determines
Alnus-associated ectomycorrhizal community diversity and specificity? A comparison of host and habitat effects at a regional scale.New Phytologist198:1228–1238DOI 10.1111/nph.12212. Schloss PD, Westcott SL, Ryabin T, Hall JR, Hartmann M, Hollister EB, Lesniewski RA,
Oak-ley BB, Parks DH, Robinson CJ, Sahl JW, Stres B, Thallinger GG, Van Horn DJ, Weber CF. 2009.Introducing mothur: open-source, platform-independent, community-supported software for describing and comparing microbial communities.Applied and Environmental Microbiology75:7537–7541DOI 10.1128/AEM.01541-09.
Schoener TW. 1983. Field experiments on interspecific competition.American Naturalist
122:240–285DOI 10.1086/284133.
Smith DP, Peay KG. 2014.Sequence depth, not PCR replication, improves ecological inference from next generation DNA sequencing.PLoS ONE9:e90234
DOI 10.1371/journal.pone.0090234.
Smith SE, Read DJ. 2008.Mycorrhizal symbiosis. 3rd edition. New York: Elsevier.
Stone L, Roberts A. 1990.The checkerboard score and species distributions.Oecologia85:74–79
DOI 10.1007/BF00317345.
Tedersoo L, May TW, Smith ME. 2010. Ectomycorrhizal lifestyle in fungi: global diversity, distribution, and evolution of phylogenetic lineages.Mycorrhiza20:217–263
DOI 10.1007/s00572-009-0274-x.
Tedersoo L, Nilsson RH, Abarenkov K, Jairus T, Sadam A, Saar I, Bahram M, Bechem E, Chuyong G, K˜oljalg U. 2010. 454 Pyrosequencing and Sanger sequencing of tropical mycorrhizal fungi provide similar results but reveal substantial methodological biases.New Phytologist188:291–301DOI 10.1111/j.1469-8137.2010.03373.x.
Tedersoo L, Suvi T, Jairus T, Ostonen I, P˜olme S. 2009.Revisiting ectomycorrhizal fungi of the genusAlnus: differential host specificity, diversity and determinants of the fungal community.
New Phytologist182:727–735DOI 10.1111/j.1469-8137.2009.02792.x.
Toju H, Yamamoto S, Sato H, Tanabe AS. 2013. Sharing of diverse mycorrhizal and
Walker JKM, Cohen H, Higgins LM, Kennedy PG. 2014.Testing the link between community structure and function for ectomycorrhizal fungi involved in a global tri-partite symbiosis.New Phytologist202:287–296DOI 10.1111/nph.12638.
Wallander H, Nilsson LO, Hagerberg D, Baath E. 2001.Estimation of the biomass and seasonal growth of external mycelium of ectomycorrhizal fungi in the field.New Phytologist151:753–760
DOI 10.1046/j.0028-646x.2001.00199.x.
Wubet T, Christ S, Sch¨oning I, Boch S, Gawlich M, Schnabel B, Fischer M, Buscot F. 2012. Differences in soil fungal communities between European beech (Fagus sylvatica L.) dominated forests are related to soil and understory vegetation.PLoS ONE7:e47500