ISSN 1549-3652
© 2012 Science Publications
54
Minority Serving College and University Cost Efficiencies
Thomas Sav, G.
Department of Economics, Raj Soin College of Business,
Wright State University Dayton, Ohio 45440, United States
Abstract: Problem statement: Higher education minority enrollment growth has far outstripped white non-minority growth in the United States. Minority serving colleges and universities have disproportionately attended to that growth and will continue to play a critical role in providing minority educational opportunities in a knowledge based and globally diverse economy. However, they will face new and challenging budgetary and managerial reforms induced by the global financial crisis. As a result, they will be pressured to operate in the future with greater cost efficiency. Approach: Panel data pertaining to minority serving colleges and universities was used along with stochastic frontier analysis to provide cost inefficiency estimates over a four year academic period. Specification of an inefficiency component contained time varying institutional characteristics and influences, including a public Vs. private ownership control. Results: Minority College and university mean inefficiency was estimated to be approximately 1.24, indicating a 24% operation above the frontier cost. The study found that institutions achieved inefficiency reductions or efficiency gains in 2008-09 compared to 2005-06. The findings suggested that private institutions operated at greater inefficiencies relative to their publicly owned counterparts. However, the private sector laid claim to the most efficient institution, but also the most inefficient one. While the public minority serving colleges showed inefficiency deterioration over time, the findings point to private institution efficiency gains. Conclusion/Recommendations: A literature survey indicated that the study could be the first attempt at providing empirical estimates and subsequent insights into the operating cost efficiencies or inefficiencies of minority serving colleges and universities. The cost inefficiency findings suggested that these institutions did compare favorably in their managerial skills. However, as additional academic years of observations become available, they should be employed to determine the sustainability of the efficiency levels and gains uncovered in the present study.
Key words: Cost inefficiency, minority serving colleges and universities, stochastic frontier, Integrated Postsecondary Education Data System (IPEDS)
INTRODUCTON
The purpose of this study is to provide empirical estimates of the operating cost efficiencies of minority serving colleges and universities in the United States. These colleges and universities are officially defined as having a minority student population that exceeds 50% of the total enrollment. They play a key role in serving an ever increasing racially and ethnically diverse population and preparing minorities for success in a global, knowledge based economy. The efficiency with which they produce higher education is critical to the need for their continued success, especially in view of the fact that the global financial crisis has and will continue to bring new budgeting models and management reforms to all of higher education. Thus, the operating cost efficiency of these minority colleges
and universities should be of both public and managerial interest.
population will increase 77%, Black population by 32 and Asian by 69% (Kelly, 2005). A number of minority institutions are a century or more old, such as the Historically Black Colleges and Universities and Tribal Colleges and Universities in the U.S. Others are relatively new in minority status and are Hispanic or Asian serving institutions. And while minority enrollments have continued to increase at other so-called non-minority serving postsecondary institutions, it is obvious that the minority serving colleges and universities occupy a unique position in providing minority higher education opportunities.
To estimate the cost efficiency or inefficiency of minority serving colleges and universities the study employs stochastic frontier analysis using institutional panel data. The data take in a total of four academic years; 2005-09. Cost inefficiency is estimated as cost incurred above the minimum cost frontier. Thus, numerical measures of inefficiency can assume values of one or greater than one with the divergence from one being the extent of inefficiency. A Cobb-Douglas function is used to capture the underlying cost structure. The inefficiency component is specified as a being influenced by college and university characteristics, including inefficiency potentially arising from differences in ownership structure, viz., public compared to private non-profit colleges and universities. The time varying dynamics of institutional inefficiencies are explored over each of the four academic years.
MATERIALS AND METHODS
The development of stochastic frontier analysis used in this study is rooted in the seminal works of Aigner et al. (1977) and Meeusen and Broech (1977). Theoretical and methodological contributions building upon those works are plentiful and are well presented in Kumbhakar et al. (2003); Coelli (2005) and Fried et al. (2008). Although the general methodology is equally applicable to production and cost analysis, the interest in this study lies with the latter. In the panel data framework, the basic cost model for institution i in time period t can be expressed as Eq. 1:
it it it it i 1,..., N t 1, ..., T
C =Xβ +(u +v ) = = (1)
where, C is the total cost of production, Xit is an m ×1
vector of outputs and input prices, β is a vector of unknown parameters and the error term contains two components. The vit portion of the error represents the
usual random component that affects an institution’s
cost through exogenous shocks such as earthquakes, tsunamis, or labor strikes. It can also be due to errors of observation but is assumed to follow a normal distribution with zero mean and variance σv
2
. In contrast, the nonnegative uit component measures cost
inefficiency due to environmental factors and factors under the control of the institution. Inefficiency influences can be embedded in certain characteristics of the institution’s inputs or can be due to managerial decision-making within the institution. Under the Battese and Coelli (1995) specification, these environmental factors are assumed to enter inefficiency such that the uit are independently
distributed with a zero truncated normal distribution with mean mit = zit and variance σu
2
, where z is a vector of inefficiency determinants and ∗ is a vector of parameters to be estimated. The inefficiency of the ith institution at time t can be determined by exp (uit).
Being that the inefficiency component is non-negative (uit≥0), the institutional inefficiency can assume
values greater than or equal to one, where any deviation from the value of one indicates how far the institution operates above its cost frontier.
Maximum likelihood is the usual model estimation technique. The Battesse and Corra (1977) reparameterization requires that σ2 = σv2+σu2. An
estimate of γ = σu2/σ2 is produced and must, thereby, lie
in the interval of zero to one. It can be employed to test if the frontier is stochastic. For γ = 0 the inefficiency effects in Eq. 1 are irrelevant and other econometric techniques would be preferred for estimation purposes. For γ = 1, the random effects can be removed from Eq. 1 and all cost deviations would be due to institutional operating inefficiencies.
masked by differences in the specific data and create an inability to reformulate the efficiency scores and place them on an equivalent scale to Stevens (2005) inefficiency scores. Two other higher education cost frontier studies are also of note but use different modeling assumptions. The Izadi et al. (2002) study uses a 1994-95 cross section of 99 British higher education institutions and Johnes and Johnes (2009) uses a 2000-03 panel data of 121 English institutions. Among all these studies, there exist substantial differences in the specification of the cost frontiers, the use of cross sectional time invariant vs. panel data inefficiency structures and the number of variables and their definitions used in the studies. As a result, comparative evaluations are beyond the ability and scope of the present inquiry.
In empirical studies, the vast majority of stochastic frontier analyses have used either the translog or Cobb-Douglas specification for the cost function. Preliminary investigations in the present study indicated that most of the translog coefficients failed to reach reasonable levels of statistical significance while the Cobb-Douglas revealed superior statistical performance. Therefore, the institution’s cost (C) is modeled with a multi-product Cobb-Douglas form as follows Eq. 2:
it 0 j it , j k it ,k it it
j k
ln C = β +
∑
βln Y +∑
β ln p +(v +u ) (2)where, outputs and input prices are represented by the Yjand pkfor the N universities over T academic years.
In Eq. 2, empirical measures for the outputs and input prices are, of course, dependent upon data availability. Past studies have included full-time equivalent undergraduate and graduate enrollments as educational output measures, research grant revenues to proxy overall institutional research output and, in some cases, a faculty wage or average faculty salary for an input price (Cohn et al., 1989; Koshal and Koshal, 1999; Sav, 2004; Lenton, 2008). For the present specification, the same measures are employed but faculty wages are included for faculty on nine month salary contracts and for faculty on twelve month faculty contracts. Some institutions employ faculty under both contractual arrangements while others use one or the other for accounting purposes. In addition, to account for capital input prices, included is the year-end value of the institution’s buildings. Thus, the three output measures along with the three input prices for empirical implementation of (2) are:
UGRAD = Full time equivalent undergraduate enrollments,
GRAD = Full time equivalent graduate enrollments,
RESCH = Research grant revenues,
FACW9 = Nine month contract faculty wage based on average salary,
FACW12 = Nine month contract faculty wage based on average salary,
CAP = Capital price based on year-end value of buildings and for estimation purposes, all are in natural logarithms.
To take full advantage of the panel data, it is assumed that the operating cost efficiency of colleges and universities depends upon specific time varying institutional characteristics. First and foremost, that includes the minority level of the institution as measured by the percent minority student enrollment. But operating cost efficiency is also assumed to be influenced by overall student characteristics, including their financial ability to continue with their higher education pursuits and the quality of their primary and secondary schooling. A proxy intended to capture both is the percent of students enrolled that are on low income federal grants. The institutions ability to retain students can also affect cost efficiency. For underprepared students, some institutions, perhaps more than others, offer developmental courses and others engage better than others in providing student advising and non-instructional student services. The student retention rate serves as the aggregate institutional measure to capture the inter-institutional variation in the success of such endeavors. Student retention can be viewed as the result of a combined effort of faculty and administration. In contrast, the institutional debt is included in the inefficiency component as a better measure of internal managerial or administrative decision-making and skill.
Following Battese and Coelli (1995), these college and university characteristics are included in the inefficiency determination as follows Eq. 3:
it 0 r r,it it r
u = δ +
∑
δz +w (3)Where:
wit = The normal random component
uit = The truncated distribution with the mean being
conditional on (3) and variance σu 2
Table 1: Variable means and standard deviations
All institutions Public institutions Private institutions
--- --- ---
Variable Mean SD Mean SD Mean SD
C 8.23E+07 8.23E+07 1.35E+08 9.74E+07 4.14E+07 1.01E+08
UGRAD 3770.000000 3770.000000 6813.000000 7328.000000 1404.000000 1242.000000
GRAD 410.000000 410.000000 753.000000 916.000000 144.000000 334.000000
RESCH 1.47E+07 1.47E+07 2.48E+07 1.97E+07 6.85E+06 9.93E+06
FACW9 52028.000000 52028.000000 62201.000000 10088.000000 44116.000000 17942.000000
FACW12 5.14E+04 5.14E+04 6.29E+04 3.32E+04 4.24E+04 2.86E+04
CAP 1.03E+08 1.03E+08 1.72E+08 1.27E+08 4.93E+07 8.84E+07
MINORITY 81.660000 81.660000 81.610000 13.240000 81.710000 16.840000
LOWINC 64.380000 64.380000 60.830000 12.710000 67.150000 18.850000
RETENT 62.140000 62.140000 65.450000 9.880000 59.560000 16.740000
DEBT 36.390000 36.390000 35.890000 29.010000 36.780000 18.390000
CONTROL 0.560000 0.560000 0.000000 0.000000 1.000000 0.000000
Observations 512.000000 224.000000 288.000000
MINORITY = Percent student minority enrollment
LOWINC = Percent students on low income Government grants
RETENT = Full time student retention measured as students returning fall term DEBT = Percent liabilities to assets
CONTROL = 1 institutional control is private non-profit, 0 otherwise
The control variable is intended to measure the inefficiency differential that may potentially exist in ownership structures defined by private non-profit colleges and universities relative to public institutions. Ownership control is included as an inefficiency determinant not as an effect on cost structure. Thus, it is assumed that public and private non-profit colleges and universities have access to the same production technology and the same labor and capital markets. A Chow test on the ordinary least squares estimates indicated that there was no statistically significant difference in the cost structures and, therefore, separate ownership estimates of 1 and 2 could not be justified. However, as indicated in the results follow, there is a significant ownership effect on inefficiency.
Data: The U.S. Department of Education maintains a list of postsecondary institutions enrolling significant populations of minority students. The list is used to assist in determining institutional eligibility for specific federal grants and programs. The list of minority institutions in based on the enrollment data collected by the National Center for Education Statistics and housed in Integrated Postsecondary Education Data System (IPEDS). Colleges and universities on the list have been determined to report more than 50% of total enrollment as belonging to a minority group as defined by American Indian, Alaska Native, Black and Hispanic. Enrollment is
defined at the postsecondary undergraduate level, although some of the same institutions engage in graduate education. Institutions with Asian-American student populations may be classified as minority institutions for certain federal programs but may not be on this list. Public and private non-profit colleges and universities are included on the list but the Department excludes for-profit institutions.
For panel data estimation, the most recent four academic years, 2005-09, of surveys are obtained from IPEDS. The minority institutions list was merged with the IPEDS surveys and institutions were omitted that failed to report necessary cost and enrollment data. The final useable sample included an unbalanced set of 128 colleges and universities for a total of 512 observations.
Table 1 presents the means and standard deviations of the cost and inefficiency variables. The summaries are presented for all institutions combined and separately for public and private colleges and universities. The total cost measure is the academic year total operating expenditures. Interestingly, on average, public and private sectors have nearly identical minority enrollments at approximately 82%. Public institutions, however, have substantially greater undergraduate enrollment, graduate enrollment and research outputs. In addition, publics have higher wage structures for both nine and twelve month contract faculty. Public institutions also have a slightly higher student retention rate but a lower percentage of students on low income grants. Both ownership structures carry approximately the same debt.
RESULTS AND DISCUSSION
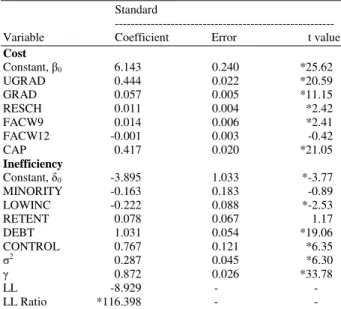
technique. In addition, ∗ is statistically significant at well above the 1% level and, therefore, indicates that inefficiency is present in affecting the overall costs of minority colleges and universities. That is, the share of inefficiency in the combined error is approximately 87%.
Overall, the cost model performs well. All of the output coefficients as well as the nine month faculty wage and the capital price proxy are statistically significant at better than the 1% level of significance. In addition, they all carry the expected cost increasing effect. Although the twelve month faculty wage enters with the unexpected negative sign, it fails to reach any reasonable level of statistical significance. For the Cobb-Douglas specification, the coefficients are the cost elasticities. Thus, for a 1% increase in undergraduate enrollments, there occurs an estimated 0.444% increase in college and university costs. Among the three outputs, that is by far the largest cost elasticity. A 1% increase in graduate education or research produces a cost increase of only a 0.057 and 0.011%, respectively. As would be expected, capital improvements carry greater cost increases relative to increased faculty wages.
Equally encouraging are the results for the inefficiency specification. Positive coefficients indicate increases in inefficiency and, therefore, negative coefficients can be viewed as efficiency improvements. Thus, increases in minority enrollments lead to increased efficiency and suggest that these institutions are adept at minority education. However, has indicated, its effect is statistically insignificant, indicating that perhaps the marginal effect would be only slight given that minority student enrollments are already at high levels. Somewhat counter intuitive is the efficiency improvement effect associated with increased enrollment of low income grant recipient students. However, if such students are generally of like social and economic backgrounds, then it is possible that it is more efficient for the institution to produce education and student services for more homogenous student populations, i.e., more specialization in this sense may offer efficiency gains. Yet, the coefficient for the retention variable indicates that institutional attempts to increase student retention tends to create inefficiency, but not to a high degree of statistical significance.
Of all the inefficiency determinants, institutional debt is estimated to have the largest inefficiency impact. And while as currently employed it is not likely to be a complete measure of internal management decision-making skills, it does support the general view that debt management, at least beyond some point.
Table 2: Institution frontier estimates Standard
---
Variable Coefficient Error t value
Cost
Constant, β0 6.143 0.240 *25.62
UGRAD 0.444 0.022 *20.59
GRAD 0.057 0.005 *11.15
RESCH 0.011 0.004 *2.42
FACW9 0.014 0.006 *2.41
FACW12 -0.001 0.003 -0.42
CAP 0.417 0.020 *21.05
Inefficiency
Constant, δ0 -3.895 1.033 *-3.77
MINORITY -0.163 0.183 -0.89
LOWINC -0.222 0.088 *-2.53
RETENT 0.078 0.067 1.17
DEBT 1.031 0.054 *19.06
CONTROL 0.767 0.121 *6.35
σ2 0.287 0.045 *6.30
γ 0.872 0.026 *33.78
LL -8.929 - -
LL Ratio *116.398 - -
Generates cost inefficiency impact. The ownership control variable is the final inefficiency determinant and its positive coefficient reveals greater operating cost inefficiencies among private non-profit relative to publicly owned minority colleges and universities. That differential ownership effect is explored in greater detail in what is to follow.
Table 3: Inefficiency estimates by year and control All Minority Institutions
---
Year 05-09 05-06 06-07 07-08 08-09
Mean 1.237 1.283 1.211 1.230 1.229
Median 1.149 1.144 1.142 1.151 1.156
S.D. 0.328 0.465 0.238 0.260 0.294
Skewness 5.399 4.607 4.793 4.500 5.532
Minimum 1.031 1.036 1.033 1.033 1.031
Maximum 4.196 4.196 2.845 3.032 3.360
N 512.000 128.000 128.000 128.000 128.000
Public minority institutions
Mean 1.159 1.144 1.149 1.166 1.176
Median 1.118 1.104 1.113 1.127 1.138
S.D. 0.134 0.116 0.127 0.147 0.145
Skewness 3.116 2.905 3.314 3.317 2.926
Minimum 1.042 1.042 1.050 1.060 1.055
Maximum 1.844 1.618 1.764 1.844 1.757
N 224.000 55.000 56.000 56.000 57.000
Private minority institutions
Mean 1.298 1.389 1.259 1.273 1.271
Median 1.184 1.200 1.184 1.184 1.167
S.D. 0.410 0.590 0.288 0.316 0.369
Skewness 4.416 3.513 4.229 3.967 4.718
Minimum 1.031 1.036 1.033 1.033 1.031
Maximum 4.196 4.196 2.845 3.032 3.360
N 288.000 73.000 72.000 72.000 71.000
Table 4: Inefficiency distributions by control
All Public Private
Percentile institutions institutions institutions
5th 1.066 1.063 1.070
10th 1.079 1.071 1.083
25th 1.103 1.092 1.124
50th 1.149 1.119 1.185
75th 1.252 1.167 1.306
90th 1.411 1.252 1.468
99th 3.032 1.757 3.360
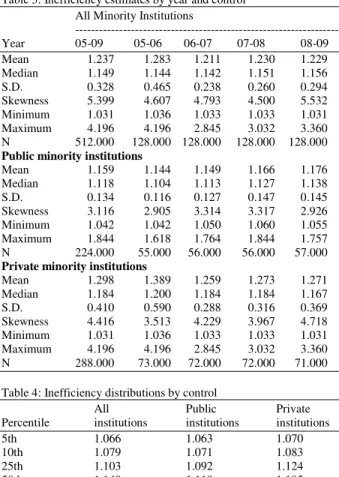
Table 4 compares the percentile distributions of inefficiency scores. At the 25th and below percentiles, there is little difference in the public and private inefficiency densities. At the median, 50th percentile, the divergence in the public-private densities begins to widen. Beyond the 50th percentile, the private college and university distribution tails out to larger inefficiencies and exhibits the larger positive skewness relative to the public institutions.
CONCLUSION
The main thrust of this study was to empirically investigate the cost efficiency of producing higher education among minority serving colleges and universities in the United States. That inquiry seemed to be of particular importance given the increases in minority enrollments in the U.S. and the apparent disproportionate share of those enrollments being attended to at minority serving colleges and
universities. Given the critical role these institutions have played in minority higher education, projected minority population growth suggests that future educational demands could bring serious resource and financial pressures to bear upon management. That, along with changes in higher education finances driven by the global financial crisis, provided the impetus for the current study. Likewise, the inquiry should bring public and managerial interest along with it.
Minority college and university panel data was used in stochastic frontier analysis to provide empirical estimates of operating cost inefficiencies. The overall four year, 2005-09, mean inefficiency estimate was approximately 1.24 while the median was 1.15. Thus, minority serving institutions were estimated to operate on average at about 24% above their minimum frontier costs. Fifty percent of the institutions, however, were below 15%. The findings indicate that the aggregate of institutions managed to put into place a substantial efficiency gain (inefficient reduction) from the 2005-06 to the 2008-09 academic year. When results were decomposed by public Vs. private non-profit institutions, the findings showed that private minority colleges and universities operate more inefficiently than their public counterparts. The average private inefficiency score was approximately 1.30 while the public score came in at 1.16. However, in each academic year and overall, the private sector laid claim to the most efficient operating institution. At the same time, it offered the most inefficient institution. As a group, the public sector inefficiencies deteriorated from the 2005-06 to the 2008-09 academic years while private institutions developed efficiency improvements.
REFERENCES
Abbott, M. and C. Doucouliagos, 2009. Competition and efficiency: Overseas students and technical efficiency in Australian and New Zealand universities. Educ. Econ., 17: 31-57. DOI: 10.1080/09645290701773433
Aigner, D., C.A.K. Lowell and P. Schmidt, 1977. Formulation and estimation of stochastic frontier production function models. J. Econ., 6: 21-37. DOI: 10.1016/0304-4076(77)90052-5
Battese, G.E. and T.J. Coelli, 1995. A Model for Technical inefficiency effects in a stochastic frontier production function for panel data. Empirical Econ., 20: 325-332. DOI: 10.1007/BF01205442
Battesse, G.E. and G.S. Corra, 1977. Estimation of production frontier model: With application to the pastoral zone of eastern Australia. Aus. J. Agric. Econ., 21: 169-179.
Coelli, T., 2005. An Introduction to Efficiency and Productivity Analysis. 2nd Edn., Springer, New York, ISBN: 0387242651, pp: 349.
Cohn, E., S.L.W. Rhine and M.C. Santos, 1989. Institutions of higher education as multi-product firms: Economies of scale and scope. Rev. Econ. Stat., 71: 284-290. DOI: 10.2307/1926974
Fried, H.O., C.A.K. Lovell and S.S. Schmidt, 2008. The Measurement of Productive Efficiency and Productivity Growth. 1st Edn., Oxford University Press, New York, ISBN-13: 9780195183528, pp: 638.
Izadi, H., G. Johnes, R. Oskrochi and R. Crouchley, 2002. Stochastic frontier estimation of a CES cost function: The Case of higher education in Britain. Econ. Educ. Rev., 21: 63-71. DOI: 10.1016/S0272-7757(00)00044-3
Johnes, G. and J. Johnes, 2009. Higher education institutions’ costs and efficiency: Taking the decomposition a further step. Econ. Educ. Rev., 28: 107-113. DOI: 10.1016/j.econedurev.2008.02.001
Kelly, P., 2005. As america becomes more diverse: The impact of state higher education inequality. National Center for Higher Education ManagementSystem.
Koshal, R.K. and M. Koshal, 1999. Economies of scale and scope in higher education: A case of comprehensive universities. Econ. Educ. Rev., 18: 269-277. DOI: 10.1016/S0272-7757(98)00035-1 Kumbhakar, S., S.C. Kumbhakar and C.A.K. Lovell,
2003. Stochastic Frontier Analysis. 1st Edn., Cambridge University Press, New York, ISBN: 0521666635, pp: 344.
Lenton, P., 2008. The cost structure of higher education in further education colleges in England. Econ.
Educ. Rev., 27: 471-482. DOI:
10.1016/j.econedurev.2007.05.003
Li, X. and C.D. Carroll, 2007. Characteristics of minority-serving institutions and minority undergraduates enrolled in these institutions: Postsecondary education descriptive analysis report (NCES 2008-156). National Center for Education Statistics.
McMillan, M.L. and W.H. Chan, 2006. University efficiency: A Comparison and consolidation of results from stochastic and non‐stochastic methods.
Educ. Econ., 14: 1-30. DOI:
10.1080/09645290500481857
Meeusen, W. and J.V.D. Broech, 1977. Efficiency estimation from Cobb-Douglas production functions with composed error. Int. Econ. Rev., 18: 435-444.
Sav, G.T., 2004. Higher education costs and scale and scope economies. Applied Econ., 36: 607-614. DOI: 10.1080/0003684042000217643