Geraldoda Silvae Souza ricardo coelhode Faria TiTo Belchior S. Moreira
Resumo
Este artigo compara eficiências custo de empresas publicas e privadas brasileiras de oferta de água. Para mensurar a eficiência faz-se uso de um modelo de fronteira estocástica definido por meio de uma função custo na família Cobb-Douglas. A especificação da fronteira inclui efeitos técnicos. Estima-se o modelo pelo método de máxima verossimilhança para um painel de firmas brasileiras observadas no período 2002-2004. Os resultados estatísticos indicam evidência de que as firmas públicas são mais eficientes, embora a diferença em eficiência esteja declinando no período analisado. De um modo geral, o sistema de oferta de água e saneamento está se tornando mais eficiente ao longo do tempo.
PalavRas-Chave
oferta de água, fronteira estocástica, eficiência de custo, dados de painel
abstRaCt
This paper compares cost efficiencies of Brazilian public and private companies of water supply. To mea-sure efficiency a Cobb-Douglas stochastic cost frontier model including technical effects is estimated by maximum likelihood to a panel of Brazilian firms for the period 2002 - 2004. The statistical results indicate that there is evidence that public firms are more efficient although the difference in efficiency is declining over time. Overall the system of water and sewerage supply is becoming more efficient over time.
KeywoRds
water supply, stochastic frontier, cost efficiency, panel data
Jel ClassifiCation
R15, R38
Embrapa. Endereço para contato: Embrapa – Diretoria Executiva, Secretaria de Administração Estratégica. Parque
Es-tação Biológica, Final Av. W3 Norte, Asa Norte, CEP: 70.770-901. Brasília – DF. E-mail: [email protected].
Universidade Católica de Brasília. Endereço para contato: Universidade Católica de Brasília, Campus II, SGAN 916
Norte, Av. W5, CEP-70.790-160, Brasília-DF. E-mail: [email protected]..
Universidade Católica de Brasília. Endereço para contato: Universidade Católica de Brasília, Campus II, SGAN 916
1 IntRoDuctIon
Despite the effort of the Brazilian government in improving the water and sewerage services in the last years, the services have not been entirely satisfactory and some problems persists, such as low indices of coverage, high indices of loss of water and minor availability of public resources for investments. In this context, the privati-zation of the sector appears as a possible way to improve the performance of the sector. However, the privatization process is being implemented in the absence of well defined regulatory policies. Given this condition, the increase in efficiency with the participation of the private sector is questionable (See Tupper and reSenDe, 2004).
The efficiency of public and private companies in the water industry has been object of study in the literature, especially in the u.S.A., u.K., and some Asian countries1
The literature is controversial with no clear indication on what type of company performs better.
Dealing specifically with Brazil, Faria, Souza and Moreira (2005) fit a stochastic production frontier model for the 2002 to compare technical efficiencies of public and private water supply companies. They show that private companies are only mar-ginally more efficient than public companies. Faria, Souza and Moreira (2005), also for 2002, use a stochastic cost frontier model to conclude that there is not evidence that private firms and public firms are significantly different in terms of efficiency measurements.
This article contributes to the literature on the efficiency of public and private water and sewerage supply companies in Brazil assessing efficiency in a context defined by a panel of firms operating at a county level. The period of concern is 2002-2004. previous studies are restricted to cross-sectional studies at a given year and at the state level.
The article is composed of six sections including the introduction. Section 2 des-cribes the process of privatization of the water and sewerage industry in Brazil. Sections 3 presents a brief review on the literature comparing efficiencies of public and private companies in the water and sewerage industry. In Section 4 we deal with methodological aspects and set forth the stochastic frontier model used in the
article. Section 5 presents the empirical results. Finally, in Section 6, we summarize the statistical findings and present the main conclusions of the article.
2 asPEcts oF thE PRIvatIZatIon oF BRaZIlIan WatER utIlItIEs
The privatization in Brazil initiated in the 90’s, after the creation of the national program of privatization (pnD) by the federal government, under the coordination of BnDeS (Brazilian Development Bank). The water and sanitation services, owned by local counties and states, are still being, slowly, incorporated to the privatization process by means of concessions and sales of stockholding participation. The current Constitution of the Federative republic of Brazil establishes that the three spheres of government (union, States and Local Counties) must act to promote and to guarantee the water and sanitation services. However, this constitution does not de-fine the specific functions of each member of the federation. In the face of it, some impasses appear. For example, the ownership of the water and sanitation services is not yet well defined by the current legislation and has been widely discussed by sector’s specialists.
Although the participation of the private sector has increased in the last years, the larger water and sanitation companies - CeSBs (Basic Sanitation State Companies), created in the 70’s, still are the main agents of the sewerage and water services in the country. The participation of the private sector has occurred mainly in some isolated counties. The first concessions appeared in the middle of the 90’s and since then, they have increased (Moreira, 1998). According to ABCOn (Associação Brasileira das Concessionárias privadas de Serviços públicos em Água e esgoto), there are 41 private concessions in Brazil supplying sewerage and water services to 50 counties in the States of São paulo, rio de Janeiro, espírito Santo, Mato Grosso, Mato Grosso do Sul, Minas Gerais, paraná, pará and Amazonas.
According to Spiller and Savedoff (1999), many of the contracts of public-private partnership have not produced good results in developing countries, especially in Latin America. The experiences in these countries indicate that the lack of clear rules on the tariff readjustments results in an unsustainable system. Also the lack of credi-bility of the governments may lead the public to view the privatization process as a result of favoritism, resulting in a solution of high political cost. Brazil, in particular, has not had experiences very different from other Latin American countries.
stimula-tes the private participation in the water and sewerage sector, provides institutional support and finances contracts of specialized consultants in the elaboration of pro-jects of privatization in the states and counties. In the federal sphere, institutional support is being offered by the national Office of environmental Sanitation (SnSA) by means of the program for the Modernization of the Sanitation Sector - pMSS (pArLATOre, 2000).
Although the institutional supports are important, they do not guarantee a process of adequate privatization. For more than a decade it has been discussed in Brazil the necessity to implement certain legal and institutional instruments with the purpose of consolidating a new model of management compatible with the realities of the sector (SILvA, 1995; eMerCIAnO and BALTAr, 1995; pereIrA, BALTAr and ABICALLI, 1995; reZenDe, 1995; FArIA and FArIA, 2004). recently Brazil approved a Federal Law (Lei 1.445/2007) which now regulates the sector. Although much early to assess the impact of this law it is generally expected that it will be an incentive to increase the participation of the private sector in the sewe-rage and water supply services. We see that further institutional improvements are necessary as the creation of a regulatory agency.
Accordingly to Tupper and resende (2004) the tariff policy for the sector follows a regulation model for the rate of return. In this context, the increase in efficiency, with the participation of the private sector, is questionable. Following the regula-tion theory of incentives of Laffont and Tirole (1993), without adequate incentives, which is the case of the regulation of the rate of return, a firm may maximize its profits without being efficient.
3 a BRIEF lItERatuRE REvIEW
Feigenbaumand and Teeples (1983) compare estimates from a hedonic cost func-tion with estimates derived from a non-hedonic producfunc-tion specificafunc-tion. Despite differences in production technology of water operations, both the hedonic and non-hedonic models suggest that there is no difference in cost-of-service equations for government versus private companies. They use data for 1970, including 57 uS private and 262 uS public water companies.
Byrnes, Grosskopf and Hayes (1986) avoid the cost function approach and focus on the measurements of technical and scale efficiencies relative to a production techno-logy by means of programming techniques. They find no significant difference in efficiency across ownership types. Their sample comprises 68 government owned and 59 privately owned water utilities operating in the uS in 1976. Likewise, Fox and Hofler (1986) concludes that, in terms of aggregate cost, no statistical diffe-rence can be found between technical efficiency estimates for public and private firms, although allocative efficiency differences were observed. The authors use uS cross-section data for 1981 with a sample of 156 publicly and 20 privately owned utilities.
Bhattacharyya, parker and raffiee (1994) presents empirical evidence on the issue of efficiency of the private/public sector examining costs of 225 public and 32 private uS water utilities using the data from a 1992 survey in the water industry. The sta-tistical findings provide evidence that public water utilities are more efficient than private utilities on average, but are more widely dispersed between best and worst practices.
Saal and parker (2001) evaluate the productivity and price performance for the privatized water and sewage service companies of england and Wales. estimates of productivity growth, derived with quality adjusted output indices, suggest that despite reductions in labor usage, total factor productivity growth has not improved since privatization in 1989. Furthermore, total price performance indices reveal that increases in output price have outstripped increases in input costs, a trend which is largely responsible for the increase in economic profits that has occurred since privatization. They use non-parametric methods to determine labor and total factor productivity growth rates for both the 1985-1990 pre-privatization period and the 1990-1999 post-privatization years.
The article of estache and rossi (2002) provides further evidence on the difference between public and private utilities estimating a stochastic cost frontier for a sample of Asian and pacific regional water companies. The results indicate that efficiency is not significantly different between private and public utilities. The sample covers 50 firms surveyed in 1995 in 19 countries.
The Argentine national Government (over half of its provinces) initiated major re-forms of its water and sanitation services during the 1990’s. In this context, estache and Trujillo (2003) show that it is possible to derive an upper bound for the esti-mates of technical efficiency gains achieved by the operators of various water com-panies in Argentina. For the two provinces for which data were available, the gains in efficiency are roughly 2% per year. The authors argue that if these gains can be sustained, they represent quite significant contributions from the reforms of the sector in these provinces.
4 thE thEoREtIcal cost FunctIon
As in Faria, Souza and Moreira (2005) and Souza, Faria and Moreira (2007), our choice of statistical model is a stochastic frontier in the translog family. Within this family we chose the Cobb-Douglas formulation2 since the results of the estimation
process were more consistent with economic theory. Our formulation differs from previous work since it includes a time dependency on the inefficiency component. Imposing linear homogeneity our statistical model takes the form
0
ln
ln
ln
,
1,
, 342,
1, 2, 3
it it
k
it it it
it it
l l
p
C
y
v
u
i
t
p
=
a
+
d
p
+
b
+
+
=
=
where 0 < d < 1, b > 0, and
C
it,p
lit,p
itk, andy
it, denote, respectively, the totalcost , the price of labor (r$/year), the price of capital (r$/km of water network extension) and the level of output for firm
i
in period t. The price of capital wascomputed using the identity
it it it l it k
it
C
p l
p
k
−
=
as in Souza, Faria and Moreira (2007).As a proxy for capital we use the quantity, in Km, corresponding to the length of the piped water network for firm i. Labor is measured by the number of employees at the last day of the year.
The quantities
a
0,
d
and
b
are unknown parameters, the
n
itform a random
sample from the
N
(0,
s
2) for each
t
and are independent over time. The
it
u
are inefficiency components, independent from the
v
it, representing
indepen-dent observations from the
2(
it,
u)
N
+m s
. The variances
s
2and
2u
s
are both
unk-nown. Here
0 1
cov
1 2cov
2 3 2 4 2 5 3 6 4 7 5 8 6it
= +
it+
it+
d
it+
d
it+
d
it+
d
it+
d
it+
d
itm
d
d
d
d
d
d
d
d
d
were the technical effects, Cov1 ( population density), Cov2 (% of water treated),
1
d
(indicator for private firms),d
2,d
3 (indicators of the regions, southeast andsouth, respectively),3 4
d
(indicator for state firms),4 5d
andd
6(time dummies for2003 and 2004, respectively) are assumed to linearly affect the mean mit. The for-mulation of the stochastic frontier model just introduced is flexible in regard to the use of the truncated normal as an inefficiency distribution. See Khumbhakar and Lovell (2000). Lack of enough observations in time precludes the use of more com-plex models to describe time dependence.
The inefficiency of firm
i
in period
t
is computed as
E
(exp(
u
it) |
v
it)
. The
mo-del is to be estimated by maximum likelihood methods. As in Coelli, rao
and Battese (1998) we carry out the estimation process using the
paramete-rization
2(
2 2)
u u
=
+
g s
s
s
. Imposing
g
= 0
implies a non stochastic frontier,
that is, a standard regression model.
5 Data analysIs
The data we use to estimate the stochastic cost frontier model described in Section 4 was obtained from the Brazilian (national) System for Information about Sanitation – SnIS and cover the period 2002-2004. The utility companies in the sample supply water and sewerage services for 133.8 million inhabitants, corresponding to more than 70% of the Brazil’s population. The sample comprises 342 firms of which 324 are public and 18 private. Hence, there are 1026 observations.
3 The regions north and northeast were not included because there are not private companies in these regions. The parameters d2and d3measure differences relative to the center-west region.
The Cobb-Douglas cost frontier including technical effects described in Section 4 was estimated using the software Frontier 4.1 (COeLLI; rAO; BATTeSe, 1998). The results are reported in Table 1.
taBlE 1 - M axIMuM lIkElIhooD EstIM atIon oF thE cost FRon-tIER
Variables Parameter Estimative Standard
Deviation t statistic
Equation of Frontier
Constant a0 -2.432 0.178 -13.626
Capital Price d 0.449 0.016 27.604
Product b 0.863 0.012 73.770
Technical Effects
Constant d0 1.011 0.239 4.234
d1(Type of irm) d1 0.196 0.075 2.613
d2(Southeast region) d2 -0.128 0.057 -2.259
d3(South region) d3 0.385 0.063 6.129
d4(State irms) d4 -0.326 0.042 -7.744
Cov1(density) d5 -0.314 0.079 -3.956
Cov2 (water treatment) d6 0.142 0.036 3.938
d5 (Time_1) d7 0.213 0.037 5.807
d6 (Time_2) d8 0.009 0.036 0.236
Sigma-square s2 0.223 0.009 22.760
Gamma g 0.0004 0.008
-LR one sided test (10df) 292.8
Number of restrictions 13
N 1026
Center-West region. The state firms (d4) are less inefficient than county firms. The population density (Cov1) has a negative sign, i.e., higher values of population densi-ty imply more efficiency (lower cost of distribution). The positive sign of Cov2 is an indication of higher inefficiency due to higher costs of water treatment. efficiency changes trough time. The Inefficiency time effect fell in 2003 relative to 2002 (d5: Time _1>0) and recovered to the 2002 pattern in 2004 (d6: Time_2=0).
We note that the one-sided likelihood ratio test statistic of the hypothesis g = 0 is Lr = 292.8, highly significant, favoring the stochastic frontier model.
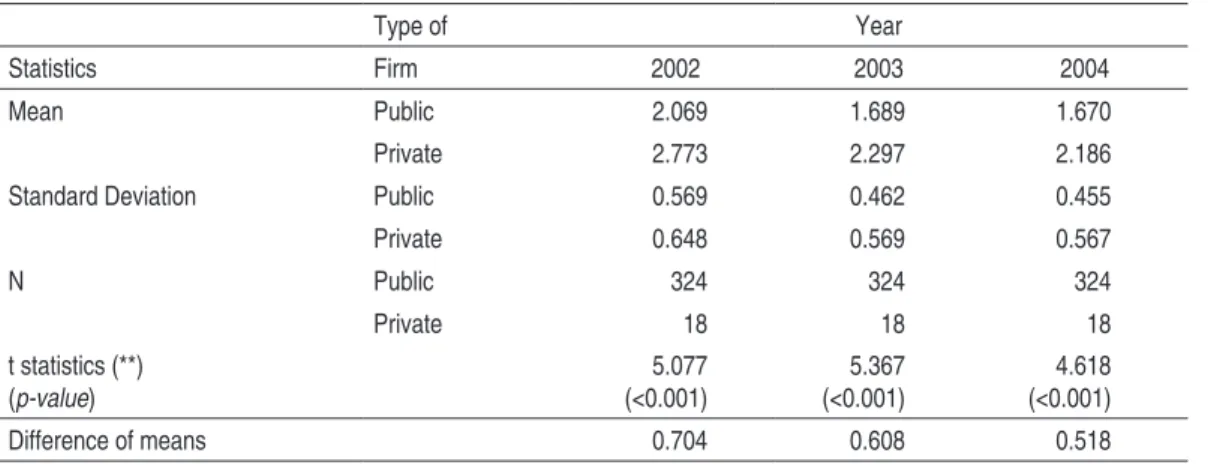
taBlE 2 - DEscRIPtIvE statIstIcs: InEFFIcIEncy scoREs By yEaR anD tyPE oF FIR M
Type of Year
Statistics Firm 2002 2003 2004
Mean Public 2.069 1.689 1.670
Private 2.773 2.297 2.186
Standard Deviation Public 0.569 0.462 0.455
Private 0.648 0.569 0.567
N Public 324 324 324
Private 18 18 18
t statistics (**)
(p-value)
5.077
(<0.001)
5.367
(<0.001)
4.618
(<0.001)
Difference of means 0.704 0.608 0.518
6 conclusIons
This article studies the efficiency effect of private firms in the urban water industry in Brazil considering a panel of firms over the period 2002-2004. In this context a stochastic cost frontier including technical effects. Statistical inference leads to the conclusion that there is evidence that public firms are more efficient although diffe-rences are declining over time. Overall efficiency levels seem to be increasing though time. The results are robust to the choice of functional forms in the sense that the translog and the Cobb-Douglas specifications lead to the same results.
REFEREncEs
ASHTOn, J. Cost efficiency in the uK water and sewerage industry. applied
Econom-ics letters, 7, p. 455-458, 2000.
BHATTACHAryyA, A.; pArKer, e.; rAFFIee, K. An examination of the effect of ownership on the relative efficiency of public and private water utilities. land Economics, May, v.70, n.2, p.197-209, 1994.
BHATTACHAryyA, A.; HArrIS, T.r.; rAFFIee, K. Allocative efficiency of
rural nevada water system: a hedonic shadow cost function approach. Journal
of Regional science, v. 35, n.3, p.485-501, 1995a.
BruGGInK, T. public versus regulated private enterprise in the municipal water
industry: a comparison of operating costs. Quarterly Review of Economics and
Business, v. 22, n.1, p.111-125, 1982.
BynerS, p.; GrOSSKOpF, S.; HAyeS, K. efficiency and ownership: further
evi-dence. Review of Economics and statistics, v. 68, n.2, p.337-341, 1986.
BynerS, p. estimation of cost frontiers in the presence of selectivity bias: ownership and efficiency of water utilities. In: rHODeS, G. (ed.), advances in Econometrics, 9, p.121-137, 1991.
COeLLI, T.; rAO, D. S. prasada.; BATTeSe, George e. An introduction to
ef-ficiency and productivity analysis. kluwer academic Publishers, 1998.
CrAIn, W. Mark; ZArDKOOHI, A. A test of the property-rights theory of the
firm: water utilities in the united States. Journal of law and Economics, 21, p.
395-408, 1978.
CuBBIn, J.; TZAnIDAKIS, G. regression versus data envelopment analysis for efficiency measurement: an application to the england and Wales regulated water industry. utilities Policy, 7, p.75-85, 1998.
eMerCIAnO, e.; BALTAr, L. A. Flexibilização institucional da prestação de serviços de saneamento: implicações e desafios. In: acqua-Plan - Estudos, Projetos e consultoria. Brasília: Ministério do planejamento e Orçamento. Secretaria de política urbana/IpeA, 1995. (Série Modernização do Setor Saneamento, 3). eSTACHe, Antonio; rOSSI, Martín A. How different is the efficiency of public
and private water companies in Asia? the World Bank Economic Review, v.16,
n.1, p. 139-148, 2002.
eSTACHe, Antonio; TruJILLO, Lourdes. Efficiency effects of “privatization” in
argentina’s water and sanitation services. World Bank, 2003. (Working paper)
FArIA, S. A.; FArIA, r. C. Cenários e perspectivas para saneamento e sua interface
com o setor de recursos hídricos. Revista de Engenharia sanitária e ambiental,
v.9, n. 3, p. 202-210, 2004.
FArIA, ricardo C.; SOuZA, Geraldo da S.; MOreIrA, Tito Belchior S. public
versus private water utilities: empirical evidence for Brazilian companies.
Eco-nomics Bulletin, v.8, n.2, p.1-7, 2005.
FeIGenBAuM, S.; TeepLeS, r. public versus private water delivery: a hedonic
cost approach. Review of Economics and statistics, 65, p. 672-678, 1983.
FOx, W.; HOFLer, r. using homothetic composed error frontiers to measure water
utility efficiency. southern Economic Journal, 53, n. 2, p. 461-477, 1986.
KHuMBHAKAr, S.C.; LOveLL, C.A.K. stochastic frontier analysis. ny: Cambridge
university press, 2000.
LAFFOnT, Jean-Jacques; TIrOLe, Jean. a theory of incentives in procurement and
MOrGAn, D. Investor owner vs. public owned water agencies: an evaluation of
the property rights theory of the firm. Water Resources Bulletin, v.13, n. 4, p.
775-781, 1997.
pArLATOre, A. C. privatização do setor de saneamento no Brasil. In: a privatização
no Brasil: caso dos serviços de utilidade pública. rio de Janeiro: BnDeS, 2000.
pereIrA, D. S. p.; BALTAr, L. A.; ABICALLI, e. M. T. saneamento: modernização
e parceria com o setor privado. Brasília: Ministério do planejamento e Orçamento. Secretaria de política urbana/IpeA, 1995. (Série Modernização do Setor Sa-neamento, 9).
rAFFIee, K., nArAyAnAn, r.; HArrIS, T., LAMBerT, D.; COLLInS, J.
Cost analysis of water utilities: a goodness-of-fit approach. atlantic Economic
Journal, v. 21, n.3, p.18-29, 1993.
reZenDe, F.novo modelo de financiamento para o setor saneamento. Brasília:
Minis-tério do planejamento e Orçamento. Secretaria de política urbana/IpeA, 1995. (Série Modernização do Setor Saneamento, v. 2).
SAAL, David S.; pArKer, D. The impact of privatization and regulation on the water and sewerage industry in england and Wales: a translog cost function
model. Managerial and Decisions Economics, 21, p. 253-268, 2000.
______. productivity and price performance in the privatized water and sewerage
companies of england and Wales. Journal of Regulatory Economics, v. 20, n.1, p.
61-90, 2001.
______; WeyMAn-JOneS, Tom. Determining the contribution of technical, ef-ficiency, and scale change to productivity growth in the privatized english and
Welsh water and sewerage industry: 1985:2000. aston Business school Working
Paper rp0433, December 2004.
SAAL, David S.; pArKer, D. Assessing the performance of water operations in
the english and Welsh water industry: A panel input function approach. aston
Business school Working Paper rp0502, January 2005.
SHAOuL, J. A critical financial analysis of the performance of privatized industries:
the case of the water industry in england and Wales. critical Perspectives on
ac-counting, 8, p.479-505, 1997.
SpILLer, p. T.; SAveDOFF, W. D. Government opportunism and the provision of water. In: SAveDOFF, W. D; SpILLer, p. T. spilled water: institutional commitment in the provision of water services. Washington, D. C.:Inter American
Development Bank,1999.
SILvA, J. A. C. Diagnóstico do setor saneamento: estudo econômico e financeiro. aliança
- Pesquisa e Desenvolvimento. Brasília: Ministério do planejamento e Orçamento. Secretaria de política urbana/IpeA, 1995, 251p. (Série Modernização do Setor Saneamento).
a stochastic cost frontier approach. Journal of the american Water Resources as-sociation - JaWRa, forthcoming, 2007.
TeepLeS, r.; GLyer, D. Cost of water delivery systems: specifications and owner-ship effects. Review of Economics and statistics, v. 69, n.3, p. 399-408, 1987. Tupper, Henrique S.; reSenDe, M. efficiency and regulatory issues in the
Bra-zilian water and sewage sector: an empirical study. utilities Policy 12, p.12-40,