ESDD
6, 1261–1275, 2015“Changes” of the thermal
continentality during 1951–2013, Slovak
Republic
J. Vilček et al.
Title Page
Abstract Introduction
Conclusions References
Tables Figures
◭ ◮
◭ ◮
Back Close
Full Screen / Esc
Printer-friendly Version
Interactive Discussion
Discussion
P
a
per
|
Discussion
P
a
per
|
Discussion
P
a
per
|
Discussion
P
a
per
|
Earth Syst. Dynam. Discuss., 6, 1261–1275, 2015 www.earth-syst-dynam-discuss.net/6/1261/2015/ doi:10.5194/esdd-6-1261-2015
© Author(s) 2015. CC Attribution 3.0 License.
This discussion paper is/has been under review for the journal Earth System Dynamics (ESD). Please refer to the corresponding final paper in ESD if available.
“Changes” of the thermal continentality in
Central Europe between the years 1951
and 2013: case study – Slovak Republic
J. Vilček1, J.Škvarenina2, J. Vido2, R. Kandrík2, J.Škvareninová3, and
P. Nalevanková2
1
Department of Geography and Applied Geoinformatics, University of Presov, 17. novembra 15, 080 01, Presov, Slovak Republic
2
Department of Natural Environment, Faculty of Forestry, Technical University in Zvolen, T.G. Masaryka 24, 960 53 Zvolen, Slovak Republic
3
Department of Applied Ecology, Faculty of Ecology and Environmental Sciences, Technical University in Zvolen, T.G. Masaryka 24, 960 53 Zvolen, Slovak Republic
Received: 2 April 2015 – Accepted: 7 July 2015 – Published: 3 August 2015
Correspondence to: J. Vido ([email protected])
ESDD
6, 1261–1275, 2015“Changes” of the thermal
continentality during 1951–2013, Slovak
Republic
J. Vilček et al.
Title Page
Abstract Introduction
Conclusions References
Tables Figures
◭ ◮
◭ ◮
Back Close
Full Screen / Esc
Printer-friendly Version
Interactive Discussion
Discussion
P
a
per
|
Discussion
P
a
per
|
Discussion
P
a
per
|
Discussion
P
a
per
Abstract
The influence of continents and oceans plays conceptually the key role in the climate conditions of Europeans regions. Continentality is also an important phytogeographic factor of vegetation distribution in Slovakia. This study analysed continentality development at six meteorological stations in Slovakia during the periods 1951–
5
2013, or 1961–2013. Rising trend of the maximal and minimal temperature has been observed at all meteorological stations (lowland as well as mountainous stations) in this periods. However the results showed non-significant increase of continentality index during the monitored period of 63 (53) years. Based on the results of CCM 2000 climate model we cannot expect significant changes of continentality by the end of
10
the 21st century, but the climate change will be significantly manifested by the increase of maximum and minimum air temperatures.
1 Introduction
Continentality of climate belongs to basic climatic characteristics of an area. It specifies the influence of the continent on climate formation. The opposite of continentality is
15
called oceanity (maritimity), which is a set of climatic features influenced by ocean. According to the meteorological dictionary (Bednář et al., 1993), the most distinctive feature of continentality is large amplitude of air temperatures, which is the main characteristic of thermic continentality (Hirschi et al., 2007). On the base of other climatic elements we distinguish ombric and baric continentality.
20
From the point of bioclimatology, geography and ecology, continentality is an important characteristic of environmental parameters. For example, it assists us in understanding complex relationships between the plant distribution and geographic position. With the help of continentality or oceanity indices, phytogeography explains the changes in vegetation conditions from oceans to the interior of continents, gradual
25
ESDD
6, 1261–1275, 2015“Changes” of the thermal
continentality during 1951–2013, Slovak
Republic
J. Vilček et al.
Title Page
Abstract Introduction
Conclusions References
Tables Figures
◭ ◮
◭ ◮
Back Close
Full Screen / Esc
Printer-friendly Version
Interactive Discussion
Discussion
P
a
per
|
Discussion
P
a
per
|
Discussion
P
a
per
|
Discussion
P
a
per
|
of vegetation (species spreading in the Boreal, or Atlantic period) Ellenberg (1988). Klötzli (1976), Shidei (1974) and Plesník (2004) present that in comparison with ocean, land is characterised by basic humidity conditions and temperature differences caused by the distance from ocean (normal continentality), as well as by the elevation and the robustness of a mountain range (alpine continentality). Ocean air masses
5
change from the edge to the interior of mountains. This increases continentality and its impact on vegetation to such an extent that horizontal zones are formed within mountain ranges, which is called as intra-mountain zonality (Zhao et al., 2014). Forest altitudinal distribution is significantly higher on continental mountains in compare to oceanic peaks. For example the timberlines of isolated peaks at oceanic island are
10
lower than on continental mountains at the same latitude (Leuschner, 1996). The Alps are a typical example (Ellenberg, 1988). From the edge of the mountains the vertical structures change from mesophilous atlantic plant communities up to extremely continental communities. Due to the alpine continentality, in the Alps we can see the ecological phenomena in a range of several tens of kilometres comparable to several
15
thousand kilometres from the Atlantic coast up to the interior of Siberia. The impact of alpine continentality and subsequently also the intra-mountain zonality can also be observed in the Tatras of the Western Carpathians (Plesník, 2004). This phenomenon is more thoroughly described in forestry and plant community literature, e.g.: Fleischer (1994), Pagan (1992).
20
In the conditions of Czecho-Slovakia, continentality or oceanity was examined by several authors. Hrudička (1933) dealt with thermic and ombric continentality. Kveták (1974) elaborated continentality of Slovakia in a complex way using several indices. Brázdil et al. (2009) dealt with thermic continentality linked with atmospheric circulation patterns in the Czech Republic. Melo (2002) in Hurbanov addressed continentality in
25
ESDD
6, 1261–1275, 2015“Changes” of the thermal
continentality during 1951–2013, Slovak
Republic
J. Vilček et al.
Title Page
Abstract Introduction
Conclusions References
Tables Figures
◭ ◮
◭ ◮
Back Close
Full Screen / Esc
Printer-friendly Version
Interactive Discussion
Discussion
P
a
per
|
Discussion
P
a
per
|
Discussion
P
a
per
|
Discussion
P
a
per
presented paper is to examine to development of continentality on stations situated at different elevations during the years 1951 (1961)–2013. The partial goal was to evaluate (un)suitability of continentality as an indicator of the ongoing climate change.
2 Materials and methods
The work is based on the data from the Slovak Hydrometeorological Institute
5
(SHMI). Table 1 presents the stations included in the analysis and their geographic characteristics. From the point of terrain we can divide the stations into three groups as follows:
– Lowlands (Michalovce, Hurbanovo).
– Valleys (Rožňava, Sliač).
10
– Highlands (Oravská Lesná, Skalnaté Pleso).
Continentality was calculated as a simple index of continentality (Ic) following the original definition of Supan applied by Rivas-Martinez et al. (2011):
Ic=(Tmax−Tmin) (1)
where Ic is the continentality index, Tmax is the mean temperature (◦C) of the warmest
15
month, and Tmin is the mean temperature (◦C) of the coldest month.
In the Czech and Slovak meteorological literature, continentality index is described as annual amplitude of temperature, or as an annual range of monthly mean air temperatures in ◦C, (difference between the maximum and minimum monthly mean
air temperatures). Continentality index was also calculated for the future climate
20
ESDD
6, 1261–1275, 2015“Changes” of the thermal
continentality during 1951–2013, Slovak
Republic
J. Vilček et al.
Title Page
Abstract Introduction
Conclusions References
Tables Figures
◭ ◮
◭ ◮
Back Close
Full Screen / Esc
Printer-friendly Version
Interactive Discussion
Discussion
P
a
per
|
Discussion
P
a
per
|
Discussion
P
a
per
|
Discussion
P
a
per
|
3 Results and discussion
Since our goal was to evaluate the continentality over the whole varied terrain of Slovakia, we selected six meteorological stations from the network of SHMI. The elevations of stations vary from 112 to 1778 m a.s.l. Table 1 gives detailed information about temperature conditions of the examined stations. As we see, Hurbanovo situated
5
in Podunajská nížina (lowland) is the warmest station, while Skalnaté Pleso in the Tatras, the highest mountains of Slovakia, is the coldest station. The amplitude of air temperature is the most important characteristic of thermic continentality calculated as the difference between the monthly mean temperatures of the warmest and the coldest months in the particular year. Mean amplitudes were evaluated for the period
10
from 1951 to 2013, or 1961 to 2013, depending on the length of observations at a particular station (Table 1). The highest amplitude of air temperature was found for Michalovce (24.2◦C), which is the lowland station situated in the Eastern Slovakia.
The difference between the temperature amplitudes in Podunajská nížina (lowland) and V´ychodoslovenská nížina (lowland) is 1◦C. An interesting finding was that the
15
amplitude of air temperature of the stations situated in valleys was also high: Rožňava (23.7◦C) and Sliač(23.6◦C). This is probably the result of their inversion positions with
relatively low air temperatures in winter half-years, and high summer air temperatures. Skalnaté Pleso situated in the mountains has the lowest amplitude (18.0◦C). From the
statistical point of view, the amplitude is a rather conservative parameter. The value of
20
its standard deviation is almost equal for all stations (2.2–2.6). We can state that our results confirmed the opinion of Gorczynsk´y ex Kveták (1983), etc., that continentality decreases with increasing elevation, and that from the point of thermic continentality the area of Slovakia still belongs to 3rd maritime transition zone (Ic=10.1–25.0◦C)
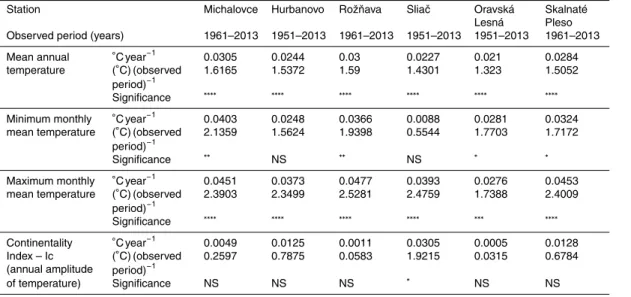
Table 2 evaluates the developmental trend of temperature characteristics (mean,
25
ESDD
6, 1261–1275, 2015“Changes” of the thermal
continentality during 1951–2013, Slovak
Republic
J. Vilček et al.
Title Page
Abstract Introduction
Conclusions References
Tables Figures
◭ ◮
◭ ◮
Back Close
Full Screen / Esc
Printer-friendly Version
Interactive Discussion
Discussion
P
a
per
|
Discussion
P
a
per
|
Discussion
P
a
per
|
Discussion
P
a
per
(115 m a.s.l.) and the highland station of Skalnaté Pleso (1778 m a.s.l.). Other stations are characterised in Table 2. All analysed characteristics of air temperature and thermic continentality have an increasing trend. Table 2 presents the results of the Student’s
t test of significance concerning the correlation coefficients of the mean annual temperature, maximum monthly temperature, minimum monthly temperature and
5
continentality index Ic for the period 1951–2013 and the trend of linear regression as well. The highest rate of mean annual temperature increase equal to 0.0305◦C year−1
was observed in Hurbanovo. It means that over the whole period of 63 years, mean annual temperature increased by 1.62◦C. The slowest rate of temperature increase
(0.0305◦C year−1) was found in Oravská Lesná, where the temperature increased by
10
1.32◦C over the last 53 years. The increasing trend of mean annual temperature was
significant for all stations at 99.9 %. Minimum monthly temperature also increased, but the increase was less significant and had higher variability. Maximum monthly temperature significantly increased on all stations, mostly in Rožňava (2.52◦C in
53 years).
15
Although the developmental trend of continentality was also increasing, the increase was slight and non-significant (in the case of Sliačstation it was significant at 90.0 %). The increasing trend fluctuated from 0.0005 to 0.0305◦C year−1.
Table 3 presents the trend of continentality until the year of 2075 according to the scenario of CCCM. It is expected that the continentality of all stations will slightly
20
decrease. The amplitudes will decrease by 0.4◦C by the year 2075. Melo (2002)
presented a similar results. Results of Wypych et al. (2010) dealing with large-scale changes of continenatlity in Central and Eastern Europe (ranging from Cracow – Poland to Lugansk – Ukraine) did not also exhibit a significant change.
Many naturalists ask themselves a question: “why do we not observe an increase of
25
ESDD
6, 1261–1275, 2015“Changes” of the thermal
continentality during 1951–2013, Slovak
Republic
J. Vilček et al.
Title Page
Abstract Introduction
Conclusions References
Tables Figures
◭ ◮
◭ ◮
Back Close
Full Screen / Esc
Printer-friendly Version
Interactive Discussion
Discussion
P
a
per
|
Discussion
P
a
per
|
Discussion
P
a
per
|
Discussion
P
a
per
|
However, it is only slight because minimum temperatures grow more slowly. Another explanation comes from the geographic definition of continentality: “continental climate is a type of climate inside the land of every continental zone affected by land features” (Činčura et al., 1985). According to this definition, the fact that the thermic continentality does not change is logical, because so far the climate change does not change the
5
geographic distance from the ocean. Mindas et al. (1996) and other works presented the ongoing changes in bio-climatological zonation. For example, in the southern lowlands of Slovakia, bio-climatic conditions suitable for a new community of a xeric forest of a warm temperate zone are gradually being formed. Similarly, the bio-climatic conditions of highlands also change. The modelled scenario of CCCM for the year
10
2075 assumes a complete extinction of alpine communities, and their replacement by a sub-alpine very moist forest (Mindas et al., 1996). It follows that the thermic continentality remains more or less constant even under the conditions of changing climate. It is the bio-climatic conditions of the vegetation zone that changes. If in the future we want to include continentality in the studies dealing with climate change or
15
the changes of bio-climatic conditions, continentality needs to be linked to a climatic zone, vegetation zone, etc. For example, the change from a warm temperate moist forest (continentality index Ic=23) to a warm temperate dry forest (Ic=23) following the change of humidity conditions, or the change from a warm temperate moist forest (Ic=23) to a cool temperate moist forest (Ic=23) following the change in temperature
20
according to bio-climatological classification of Holdridge (1947).
4 Conclusions
Continentality as well as oceanity represent an important climate characteristic of a particular area. At the same time, they are also an important factor of natural vegetation distribution, not only in the postglacial period of Holocene. Thus, it is
25
ESDD
6, 1261–1275, 2015“Changes” of the thermal
continentality during 1951–2013, Slovak
Republic
J. Vilček et al.
Title Page
Abstract Introduction
Conclusions References
Tables Figures
◭ ◮
◭ ◮
Back Close
Full Screen / Esc
Printer-friendly Version
Interactive Discussion
Discussion
P
a
per
|
Discussion
P
a
per
|
Discussion
P
a
per
|
Discussion
P
a
per
index of continentality expressed by the amplitude of air temperature defined as the difference between the monthly mean air temperatures of the warmest and the coldest months in the year. We analysed the development of continentality during the years 1951 (1961)–2013 at six meteorological stations. We selected the stations so that they represented lowlands (Michalovce, Hurbanovo), valleys (Rožňava, Sliač) and
5
highlands (Oravská Lesná, Skalnaté Pleso). We found only a slight non-significant increase of continentality. While the temperature of the warmest month increased by 1.74 to 2.52◦C at all stations during 63 (53) years, the temperature of the coldest month
increased by 0.55 to 2.14◦C. The continentality of the year 2075 was calculated using
GCMs model of CCCM 2000 following the work of Lapin et al. (2000). The results of the
10
climatic scenario indicate that by the end of 21st century we cannot expect significant changes in continentality, although the climate change will be closely coupled with the increase of maximum and minimum air temperatures.
Acknowledgements. This work was accomplished as a part of the projects VEGA No.: 1/0008/13, 1/0589/15, 1/0463/14, 2/0101/14 of the Ministry of Education, Science, Research
15
and Sport of the Slovak Republic and the Slovak Academy of Science; and the projects of the Slovak Research and Development Agency No.: 0423-10, 0131-11 and APVV-0303-11.
References
Bednář, J. (Ed.): Meteorological Explanatory and Terminological Dictionary, Academia, Prague,
20
Czech Republic, 1993.
Brázdil, R., Chromá, K., Dobrovoln´y, P., and Tolasz, R.: Climate fluctuations in the Czech Republic during the period 1961–2005, Int. J. Climatol., 29, 223–242, doi:10.1002/joc.1718, 2009.
Činčura, J. (Ed.): Encyclopedia of Earth, Obzor, Bratislava, Slovak Republic, 1983. 25
ESDD
6, 1261–1275, 2015“Changes” of the thermal
continentality during 1951–2013, Slovak
Republic
J. Vilček et al.
Title Page
Abstract Introduction
Conclusions References
Tables Figures
◭ ◮
◭ ◮
Back Close
Full Screen / Esc
Printer-friendly Version
Interactive Discussion
Discussion
P
a
per
|
Discussion
P
a
per
|
Discussion
P
a
per
|
Discussion
P
a
per
|
Fleischer, P.: Forest plant communities, in: Tatra National Park Biosphere Reserve, edited by: Vološčuk, I., Gradus, Martin, Slovak Republic, 149–162, 1994.
Hirschi, J. J. M., Sinha, B., and Josey, S. A.: Global warming and changes of continentality since 1948, Weather, 62, 215–221, doi:10.1002/wea.88, 2007.
Holdridge, L. R.: Determination of world plant formations from simple climatic data, Science,
5
105, 367–368, 1947.
Hrudička, B.: Supplement to the studies of the humid continentality in Europe, Spisy vydavane prirodovedeckou fakultou Masarykovy university, Brno, Czechoslovakia, 1–22, 1933. Klötzli F.: Grenzen von Laubwäldern in Europa, Ber. Deut. Bot. Ges., 89, 371–380, 1976. Kveták, S.: A paper to continentality of climate on the territory of Slovakia, in: Zborník prác
10
SHMÚ, 22, Alfa, Bratislava, Czechoslovakia, 95–218, 1983
Lapin, M., Damborská, I., Faško, P., Gaál, L., and Melo, M.: Some facts on extreme weather events analysis in Slovakia, in: Bioclimatology and Natural Hazards, edited by: Strelcova, K. et al., Springer, Berlin, Germany, 39–53, doi:10.1007/978-1-4020-8876-6_4, 2009.
Leuschner, C.: Timberline and alpine vegetation on the tropical and warm-temperate oceanic
15
islands of the world: elevation, structure and floristics, Vegetation, 123, 193–206, 1996. Melo, M.: Expected change of climate continentality for Hurbanovo in 21st century, in: XIV.
Cesko-slovenska bioklimatologicka konference, edited by: Roznovsky, J. and Litschmann, T., Lednice na Morave, Czech Republic, 02–04 September 2002, 312–323, 2002.
Melo, M., Lapin, M., Kapolkova, H., Pecho, J., and Kruzicova, A.: Climate trends in the
20
Slovak part of the Carpathians, in: The Carpathians: Integrating Nature and Society Towards Sustainability, edited by: Kozak, J. et al., Springer, Berlin, Heidelberg, Germany, 131–150, 2013.
Mindas, J., Lapin, M., and Skvarenina, J.: Climate change and forests in Slovakia, in: National Climate Program of the Slovak Republic, 5, Bratislava, Slovak Republic, 1–96, 1996.
25
Pagan, J.: Forest Dendrology, Technical university in Zvolen, Zvolen, Slovak Republic, 1992. Plesník, P.: General biogeography, Comenius University, Bratislava, Slovak Republic, 2004. Shidei, T.: Forest vegetation zones, in: The Flora and Vegetation of Japan, edited by:
Numata, M., Kodansha, Tokyo, Japan, 87–124, 1974.
Rivas-Martinez, S., Rivas-Saenz, S., and Penas, A.: Worldwide bioclimatic classification
30
system, Global Geobotany, 1, 638 pp., doi:10.5616/gg110001, 2011.
ESDD
6, 1261–1275, 2015“Changes” of the thermal
continentality during 1951–2013, Slovak
Republic
J. Vilček et al.
Title Page
Abstract Introduction
Conclusions References
Tables Figures
◭ ◮
◭ ◮
Back Close
Full Screen / Esc
Printer-friendly Version
Interactive Discussion
Discussion
P
a
per
|
Discussion
P
a
per
|
Discussion
P
a
per
|
Discussion
P
a
per
Overview, edited by: Przybylak, R., Majorowicz, J., Brazdil, R., and Kejan, M., Springer Science+Business Media B.V., Dordrecht, Netherlands, 473–484, 2010.
Zhao, F., Zhang, B., Pang, Y., and Yao, Y.: A study of the contribution of mass elevation effect to the altitudinal distribution of timberline in the Northern Hemisphere, J. Geogr. Sci., 24, 226–236, doi:10.1007/s11442-014-1084-4, 2014.
ESDD
6, 1261–1275, 2015“Changes” of the thermal
continentality during 1951–2013, Slovak
Republic
J. Vilček et al.
Title Page
Abstract Introduction
Conclusions References
Tables Figures
◭ ◮
◭ ◮
Back Close
Full Screen / Esc
Printer-friendly Version
Interactive Discussion
Discussion
P
a
per
|
Discussion
P
a
per
|
Discussion
P
a
per
|
Discussion
P
a
per
|
Table 1.Main characteristic of meteorological stations, theirs temperature variables (monthly mean, minimum, maximum air temperatures) and annual amplitude of temperatures as continentality index (Ic).
Station Michalovce Hurbanovo Rožňava Sliač Oravská Lesná
Skalnaté Pleso Geographic factors
Altitude (m) 112 115 289 313 780 1778
Latitude 48◦45′ 47◦52′ 48◦39′ 48◦39′ 49◦22′ 49◦11′
Longitude 21◦57′ 18◦12′ 20◦32′ 19◦08′ 19◦11′ 20◦14′
Landform Lowland Valley Mountain
Climatic variables
Observed period (years) 1961–2013 1951–2013 1961–2013 1951–2013 1951–2013 1961–2013 Mean annual
temperature (◦C)
Mean
σ
9.4 (0.75)
10.53 (0.8)
8.7 (0.8)
8.2 (0.7)
4.9 (0.7)
2.1 (0.8) Minimum monthly
mean temperature (◦C)
Mean
σ
−3.5 (2.1)
−1.9 (2.2)
−3.9 (1.8)
−4.4 (2.2)
−6.4 (2.4)
−7.2 (2.1)
Maximum monthly mean temperature (◦C)
Mean
σ
20.7 (1.4)
21.3 (1.3)
19.8 (1.4)
19.2 (1.4)
15.2 (1.2)
10.8 (1.3)
Continentality Index Ic – annual amplitude of temperature (◦C)∗
Mean
σ
24.2 (2.5)
23.2 (2.3)
23.7 (2.2)
23.6 (2.4)
21.6 (2.6)
18.0 (2.35)
ESDD
6, 1261–1275, 2015“Changes” of the thermal
continentality during 1951–2013, Slovak
Republic
J. Vilček et al.
Title Page
Abstract Introduction
Conclusions References
Tables Figures
◭ ◮
◭ ◮
Back Close
Full Screen / Esc
Printer-friendly Version
Interactive Discussion
Discussion
P
a
per
|
Discussion
P
a
per
|
Discussion
P
a
per
|
Discussion
P
a
per
Table 2. The linear trend values (◦C year−1; (◦C) (observed period)−1) and their statistical
significance levels of temperatures (monthly mean, minimum, maximum air temperatures and annual amplitude of temperatures as continentality index – Ic) for the 6 meteorological stations in Slovakia.
Station Michalovce Hurbanovo Rožňava Sliač Oravská
Lesná
Skalnaté Pleso Observed period (years) 1961–2013 1951–2013 1961–2013 1951–2013 1951–2013 1961–2013
Mean annual ◦C year−1
0.0305 0.0244 0.03 0.0227 0.021 0.0284
temperature (◦C) (observed
period)−1
1.6165 1.5372 1.59 1.4301 1.323 1.5052
Significance ∗∗∗∗ ∗∗∗∗ ∗∗∗∗ ∗∗∗∗ ∗∗∗∗ ∗∗∗∗
Minimum monthly ◦C year−1
0.0403 0.0248 0.0366 0.0088 0.0281 0.0324
mean temperature (◦C) (observed
period)−1
2.1359 1.5624 1.9398 0.5544 1.7703 1.7172
Significance ∗∗ NS ∗∗ NS ∗ ∗
Maximum monthly ◦
C year−1
0.0451 0.0373 0.0477 0.0393 0.0276 0.0453
mean temperature (◦C) (observed
period)−1
2.3903 2.3499 2.5281 2.4759 1.7388 2.4009
Significance ∗∗∗∗ ∗∗∗∗ ∗∗∗∗ ∗∗∗∗ ∗∗∗ ∗∗∗∗
Continentality ◦C year−1
0.0049 0.0125 0.0011 0.0305 0.0005 0.0128
Index – Ic (annual amplitude
(◦C) (observed
period)−1
0.2597 0.7875 0.0583 1.9215 0.0315 0.6784
of temperature) Significance NS NS NS ∗ NS NS
ESDD
6, 1261–1275, 2015“Changes” of the thermal
continentality during 1951–2013, Slovak
Republic
J. Vilček et al.
Title Page
Abstract Introduction
Conclusions References
Tables Figures
◭ ◮
◭ ◮
Back Close
Full Screen / Esc
Printer-friendly Version
Interactive Discussion
Discussion
P
a
per
|
Discussion
P
a
per
|
Discussion
P
a
per
|
Discussion
P
a
per
|
Table 3.Annual amplitude of temperature as continentality index (Ic) for reference period and for climatic scenario CCCM in 2030 and 2075.
Years/Scenario Hurbanovo Michalovce Rožňava Sliač Oravská Lesná
Skalnaté Pleso
1951–1980 21.6 22.8 22.3 22.1 19.8 15.5
2030∗ 21.4 22.6 22.1 21.9 19.6 15.3
2075∗ 21.2 22.4 21.9 21.7 19.4 15.1
ESDD
6, 1261–1275, 2015“Changes” of the thermal
continentality during 1951–2013, Slovak
Republic
J. Vilček et al.
Title Page Abstract Introduction Conclusions References Tables Figures ◭ ◮ ◭ ◮ Back Close
Full Screen / Esc
Printer-friendly Version Interactive Discussion Discussion P a per | Discussion P a per | Discussion P a per | Discussion P a per
y = 0.0244x - 37.94 R² = 0. 0 0.0 1.0 2.0 3.0 4.0 5.0 6.0 7.0 8.0 9.0 10.0 11.0 12.0 13.0 14.0
1940 1950 1960 1970 1980 1990 2000 2010 2020
M e an an n u al t e m p e ratu re ( ° C) Year a)
y = 0.0373x - 52.657 R² = 0. 5.0 6.0 7.0 8.0 9.0 10.0 11.0 12.0 13.0 14.0 15.0 16.0 17.0 18.0 19.0 20.0 21.0 22.0 23.0 24.0 25.0 26.0
1940 1950 1960 1970 1980 1990 2000 2010 2020
M axi m u m m o n th ly te m p e ratu re ( ° C) Year b)
y = 0.0248x - 51.177 R² = 0.0 -14.0 -13.0 -12.0 -11.0 -10.0 -9.0 -8.0 -7.0 -6.0 -5.0 -4.0 -3.0 -2.0 -1.0 0.0 1.0 2.0 3.0
1940 1950 1960 1970 1980 1990 2000 2010 2020
M in im u m m o n th ly te m p e ratu re ( ° C) Year c)
y = 0.0125x - 1.4809
R² = 0.00
10.0 11.0 12.0 13.0 14.0 15.0 16.0 17.0 18.0 19.0 20.0 21.0 22.0 23.0 24.0 25.0 26.0 27.0 28.0 29.0 30.0 31.0 32.0
1940 1950 1960 1970 1980 1990 2000 2010 2020
A m p li tu d e o f te m p e ratu re ( ° C) Year d)
ESDD
6, 1261–1275, 2015“Changes” of the thermal
continentality during 1951–2013, Slovak
Republic
J. Vilček et al.
Title Page Abstract Introduction Conclusions References Tables Figures ◭ ◮ ◭ ◮ Back Close
Full Screen / Esc
Printer-friendly Version Interactive Discussion Discussion P a per | Discussion P a per | Discussion P a per | Discussion P a per |
y = 0.0244x - 37.94 R² = 0. 0 0.0 1.0 2.0 3.0 4.0 5.0 6.0 7.0 8.0 9.0 10.0 11.0 12.0 13.0 14.0
1940 1950 1960 1970 1980 1990 2000 2010 2020
M e an an n u al t e m p e ratu re ( ° C) Year a)
y = 0.0284x - 54.39 R² = 0.
0.0 1.0 2.0 3.0 4.0 5.0 6.0 7.0 8.0 9.0 10.0 11.0 12.0 13.0 14.0
1950 1960 1970 1980 1990 2000 2010 2020
M e an an n u al t e m p e ratu re ( ° C) Year a)
y = 0.0373x - 52.657 R² = 0. 5.0 6.0 7.0 8.0 9.0 10.0 11.0 12.0 13.0 14.0 15.0 16.0 17.0 18.0 19.0 20.0 21.0 22.0 23.0 24.0 25.0 26.0
1940 1950 1960 1970 1980 1990 2000 2010 2020
M axi m u m m o n th ly te m p e ratu re ( ° C) Year b)
y = 0.0248x - 51.177 R² = 0.0 -14.0 -13.0 -12.0 -11.0 -10.0 -9.0 -8.0 -7.0 -6.0 -5.0 -4.0 -3.0 -2.0 -1.0 0.0 1.0 2.0 3.0
1940 1950 1960 1970 1980 1990 2000 2010 2020
M in im u m m o n th ly te m p e ratu re ( ° C) Year c)
y = 0.0125x - 1.4809 R² = 0.00 10.0 11.0 12.0 13.0 14.0 15.0 16.0 17.0 18.0 19.0 20.0 21.0 22.0 23.0 24.0 25.0 26.0 27.0 28.0 29.0 30.0 31.0 32.0
1940 1950 1960 1970 1980 1990 2000 2010 2020
A m p li tu d e o f te m p e ratu re ( ° C) Year d)
y = 0.0128x - 7.4917
R² = 0.00
10.0 11.0 12.0 13.0 14.0 15.0 16.0 17.0 18.0 19.0 20.0 21.0 22.0 23.0 24.0 25.0 26.0 27.0 28.0 29.0 30.0 31.0 32.0
1950 1960 1970 1980 1990 2000 2010 2020
A m p li tu d e of t em p er atu re ( ° C) Year d)
y = 0.0324x - 71.639 R² = 0.0 -14.0 -13.0 -12.0 -11.0 -10.0 -9.0 -8.0 -7.0 -6.0 -5.0 -4.0 -3.0 -2.0 -1.0 0.0 1.0 2.0 3.0
1950 1960 1970 1980 1990 2000 2010 2020
M in im u m m on th ly te m p er atu re ( ° C) Year c)
y = 0.0453x - 79.131 R² = 0. 5.0 6.0 7.0 8.0 9.0 10.0 11.0 12.0 13.0 14.0 15.0 16.0 17.0 18.0 19.0 20.0 21.0 22.0 23.0 24.0 25.0 26.0
1950 1960 1970 1980 1990 2000 2010 2020
M axi m u m m o n th ly te m p e ratu re ( ° C) Year b)