Thermal Comfort Level Assessment in Urban Area
of Petrolina-PE County, Brazil
Pedro Vieira de Azevedo
1, Péricles Tadeu da Costa Bezerra
2,
Mario de Miranda Vilas Boas Ramos Leitão
3, Carlos Antonio Costa dos Santos
1,4 1Programa de Pós-Graduação em Recursos Naturais, Universidade Federal de Campina
Grande, Campina Grande, PB, Brazil.
2
Ministério do Planejamento, Orçamento e Gestão, Brasília, DF, Brazil.
3
Colegiado Acadêmico de Engenharia Agrícola,
Universidade Federal do Vale do São Francisco, Juazeiro, BA, Brazil.
4
Unidade Acadêmica de Ciências Atmosféricas, Universidade Federal de Campina Grande,
Campina Grande, PB, Brazil.
Received: July 21, 2016 – Accepted: January 4, 2017
Abstract
This study evaluated the thermal conditions of urban areas in Petrolina-PE, from continuous data collected in urban and rural areas for the year of 2012. The results characterized urban heat islands (UHI) with varying intensity in urban areas, especially UHI = 5.3 °C (high intensity) occurred on April 28, 2012. It was evident that the constituent elements of urban areas contribute to the formation and expansion of UHI bringing thermal discomfort for its inhabitants. An adaptation to Thom’s equation for calculating the Thermal Discomfort Index (DIT), was used to obtain the maximum (DITx) and
mini-mum (DITm) thermal discomfort. In the urban area, theDITmindicated thermal comfort in 23.0% of the days and partial
comfort in 77.0% of days surveyed. Already, theDITxcharacterized 71.6% of days with partial comfort and 28.4% of
days with thermal discomfort. In the rural area, TheDITmindicated that 41.5% of days were thermally comfortable and
58.5% of days had partial comfort. However, theDITxpointed 87.7% of the days of this environment with partial thermal
comfort and 12.3% of thermally uncomfortable days. Finally, the results showed that afforestation of urban area consti-tutes to an effective and efficient way to mitigate thermal discomfort.
Keywords:urban and rural areas, air temperature and humidity, heat island.
Avaliação do Nível de Conforto Térmico na Área Urbana
do Município de Petrolina-PE, Brasil
Resumo
Este estudo avaliou as condições térmicas da área urbana de Petrolina-PE, a partir de dados contínuos coletados nas áreas urbana e rural durante um ano de 2012. Os resultados caracterizaram ilhas de calor (IC) com intensidade variada na área urbana, com destaque para IC = 5,3 °C (forte intensidade) em 28/04/2012. Ficou evidenciado que os elementos constitutivos das áreas urbanas contribuem para a formação e expansão de IC que geram desconforto térmico para a população e, a partir de uma adaptação à equação de Thom para cálculo do índice de desconforto térmico (IDT), obteve-se os índices de desconforto máximo (IDTx) e mínimo (IDTm). Na área urbana, oIDTmindicou conforto térmico
em 23,0% dos dias e conforto parcial em 77,0% dos dias pesquisados. Já oIDTx, caracterizou 71,6% dos dias com
conforto parcial e 28,4% dos dias com desconforto térmico. Na área rural, oIDTmindicou que 41,5% dos dias foram
confortáveis termicamente e 58,5% dos dias tiveram conforto parcial. Contudo, oIDTxnesse ambiente apontou 87,7%
dos dias com conforto parcial e 12,3% dos dias termicamente desconfortáveis. Por fim, os resultados obtidos demonstraram que a arborização da área urbana da cidade constitui-se numa forma eficaz e eficiente para mitigar o desconforto térmico.
Palavras-chave:áreas urbana e rural, temperatura e umidade do ar, ilha de calor. DOI: http://dx.doi.org/10.1590/0102-7786324004
Article
1. Introduction
Many cities have been seen as icons of the environ-mental crisis, problems related to urban space are the most diverse and among the possible issues are most prominent climate change. The perception that the city is a modifier of climate and human activities that cause changes in the at-mosphere triggered climate studies that forms in the cities, called urban climate, which constitutes one of the most rel-evant factors for the environmental quality of built environ-ment (Andrade, 2005; Coltriet al., 2007). The weather is the element that interacts with all environmental systems and their study promotes multidisciplinary analyzes with planners: engineers, architects, meteorologists, historians and geographers, among others, in seeking solutions to en-vironmental problems in cities with consequent improve-ment of life of the urban population. The human activities cause changes in the atmosphere triggered climate studies of the cities, called urban climate, which constitutes one of the most relevant factors for the environmental quality of the built environment (Coltriet al., 2007). The cities in-tense urbanization causes interurban climatic conditions that are directly related to the heterogeneity of land use and urban features, generating heat islands and wet and dry is-lands (Sousa Júnior, 2006; Viana and Amorim, 2008; Silva et al., 2009). According to Johansson (2006), in hot and dry climates, a compact urban model is preferable. However, if there is a cold season this urban model must include some wider or open spaces or both streets to provide access to so-lar radiation. In the search for alternatives to offer thermal comfort in environments already built, Alexandria and Jonesb (2008) found that a reduction of temperature, im-proved thermal comfort, and energy savings with the roof-ing and walls with some vegetation. Thus, thermal comfort can be approached based on human and environmental variables (Armelin and Krüger, 2002; Nicol and Hum-phreys, 2002; Barbosaet al., 2003; Corbella and Yannas, 2003; Farm and Labaki, 2003; Kwok and Chun, 2003; Prado and Ferreira, 2005; and Lambertset al., 2011).
In Brazil, the semiarid region is one of the most vul-nerable geographic area to the effects of climate change, characterized by high average annual temperature (27 °C) and subsequent high evaporation rate (2,000 mm/yr). A maximum annual rainfall of 800 mm is unevenly distrib-uted in time and space, causing serious social consequences for its more than twenty million inhabitants. In general, soils are shallow, with occasional rocky outcrops, stony ground, and vegetation type Caatinga covering almost all the environment. The combination of these elements con-tributes to a negative water balance for most of the years, the presence of dry rivers and intermittent episodes of cy-clical droughts.
Due to the proximity of the Brazilian semiarid region with the equator, there is naturally high incidence of solar radiation in the region. Thus, cities have higher tempera-tures than other more south of the country. In this process,
one of the mechanisms of the system-town atmosphere most affected by the land use and cover change is the en-ergy balance, as evidenced by the generation of heat islands (Perezet al., 2001; Azevedo and Price, 2001; Araújo and Sant’Anna Neto, 2002; Kalnay and Lime, 2003; Monteiro and Mendonça, 2003; Silvaet al., 2009). Studies of energy balance in urban areas have shown that, contrary to what occurs in natural areas, the sensible heat fluxes have be-come much higher than the latent heat fluxes, causing an in-crease in the urban temperature as compared to the rural environment (Oke et al., 1992). On the other hand, the progress of some Brazilian semiarid cities helps explaining changes in their urban structures, especially regarding the lining of their public roads. So that, the central areas of cit-ies experience a rise in temperature, a phenomenon known as urban heat island (UHI), a thermal anomaly which oc-curs when the air becomes warmer than the air in the sur-rounding areas (Oke, 1991; Alucci and Monteiro, 2005). The paving of the streets and concentration of concrete structures mainly cause such occurrences because the as-phalt has great ability to store heat buildings and alter the arrangement of the winds.
The temperature difference between the city and its surroundings causes environmental differences between urban (higher temperatures) and rural (lower temperatures) areas. These differences form updrafts over the warmer parts of the city, which move the urban periphery to the most heated areas, conducting air pollutants generated in the periphery to the urban center. These pollutants will join those already on the urban center, intensifying the problem of environmental degradation in cities. That is, the already adverse natural conditions of the semiarid region are en-hanced by the building blocks of urban structures that con-tribute more markedly to worsen the quality of life in urban centers with increased thermal discomfort to the population (Bezerra, 2009).
Unsuitable weather conditions in urban environments means loss of life quality for some and increase of electric-ity for thermal conditioning of built environments for oth-ers. As a result, there is an increase in demand for electric-ity, due to the need for expansion of power generation matrix: hydroelectric, thermoelectric and nuclear power plants, among other ways of producing energy, all with great impact on the environment (Lamberts and Xavier, 2002).
physical space of cities, with the hypothesis that climate in-fluences the environment and vice versa. Given the above, this study aimed to evaluate the occurrence of heat islands and the level of thermal discomfort in the urban area of the municipality of Petrolina-PE.
2. Material and Methods
2.1. Study area
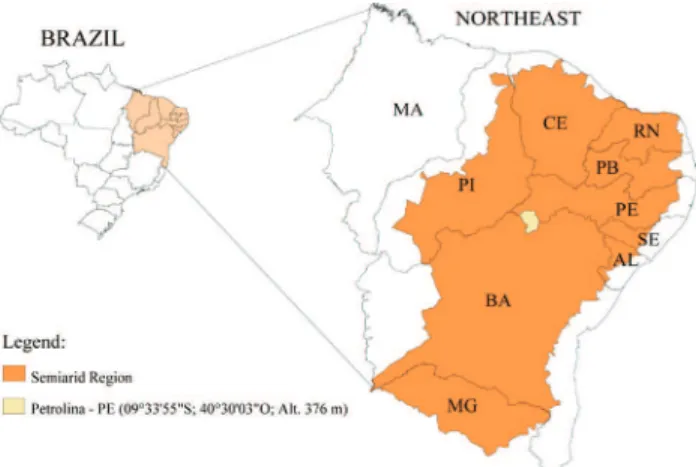
The experiment was conducted in urban and rural ar-eas of the municipality of Petrolina-PE (Area: 4,756.8 km2 and Population: 294.081 inhabitants), inserted in the Bra-zilian semiarid region (Fig. 1). This municipality has the following climate characteristics: very dry and semiarid climate with rainy season from November to April and av-erage annual rainfall of 431.8 mm.
2.2. Instrumentation
The data of temperature and relative humidity, wind speed and direction in urban and rural areas of the munici-pality of Petrolina-PE were collected from January 1stto December 31, 2012. The urban area data were obtained from the meteorological station of National Institute of Me-teorology (INMET), located in the neighborhood Gercino Rabbit, while data from the rural area were obtained from the Meteorological Station of the Federal University of the San Francisco River Valley (UNIVASF), located at Road BR 407, km 12 - Nilo Coelho Irrigation Project - C1. The urban area data were compared to those from rural areas, with the following analysis tools: (i) urbanization in rela-tion to morphology/urban funcrela-tion; (ii) rural ecology char-acteristics considering the topography and most influential factor in the spatial behavior of the temperature; and (iii) the meteorological system (regional climate).
The comparative analysis of the data revealed, in ad-dition to observation of the occurrence of UHI, the classifi-cation of its intensity, in accordance with the established by Gomezet al.(2001), stated in Table 1.
Thermal comfort was evaluated by adapting the cal-culation of the thermal discomfort index of Thom (DIT), as follows (Alucci and Monteiro, 2005):
DIT= -T ( .055 00055- . RH T)( -14 5. ) (1) whereTis the air temperature (°C) andRHthe air relative humidity (%).
The studied areas showed an inverse relationship be-tween air temperature and relative humidity, that is, the maximum air temperature occurs at times very close to the minimum relative humidity. Similarly, the minimum air temperature occurs at times close to those of maximum rel-ative humidity. Thus, it was possible to split the calculation ofDITinto two components:
DITx =Tx-( .055 00055- . RHm)(Tx-14 5. ) (2)
DITm =Tm -( .055 00055- . RHx)(Tm-14 5. ) (3) where DITx is the maximum rate of thermal discomfort
(°C),DITmthe minimum ratio of thermal discomfort (°C),
Txthe maximum air temperature (°C),Tmthe minimum air
temperature (°C),RHxthe maximum relative humidity (%),
RHmthe minimum relative humidity (%).
The information in Table 2 were used to classify the level of thermal discomfort (Silvaet al., 2009):
To enable an effective comparison of the data re-corded, the field experiments (clock hour) times were con-verted to true solar time, considering the corrections of time equation (te) and the differences of longitude (l):
ta =tc+Dl+te (4)
wheretais the apparent time (true solar time);tcthe civil
time (clock time);Dlthe correction due to different longi-tudes:
Dl=4(ls -ll) (5)
Figure 1- Map of the semiarid region of northeastern Brazil, particularly
the municipality of Petrolina-PE.
Table 1- Intensity of heat island due to changes in air temperature.
Temperature rangeDT(°C) Heat island intensity
0£ DT£2 Weak
2£ DT£4 Moderate
4£ DT£6 Strong
DT> 6 Very strong
Table 2- Classes of thermal discomfort depending on the Thom thermal
discomfort index (DIT).
Level DITrange (°C) Class of thermal discomfort
1 DIT£14.9 Uncomfortable
2 15.0£DIT£19.9 Comfortable
3 20.0£DIT£26.4 Partial comfort
Et = ´ + ´
- ´ - ´
-
-7 5 10 187 10 3 21 10 146 1
5 3
3
, , cos( )
, ( ) ,
G
G
sen 0 2
0 04 10 2
2
2
-- ´
cos( )
, ( )
G
G
sen
(6)
wherelsis the longitude of the standard meridian;llthe lo-cal longitude; and
G =æ è
ç ö
ø
÷ - =
360
365 (d 1),d Julian day (7)
3. Results and Discussion
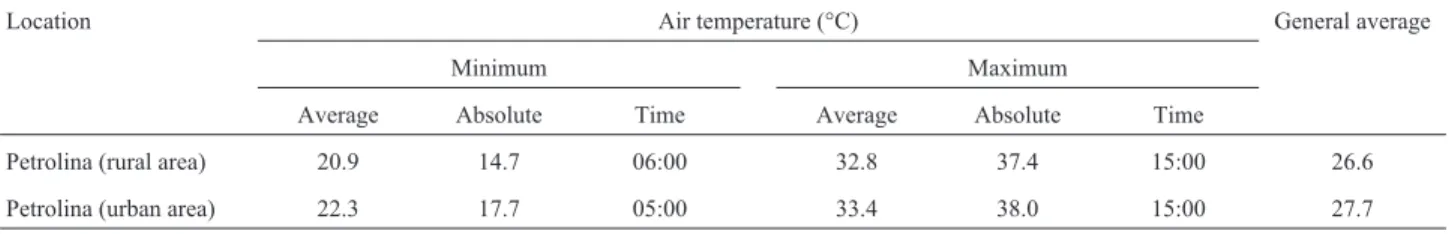
On average, the urban environment of Petrolina-PE presented in the year of 2012, a maximum air temperature (0.6 °C), minimum (1.4 °C) and mean annual temperature (1.1 °C) higher than the corresponding values of the rural area (Table 3). According to data in Table 4, it appears that during the year 2012, on average, the maximum relative hu-midity of air was higher (76.7%), while the minimum was lower (27.8%) in rural area of Petrolina. One fact that stands out in the climate and impressive aspect of the popu-lation was the extremely low rate of relative humidity re-corded at September 13, 2012 (11.8%) in rural areas and 12% in urban areas. In 2012, the wind speed showed a daily average of 3.7 m.s-1 in the urban area of Petrolina, with
gusts of up to 16.6 m.s-1 while in the rural area it was
3.9 m.s-1, with gusts of up to 19.7 m.s-1(Table 5). It was also
observed that, on average, the maximum wind speed was higher in rural area (14.1 m.s-1).
Spatial attention should be given to extreme values (Tables 3, 4 and 5) since the annual weighted averages rep-resent a large group of data and generally do not show sig-nificant differences. For better evaluating the behavior of climate variables it is presented in sequence, illustrative graphs of rainfall, temperature and relative humidity
(mini-mum, average and maximum) observed in urban and rural areas of Petrolina-PE.
Figure 2 shows the behavior of rainfall in Petro-lina-PE, especially the irregularity and poor rainfall distri-bution in 2012, with the accumulated rainfall in the rural area (182 mm) greater to that of the urban area (135.2 mm). It was also noted that 2012 was an extremely dry year and
Figure 2- Rainfall in rural and urban areas in the period from January 1st
to December 31, 2012 in Petrolina-PE.
Table 3- Air temperature: minimum and maximum (average and absolute values with time of occurrence) and overall average in the period from January
1stto December 31, 2012 in Petrolina-PE.
Location Air temperature (°C) General average
Minimum Maximum
Average Absolute Time Average Absolute Time
Petrolina (rural area) 20.9 14.7 06:00 32.8 37.4 15:00 26.6
Petrolina (urban area) 22.3 17.7 05:00 33.4 38.0 15:00 27.7
Table 4- Relative air humidity: minimum and maximum (average and absolute values with time of occurrence) and overall average in the period from
January 1 to December 31, 2012 in Petrolina-PE.
Location Relative air humidity (%) General average
Minimum Maximum
Average Absolute Time Average Average Time
Petrolina (rural area) 27.8 11.8 14:00 76.7 94.0 05:00 51.0
Petrolina (urban area) 28.1 12.0 13:00 71.3 90.0 06:00 48.3
Table 5- Wind speed: maximum (average and absolute values with the
occurrence of hours) and overall average in the period from January 1stto
December 31, 2012 in Petrolina-PE.
Location Wind speed (m.s-1) General
average Maximum
Average Absolute Time
Petrolina (rural area) 14.1 19.7 20:00 3.9
virtually rains occurred between March and October, what contributed to increase the thermal discomfort, as will be shown later.
To demonstrate the higher temperatures in the urban environment and show the presence of heat island in rela-tion to its surrounding region, the air temperature differ-ences between the two environments studied are presented in Fig. 3, characterizing the occurrence and intensity of ur-ban heat islands (UHI). Figure 3 indicates the occurrence of UHI nearly every day of the year. The intensity observed generally ranged from low to moderate. However, on 28 April, was recorded 5.3 °C difference in air temperature be-tween urban and rural areas, featuring occurrence of inten-sive heat island. Heat island was also characterized in the urban environment in almost every day of the year, al-though usually with low intensity. However, it highlights that on 29/04 was recorded a difference of 2.6 °C, charac-terizing a moderate UHI. Also, it is observed the occur-rence of heat islands in the urban environment in nearly every day of the year, with a generally weak intensity. It is noteworthy a heating of both the urban and rural areas, a fact that contributes to the reduction of the difference be-tween these two environments. On February 19, 2012 was recorded a difference of 2.3 °C between the highest maxi-mum temperature in the two environments studied, charac-terizing island of moderate heat. Gartland (2010) explains that the effect of heat island is more intense on calm and clear days and weaker on cloudy and windy days, since more solar energy is captured on clear days, and milder winds remove the heat in a slower manner, making the heat island becomes more intense. Therefore, it can be con-cluded that, in any analysis perspective, there is the forma-tion of heat islands in the urban area of Petrolina-PE. Also,
it can be said that the minimum relative humidity was very close both in rural as in urban areas. However, in relation to the behavior of the average and maximum air relative hu-midity, it is observed that the urban environment had, in general, the worst conditions. This fact has the further prob-lem that occurs in the urban area where there is the highest concentration of people and activities in everyday society. In summary, it can be said that the minimum air rela-tive humidity was very close both in rural as in urban areas (Fig. 4). However, in relation to the behavior of the average and maximum air relative humidity, it is observed that the city environment was presented, in general, less humid. These findings are relevant from a social point of view be-cause the city constitute an area of concentration and move-ment of most people throughout the year who rely on services as varied as possible, such as trade, health and bank, for example.
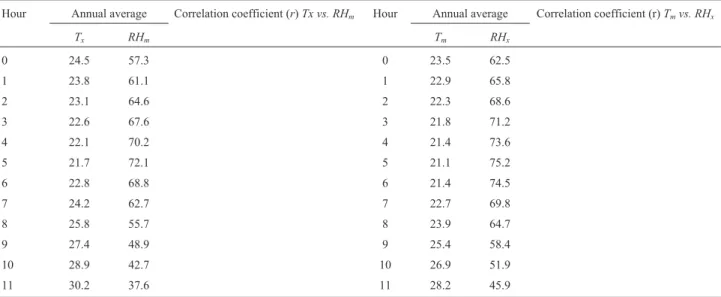
If the physical point of view admits the occurrence of such a situation, from a statistical point of view the correla-tion between the variables studied is presented in Tables 6 and 7. These tables list the annual hourly averages of ex-tremes air temperature and humidity, in urban and rural en-vironments, as well as its value of the correlation coeffi-cient between them. There has been a strong inverse correlation between maximum temperature and minimum humidity (r= -0.95), and between minimum temperature and maximum relative humidity (r= -0.98). This statistical correlation associated with physical reality as possible be-tween such occurrences justify the adaptation of the calcu-lation of thermal discomfort by Thom equation proposed by this work. As observed in the urban area of Petrolina-PE, the data from rural areas indicate also a strong inverse cor-relation between minimum temperature and maximum
hu-Figure 3- Occurrence and daily intensity of heat islands in Petrolina-PE in the period from January 1stto December 31, 2012 for minimum, average and
Table 6- Average annual hourly values and correlation coefficient between maximum temperature (Tx) and minimum relative humidity (RHm), as well as
between the minimum temperature (Tm) and maximum relative humidity (RHx) in the urban area in the period from January 1stto December 31, 2012 in
Petrolina-PE.
Hour Annual average Correlation coeficient (r)Tx vs. RHm Hour Annual average Correlation coefficient (r)Tmvs. RHx
Tx RHm Tm RHx
0 28.3 36.4 0 22.3 79.1
1 27.4 40.5 1 21.9 79.0
2 26.7 44.4 2 21.5 80.3
3 25.7 48.0 3 21.2 80.3
4 25.1 52.3 4 20.9 81.3
5 24.8 55.3 5 20.7 82.1
6 25.3 56.5 6 20.7 82.0
7 27.1 52.8 7 21.4 79.4
8 29.2 43.4 8 22.2 76.8
9 30.8 37.3 9 23.1 73.7
10 31.9 32.5 10 24.4 68.7
11 33.3 28.0 11 25.7 62.9
12 34.4 24.1 12 26.5 59.0
13 35.3 21.4 -0.95 13 27.3 55.8 -0.98
14 35.9 20.2 14 27.7 54.4
15 36.0 19.4 15 27.8 54.1
16 35.8 19.4 16 27.0 58.4
17 35.0 20.8 17 26.2 61.8
18 33.7 22.7 18 25.0 69.5
19 32.6 24.2 19 24.5 73.7
20 31.8 26.7 20 24.1 74.8
21 30.9 28.1 21 23.6 74.7
22 30.1 29.9 22 22.9 76.5
23 29.2 32.8 23 22.5 78.5
24 28.3 36.4 24 22.3 79.1
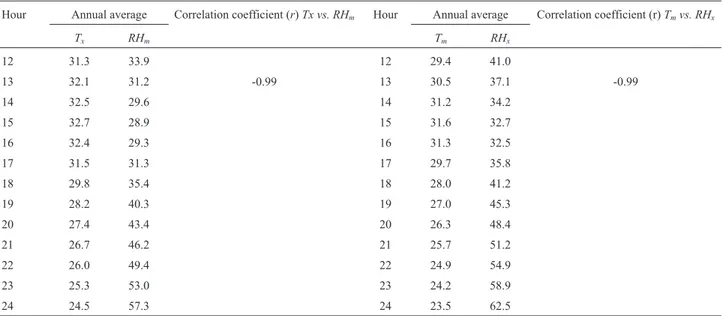
Table 7- Annual hourly average and coefficient of correlation between maximum temperature and minimum air relative humidity, as well as between the
minimum temperature and maximum air relative humidity in rural area of Petrolina-PE during the period from January 1stto December 31, 2012.
Hour Annual average Correlation coefficient (r)Tx vs. RHm Hour Annual average Correlation coefficient (r)Tmvs. RHx
Tx RHm Tm RHx
0 24.5 57.3 0 23.5 62.5
1 23.8 61.1 1 22.9 65.8
2 23.1 64.6 2 22.3 68.6
3 22.6 67.6 3 21.8 71.2
4 22.1 70.2 4 21.4 73.6
5 21.7 72.1 5 21.1 75.2
6 22.8 68.8 6 21.4 74.5
7 24.2 62.7 7 22.7 69.8
8 25.8 55.7 8 23.9 64.7
9 27.4 48.9 9 25.4 58.4
10 28.9 42.7 10 26.9 51.9
midity (r= -0.99), as well as between maximum tempera-ture and minimum relative humidity (r= -0.99) (Table 7).
Once proven the physical and statistically correlation between temperature and relative humidity, the thermal discomfort index was calculated based on the maximum temperature and minimum relative humidity and based on minimum temperature and maximum relative humidity. For the urban area, a partial thermal comfort in the period between the end of April and beginning of October was ob-tained (Fig. 5). However, in the periods January to March
and November to December, the situation was character-ized as thermal discomfort. It was also observed that the vast majority of days studied showed partial comfort condi-tion. That is, even considering the thermal discomfort index based on the minimum values of air temperature, thermal comfort period is limited from late June to early October. Therefore, based on the results obtained forDITm,
represen-tative of the situation early in the morning, yet 23.0% of the days were comfortable, 77.0% of days had partial comfort and no day showed thermal discomfort. In contrast, during Hour Annual average Correlation coefficient (r)Tx vs. RHm Hour Annual average Correlation coefficient (r)Tmvs. RHx
Tx RHm Tm RHx
12 31.3 33.9 12 29.4 41.0
13 32.1 31.2 -0.99 13 30.5 37.1 -0.99
14 32.5 29.6 14 31.2 34.2
15 32.7 28.9 15 31.6 32.7
16 32.4 29.3 16 31.3 32.5
17 31.5 31.3 17 29.7 35.8
18 29.8 35.4 18 28.0 41.2
19 28.2 40.3 19 27.0 45.3
20 27.4 43.4 20 26.3 48.4
21 26.7 46.2 21 25.7 51.2
22 26.0 49.4 22 24.9 54.9
23 25.3 53.0 23 24.2 58.9
24 24.5 57.3 24 23.5 62.5
Table 7- (cont.)
Figure 4- Air relative humidity in rural and urban areas of Petrolina-PE in the period from January 1stto December 31, 2012 for: (A) minimum; (B)
the morning hours, represented by 71.6% of days surveyed had partial comfort and 28.4% of the days were thermally uncomfortable.
Looking at Fig. 6, we see that theDITxin the rural
area showed partial thermal comfort in most days from Jan-uary to October. However, from mid-October until Decem-ber the situation was thermal discomfort. Also, the annual march of theDITmhad partial comfort on most days
stud-ied. That is, even considering the thermal discomfort index based on the minimum values of air temperature, thermal comfort period is limited from June to mid-October.
Therefore, the results obtained for the thermal dis-confort indexDITmindicated that the morning shift 41.5%
of the days were comfortable, while 58.5% of the days were partial comfort. However, in the afternoon, represented by DITx 87.7% of days surveyed had partial comfort and
12.3% of the days were thermally uncomfortable situations and were not recorded.
Therefore, the comparison between urban environ-ments and their rural surrounding region, shows that the ur-ban area of the city of Petrolina presents changes in their climatic variables (temperature, relative humidity and wind
Figure 5- Maximum (DITx) and minimum (DITm) thermal discomfort index in the urban area of Petrolina-PE during the period from January 1stto
De-cember 31, 2012.
speed), especially during the evening period, impacting di-rectly in the thermal generating discomfort for the popula-tion.
4. Conclusions
The evaluation of the thermal conditions of Petrolina municipality during the period from January 1stto Decem-ber 31, 2012, using data from automatic weather stations installed in urban and rural areas, allowed to make the fol-lowing conclusions:
1) Heat islands with varying intensity are character-ized in the urban area of the municipality;
2) The naturally adverse weather conditions in the Semiarid region, potentiated by constructive elements of urban space, contribute to the expansion of heat islands and thermal discomfort of their people;
3) Applying the adaptation of Thom equation for ob-taining the thermal discomfort index to Petrolina-PE, it was observed that the urban area records thermal comfort al-ways lower than that observed in the rural area;
4) Therefore, it can be said that the climate of the Petrolina municipality is influenced by the design charac-teristics of urban areas. This association contributes to the formation of heat islands and thermal discomfort, afforesta-tion is an effective mechanism to mitigate the adverse ef-fects of this condition and improve the quality of life of the population.
Acknowledgments
The authors are grateful to the CNPq for funding the Research Project nº 446172/2015-4, the Research Produc-tivity Grant for the fourth author, as well as the CAPES for funding the Research Project nº 88887.091737/2014-01.
References
ALEXANDRIA, E.; JONESB, P. Temperature decreases in an ur-ban canyon due to green walls and green roofs in diverse cli-mates.Building and Environment, v. 43, p. 480-493, 2008.
AMORIM, M.C.C.T. Ilhas de calor em Birigui/SP.Revista
Bra-sileira de Climatologia, v. 1, p. 121-130, 2005.
AMORIM, M.C.C.T.; DUBREUIL, V.; QUENOL, H.;
SANT’ANA NETO, J.L.Características das ilhas de
ca-lor em cidades de porte médio: exemplos de Presidente Prudente (Brasil) e Rennes (França). Confins [Online], 7/2009, posto online em 31 outubro 2009. URL: http://confins.revues.org.
ANDRADE, H.O. Clima urbano - natureza, escalas de análise e aplicabilidade. Revista Portuguesa de Geografia, v. 80, p. 66-91, 2005.
ARAÚJO, R.R.; SANTANNA NETO, J.L.O processo de
urba-nização na produção do clima urbano de São Luiz-MA.
In: SANTANNA NETO, J.L. O clima das cidades bra-sileiras. João Lima Santanna Neto (org). - Presidente Pru-dente: [s/n], 2002.
AZEVEDO, T.R.; TARIFA, J.R.O ritmo semanal das
ativi-dades humanas e o clima a região metropolitana de São
Paulo. Laboratório de Climatologia e Biogeografia. Departamento de Geografia, Faculdade de Filosofia, Letras e Ciências Humanas, Universidade de São Paulo, Série TA -Texto 008, 2001.
BEZERRA, P.T.C.A Influência da urbanização no clima das
cidades de Petrolina/PE e Juazeiro/BA. Dissertação de Mestrado em Recursos Naturais da Universidade Federal de Campina Grande - PB. Fevereiro, 2009.
COLTRI, P.P.; VELASCO, G.D.N.; POLIZEL, J.L.; DEME-TRIO, V.A.; FERREIRA, N.J.Ilhas de calor da estação de inverno da área urbana do município de Piracicaba/SP.
XIII Simpósio de Sensoriamento Remoto, Florianó-polis/SC... Anais. INPE, p. 5151-5157. Abril, 2007. GOMÉZ, F.; TAMARIT, N.; JABALOYES, J. Green zones,
bioclimatics studies and human comfort in the future
devel-opment of urban planning. Landscape and Urban
Plan-ning, v. 55, p. 151-161, 2001.
GRIMMOND, S. Urbanization and global environmental change:
local effects of urban warming.The Royal Geographical
Society, v.173, p. 83-88, 2007.
IBGE - Instituto Brasileiro de Geografia e Estatística. Censo demográfico do Brasil.Rio de Janeiro, 2010.
KALNAY, E.; CAI, M. Impact of urbanization and land-use change on climate.Nature, v.432, p.528-531, 2003.
LAMBERTS, R.; XAVIER, A.A.P.Conforto térmico e stress
térmico.Universidade Federal de Santa Catarina. Centro tecnológico. Departamento de Engenharia Civil. Florianó-polis, 2002.
LAMBERTS, R.; XAVIER, A.A.P; GOULART, S.; VECCHI, R. de. Conforto e stress térmico. Universidade Federal de Santa Catarina. Centro tecnológico. Departamento de Enge-nharia Civil. Florianópolis, 2011.
MONTEIRO, C.A.F.; MENDONÇA, F. (Org.).Clima urbano.
São Paulo: Contexto, 2003.
MONTEIRO, C.A.F. Teoria e clima urbano. São Paulo:
IGEOG/USP, 181p. Série Teses e Monografias, 25, 1976.
MONTEIRO, L.M.; ALUCCI, M.P.Índices de conforto térmico
em espaços abertos. Parte 1. VIII Encontro Nacional e VI Encontro Latinoamericano de conforto no ambiente construído.São Paulo. Anais...Maceió, ANTAC, 2005. OKE, T.R. Canyon geometry and the nocturnal urban heat island:
Comparision of scale model and field observations.Journal of Climatology, v. 1, p. 237-254, 1991.
OKE, T.R.; JOHNSON, G.T.; STEYN, D.G.; WATSON, I.D. Simulation of surface urban heat islands under “Ideal” Con-ditions at night Part 2: Diagnosis of causation. Bound-ary-Layer Meteorology, v.56, p.339-358, 1996.
OKE, T.R; ZEUNER, G.; JÁUREGUI, E. The Surface Energy
Balance in Mexico City. Atmospheric Environment,
v. 26B, p. 433-444, 1992.
PEREZ, J.C; SÁNCHEZ, M.A.V.; BARRADAS, V.L.Clima,
urbanización y uso del suelo enciudades tropicales de Mexico. Red Nacional de Investigación Urbana, Puebla, México, Ciudades 51, jun-set. 2001.
SILVA, V.P.R;. AZEVEDO, P.V.; BRITO, R.S.; CAMPOS; J.H.B.C. Evaluating the urban climate of a typically tropical city of northeastern Brazil.Environmental Monitoring of Assessment. v.161, p.45-59, 2010.