of Temporal Lobe Epilepsy Surgery
Rube´n Arman˜anzas1*., Lidia Alonso-Nanclares2,3,4., Jesu´s DeFelipe-Oroquieta5, Asta Kastanauskaite2,3,4, Rafael G. de Sola6, Javier DeFelipe2,3,4, Concha Bielza1, Pedro Larran˜aga1
1Departamento de Inteligencia Artificial, Universidad Polite´cnica de Madrid, Boadilla del Monte, Madrid, Spain,2Laboratorio Cajal de Circuitos Corticales, Universidad Polite´cnica de Madrid, Boadilla del Monte, Madrid, Spain,3Instituto Cajal, Centro Superior de Investigaciones Cientı´ficas, Madrid, Madrid, Spain,4Centro de Investigacio´n Biome´dica en Red sobre Enfermedades Neurodegenerativas, CIberNed, Madrid, Madrid, Spain,5Departamento de Psicologı´a y Eduacio´n, Universidad Camilo Jose´ Cela, Villanueva de la Can˜ada, Madrid, Spain,6Department of Neurosurgery, Hospital Universitario de la Princesa, Madrid, Madrid, Spain
Abstract
Epilepsy surgery is effective in reducing both the number and frequency of seizures, particularly in temporal lobe epilepsy (TLE). Nevertheless, a significant proportion of these patients continue suffering seizures after surgery. Here we used a machine learning approach to predict the outcome of epilepsy surgery based on supervised classification data mining taking into account not only the common clinical variables, but also pathological and neuropsychological evaluations. We have generated models capable of predicting whether a patient with TLE secondary to hippocampal sclerosis will fully recover from epilepsy or not. The machine learning analysis revealed that outcome could be predicted with an estimated accuracy of almost 90% using some clinical and neuropsychological features. Importantly, not all the features were needed to perform the prediction; some of them proved to be irrelevant to the prognosis. Personality style was found to be one of the key features to predict the outcome. Although we examined relatively few cases, findings were verified across all data, showing that the machine learning approach described in the present study may be a powerful method. Since neuropsychological assessment of epileptic patients is a standard protocol in the pre-surgical evaluation, we propose to include these specific psychological tests and machine learning tools to improve the selection of candidates for epilepsy surgery.
Citation:Arman˜anzas R, Alonso-Nanclares L, DeFelipe-Oroquieta J, Kastanauskaite A, de Sola RG, et al. (2013) Machine Learning Approach for the Outcome Prediction of Temporal Lobe Epilepsy Surgery. PLoS ONE 8(4): e62819. doi:10.1371/journal.pone.0062819
Editor:Robert E. Gross, Emory University, Georgia Institute of Technology, United States of America ReceivedOctober 4, 2012;AcceptedMarch 27, 2013;PublishedApril 30, 2013
Copyright:ß2013 Arman˜anzas et al. This is an open-access article distributed under the terms of the Creative Commons Attribution License, which permits unrestricted use, distribution, and reproduction in any medium, provided the original author and source are credited.
Funding:This work was supported by grants from the following entities: Centre for Networked Biomedical Research into Neurodegenerative Diseases (CIBERNED, CB06/05/0066 to JDF), the Spanish Ministry of Economy and Competitiveness (grants SAF2009-09394 to JDF; Juan de la Cierva postdoctoral fellowship to RA; TIN2010-20900-C04-04 and the Cajal Blue Brain Project, Spanish partner of the Blue Brain Project initiative from EPFL, to JDF, PL and CB. The funders had no role in study design, data collection and analysis, decision to publish, or preparation of the manuscript.
Competing Interests:The authors have declared that no competing interests exist. * E-mail: [email protected]
.These authors contributed equally to this work.
Introduction
Epilepsy surgery is effective in reducing both the number and the frequency of seizures, particularly in patients with temporal lobe epilepsy (TLE), a common form of intractable epilepsy [1–3]. Although epilepsy is associated with a variety of pathologies [4–5], hippocampal sclerosis is the most frequent pathological sign encountered in the resected temporal mesial structures of TLE patients [5]. Nevertheless, 30% of these patients continue to suffer seizures after surgery [6–11]. Thus, there is much interest in identifying the underlying causes of these surgical failures.
Several studies have investigated whether the outcome of epilepsy surgery can be predicted using clinical data, imaging techniques (MRI, PET, SPECT), electroencephalography func-tional tests (EEG, video-EEG), neuropsychology tests [11] or combinations of these approaches. Interestingly, TLE patients exhibit a variety of neuropsychological profiles that may change after surgery [12]. Such neuropsychological assessment can potentially identify the epileptogenic hemisphere [13], but this predictive potential has not previously been evaluated in detail in the case of the Rorschach test [14].
Since epilepsy is a highly complex disease that involves multiple factors, the predictive value of single variables has limited accuracy [15]. However, machine learning approaches can generate models that combine specific patient information to predict the outcome of the surgery treatment and, hence, help support clinical decision-making. Therefore, researchers have been trying to develop machine learning approaches as predictive tools for epilepsy. In particular, the application of artificial neuronal networks has been reported to reach a high accuracy (80% to 95%) in predicting the prognosis of epileptic patients [16–17]. Nevertheless, these artificial neuronal networks do not provide direct results on the relevance of individual variables or the inspection of the induced models.
assess-ment of cognitive-perceptive and emotional processes. Supervised classification data mining approaches were then used to generate computational models to predict whether a patient with TLE secondary to hippocampal sclerosis would fully recover following surgical intervention.
Data analysis revealed that the surgical outcome could be predicted with a high degree of accuracy using specific clinical and neuropsychological variables. In addition, certain variables were found to be uninformative in this prediction. One key finding for the outcome prediction was the importance of personality style, a parameter that refers to aspects of an individual’s personality and their emotional functioning. We propose here that clinical evaluations for epilepsy surgery should include, in addition to the classical analyses, these specific psychological tests and the use of machine learning models as standard tools.
Materials and Methods
Patients
Patients were pre-surgically evaluated according to the protocol used at the ‘‘Hospital de la Princesa’’ (Madrid, Spain), as described elsewhere [8]. In all cases, written informed consent was obtained from all participants in accordance with the Helsinki Declaration [18]. The study and all protocols received institutional ethics approval by the ethical committee at the ‘‘Hospital de la Princesa’’.
Human postoperative brain tissue was obtained from 23 patients suffering intractable TLE. The resection of the neocortex and the amygdalo-hippocampal area, tailored according to the electrocorticography findings, was performed as described previ-ously [19]. Immediately after removal, biopsy samples were fixed in cold 4% paraformaldehyde and small blocks (,15610610 mm) were obtained that covered the entire
rostrocaudal extent of the hippocampal formation. These blocks were immersed in a solution of 4% paraformaldehyde in 0.1 M phosphate buffer (pH 7.4) for 24–36 h. at 4uC. Serial coronal vibratome sections (50mm) were then obtained from these blocks.
Histological analysis was performed in all cases (for details, see Text S1).
From the cohort of 260 epileptic patients from this hospital, we selected patients with unilateral TLE and showing well-defined hippocampal sclerosis (n = 39; confirmed by histopathological analysis after surgery). From this subgroup, only subjects fulfilling the following inclusion criteria were included (n = 23): older than 16 years old on the date of surgery; well-defined lateralization by video electroencephalography; unilateral hippocampal sclerosis suggested by MRI; over 2 years of postoperative follow up; and a complete neuropsychological evaluation (that included an assess-ment of cognitive-perceptive and emotional processes).
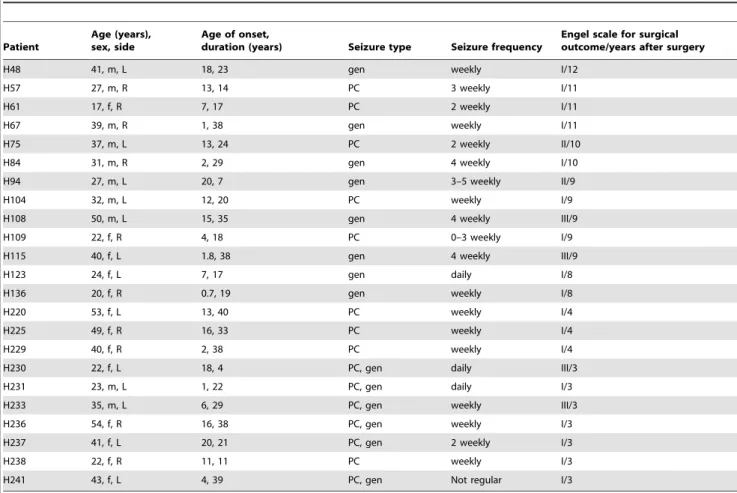
In the present study, the clinical feature ‘‘Side’’ refers to the side associated with seizure onset as determined by video-EEG studies. These patients all suffered from partial complex and secondarily generalized seizures (age range, 17–54 years; average, 34.3 years; age of onset range, 0.7–20 years; average, 9.63 years; duration range, 4–40 years; average, 24.96 years; Table 1).
Neuropsychological Testing
Pre-surgical evaluation of patients was conducted in order to examine the relationship between cognitive impairment and neurological damage. Intelligence was assessed using the Wechsler Adult Intelligence Scale-Third Edition (WAIS-III) [20], which provides a verbal intelligence quotient (VIQ), a performance intelligence quotient (PIQ), and a full scale intelligence quotient (FSIQ). In the present study, intelligence quotients (IQ) were
categorized into seven groups, depending on the values obtained for each index (in parenthesis): Very Low (0–69), Low (70–79), Normal-Low (80–89), Normal (90–109), Normal-High (110–119), High (120–129) and Very High ($130). Patients were classified according to their index values (Table 2).
To examine possible dysfunction in the hippocampus and neocortex, individuals were assessed using the Wechsler Memory Scale (WMS) [21]. Specifically, we performed logical and visual memory measurements for both immediate (immediate logical memory, MlogI; immediate visual memory, MvisI) and delayed recalls (delayed logical memory, MlogII; delayed visual memory, MvisII). In all cases, the patients were classified into five groups (Table 2) based on the WMS index (indicated in parenthesis): Low (50–65), Normal-Low (66–80), Normal (81–115), Normal-High (116–130) and High ($131).
The Rorschach test was used to evaluate the cognitive-perceptive and emotional processes that occur during the individual response, with no interference of language understand-ing or cultural variables [14]. The Rorschach test was applied following the comprehensive system [14,22–23]. Rorschach evaluation requires specific training and clinical experience and is not always included in the neuropsychological battery. In the present study, Rorschach test was applied by Dr. Jesu´s de Felipe-Oroquieta, who is a specialist in clinical psychology, neuropsy-chology and in Rorschach Test.
Only certain variables of the Rorschach test were analyzed, according to the psychopathology of the epileptic patients, namely: the schizophrenia index (Sczi), social ability index (Cdi) and depression index (Depi). To evaluate problem resolution and decision making in which emotionality and ideation are involved, the personality style of all patients was assessed. The personality style (P. Style), or erlebnistypus (EB), is a relevant variable in the Rorschach test, which quantifies the cognitive-perceptive respons-es of the subject [14]. The rrespons-esponsrespons-es to perception of movement of introversive subjects are two points higher than their responses to weighted color, while extratensive subjects are those whose responses to color are greater than their responses to movement. Finally, ambitents are individuals for whom the difference between the two variables is less than two points. Thus, patients were classified as introversive (EB1), extratensive (EB2) or ambitent (EB3). The Rorschach protocols followed were those included in the RorschachHInterpretation Assistance Program (RIAP5: John E. Exner Jr., Irving B. Weiner, and Par Staff; Psychological Assessment Resources Inc. Lutz, FL, USA). In order to group patients, the Sczi, Cdi and Depi indices were evaluated and classified as positive or negative (Table 2).
Supervised Classification Data Mining
The data was analyzed using supervised classification tech-niques. This design treats the feature defining the problem differently (as either full recovery from epilepsy or not). This variable is usually termed the class variable. Patient outcome was evaluated after surgery using the Engel’s scale [24]: Class I, seizure free (n = 14); Class II, rare disabling seizures (almost seizure free; n = 2); Class III, worthwhile improvement (n = 3). Classes II and III reflect improvement in the disease but not complete recovery. For this reason, both categories were grouped together. Thus, the supervised class variable describes seizure free patients (n = 14) and those exhibiting an improvement only (n = 5). Finally, the missing values mentioned in Table 2 were entered using the mode of the variable with missing values conditioned to the class variable.
performance of each paradigm, we used a leave-one-out cross-validation (LOOCV) scheme. This cross-validation scheme estimates the accuracy of a given classification model by inducing the same number of classifiers as comprises the dataset. Each intermediate model is built using all instances but one, and tested on the excluded instance. The accuracy estimation of the final model is obtained as the average accuracy of all intermediate classifiers. In addition to the estimated classification accuracy, the area under the receiving operating characteristic (ROC) curve or area under the curve (AUC) [25] was also calculated. These two measure-ments are classically used to compare classification models (for further details see Text S2).
Feature Subset Selection
To determine the best subset of features for classification and analyze the relevance of each feature, we developed a robust feature subset selection procedure to remove irrelevant and/or redundant features that hindered the classification procedure. Given the limited number of samples in the dataset, we approached the selection process by producing similar datasets of equivalent sizes but with slight differences. A total of 1,000 intermediate datasets were produced by random stratified resampling with replacement of the original dataset. For each dataset, a subset of features was selected using a race search algorithm [26].
Race search, or racing, applies paired and unpaired t-tests to the cross-validation accuracies of competing subsets of features. When
a significant difference exists between the means of the errors of two competing subsets, the poorer of the two can be eliminated from the race. The racing search was configured as a backward elimination, whereby the initial subset included all the original features and individual deletions were performed until no improvement was detected. For consistency in all experiments, a LOOCV scheme was used again. Once all the selections had been performed, the frequencies of each feature were computed as the number of times it was included in the model. In total, three frequency rankings were used, one for each classification paradigm. To determine which features to retain for each classification paradigm in the final model, a LOOCV scheme was applied adding features from those most often selected to those selected least. Similar procedures have achieved remarkable results when applied to similarly problematic datasets [27–29].
Results
Dataset Compilation
Out of the 23 subjects selected, no behavioral testing data was available for 4 subjects. Since this implies that many variables are lost in the dataset, these four samples were not used in the study. Accordingly, the data mining task was performed with 19 samples. The database comprised 19 features or variables, belonging to two different groups: 8 clinical variables and 11 items derived from neuropsychological tests (the number of samples per feature and value is shown in Table 2).
Table 1.Summary of the clinical data from the epileptic patients and the surgical outcome.
Patient
Age (years), sex, side
Age of onset,
duration (years) Seizure type Seizure frequency
Engel scale for surgical outcome/years after surgery
H48 41, m, L 18, 23 gen weekly I/12
H57 27, m, R 13, 14 PC 3 weekly I/11
H61 17, f, R 7, 17 PC 2 weekly I/11
H67 39, m, R 1, 38 gen weekly I/11
H75 37, m, L 13, 24 PC 2 weekly II/10
H84 31, m, R 2, 29 gen 4 weekly I/10
H94 27, m, L 20, 7 gen 3–5 weekly II/9
H104 32, m, L 12, 20 PC weekly I/9
H108 50, m, L 15, 35 gen 4 weekly III/9
H109 22, f, R 4, 18 PC 0–3 weekly I/9
H115 40, f, L 1.8, 38 gen 4 weekly III/9
H123 24, f, L 7, 17 gen daily I/8
H136 20, f, R 0.7, 19 gen weekly I/8
H220 53, f, L 13, 40 PC weekly I/4
H225 49, f, R 16, 33 PC weekly I/4
H229 40, f, R 2, 38 PC weekly I/4
H230 22, f, L 18, 4 PC, gen daily III/3
H231 23, m, L 1, 22 PC, gen daily I/3
H233 35, m, L 6, 29 PC, gen weekly III/3
H236 54, f, R 16, 38 PC, gen weekly I/3
H237 41, f, L 20, 21 PC, gen 2 weekly I/3
H238 22, f, R 11, 11 PC weekly I/3
H241 43, f, L 4, 39 PC, gen Not regular I/3
f: female, gen: secondarily generalized, L: Left, m: male, PC: partial complex seizures, PS: partial simple seizures, R: right, Engel scale for surgical outcome: class I seizure-free, class II rare seizures and class III worthwhile improvement.
Analysis of Pre-surgical Features
The data was analyzed using supervised classification tech-niques. The class feature refers to the Engel’s scale value indicated [24], grouped into two categories: seizure free (Engel grade I) or improvement only (Engel grades II and III). The classification was constructed using 19 variables, based on measurements taken before surgery (Table 2).
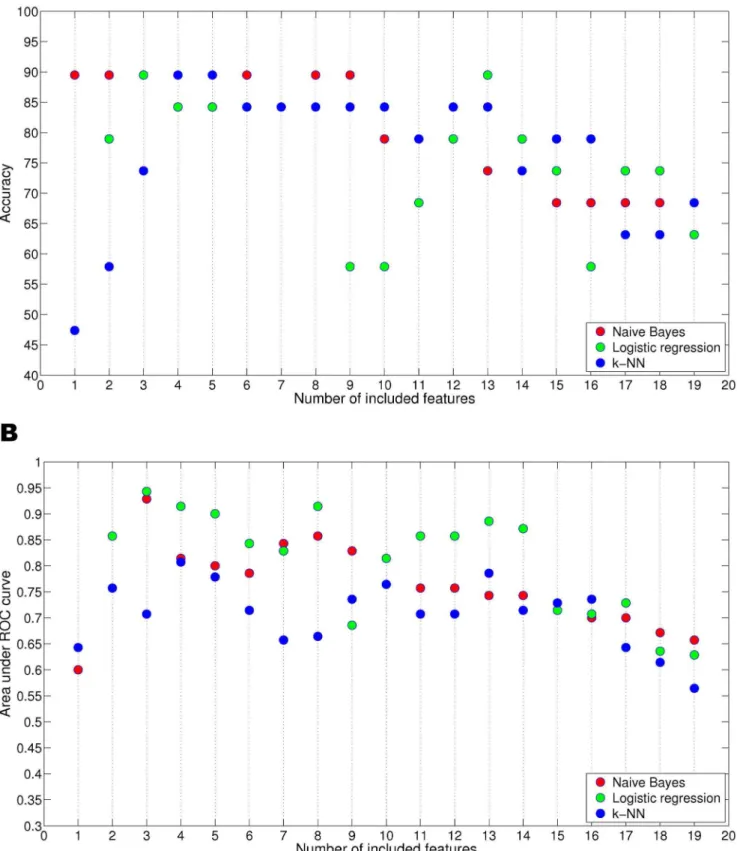
First, we determined the frequencies of the features selected during the search process in order to identify the variables (or subsets of variables) most relevant to the analysis (Figure 1). Choosing a robust and reliable set of relevant features is crucial, as the dimensionality of the database may overfit the results. To avoid such an effect, we performed a series of tests to analyze the classification power of the different subsets of features. Using a top-down scheme, we added features iteratively, one at a time, according to the frequency ordering obtained by the relevance analysis. Thus, the addition of features was guided by the ranking associated with each feature (as shown in Table 3). Accordingly, the first database projection was composed of only one feature, which was selected most frequently during the race selection. This process was repeated until all the features were included. The subsets of selected features in each race were not always the same and hence, although they are presented together for simplicity in Figure 2, the subsets that correspond to the same number of features (X axis) were almost always different. The naı¨ve Bayes model tends to select subsets with fewer features than those selected by either logistic regression or k-NN. Both logistic regression and k-NN are more stable in their behavior, with selection frequencies ranging from 600 and 900 for all variables. Some divergence was observed within the selection. For instance, PIQ was selected less than 300 times by the naı¨ve Bayes model, but approximately 850 times by the other two classifiers. Nevertheless, three features were consistently selected by the three
classifiers with high frequency, namely Side, PIQ and P. Style (Table 3).
For each of the projected datasets, the performance of the associated classifier was estimated using an LOOCV scheme to determine the classification power of the different feature subsets. When naı¨ve Bayes and logistic regression were used with three features, 89.47% accuracy was achieved in both cases with AUC values of 0.9285 and 0.9428, respectively, and an identical F-measure value of 0.9333 was obtained (Figure 2). The subset of three features was the same in both cases and comprised Side, P. Style and PIQ (Table 3). The best accuracy using the k-NN approach (again 89.47%, AUC value = 0.8071 and F-mea-sure = 0.9035) was achieved using four features, namely Side, P. Style, VIQ and Frequency of seizures.
As the three models used achieved the same level of estimated accuracy (89.47%), there was no need to choose between them. Moreover, the improvement with respect to the analyses including all the variables was significant; the inclusion of all 19 variables (Figure 2 and Table S3) resulted in accuracies of 68.42%, 63.15% and 68.42%, for the naı¨ve Bayes, logistic regression and k-NN, respectively (with AUC values ranging between 0.5642 and 0.6571, and F-measures between 0.7404 and 0.8125: Figure 2).
Hypothesis Test on the Pre-surgical Data
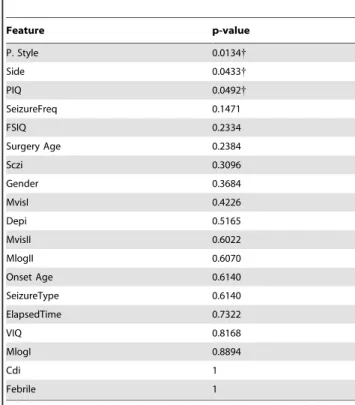
As a complementary measure, we performed a classical Wilcoxon signed-rank hypothesis test on the values obtained for all features in the classification. This test is a non-parametric statistical hypothesis test, in which the null hypothesis (H0) states that two samples come from a distribution with the same median. In our case, the two samples are the sets of each feature values grouped using the Engel output. Considering again the class variable (Engel) as the grouping variable, the features for which the null hypothesis (H0) is rejected will constitute the relevant features for the classification. Three features presented significant values
Table 2.Set of predictive variables and their associated values. Cardinalities of each value are shown between brackets. Missing values are also indicated.
Clinical features: Gender: Male (10), Female (9) Side: Left (10), Right (9)
Surgery age: 17- 32 (10), 33- 54 (9) Onset age: 0- 1 (4), 2- 10 (7), 11- 20 (8) Elapsed time: 7- 13 (3), 14- 19 (4), 20- 39 (12)
Type of seizure (SeizureType): Generalized (8), Partial Complex (7) or Both (4)
Frequency of seizures (SeizureFreq): Daily (2), Weekly (8), 2-Weekly (2), 3-Weekly (3), 4-Weekly (3), Other (1) Febrile seizures (Febrile): Negative (10), Positive (9)
Neuropsychological features: VIQ: Low (1), Normal-Low (4), Normal (8), Normal-High (3), High (1) - missing (2) PIQ: Low (1), Normal-Low (1), Normal (11), Normal-High (3), High (1) - missing (2) FSIQ: Low (0), Normal-Low (4), Normal (9), Normal-High (3), High (1) - missing (2) MlogI: Low (2), Normal-Low (5), Normal (11), Normal-High (0), High (0) - missing (1) MlogII: Low (2), Normal-Low (3), Normal (13), Normal-High (0), High (0) - missing (1) MvisI: Low (0), Normal-Low (2), Normal (13), Normal-High (1), High (2) - missing (1) MvisII: Low (0), Normal-Low (6), Normal (9), Normal-High (1), High (2) - missing (1) Schizophrenia index: Negative (9), Positive (3) - missing (7)
Coping deficit index: Negative (5), Positive (7) - missing (7) Depression index: Negative (4), Positive (8) - missing (7) P. Style: EB1 (3), EB2 (6), EB3 (3) - missing (7)
with a 95% confidence level: Side, PIQ and P. Style (Table 4), confirming their importance. Values of these features –stratified by class– are as follows: Seizure free (50% Left and 100% Right Side; 73.7% Normal, 100% Normal-High, 100% High PIQ; 100% EB1, 84.6% EB2 P. Style), and, Only improvement (50% Left Side; 100% Low, 100% Normal-Low, 26.3% Normal PIQ; 15.4% EB2, 100% EB3 P. Style). The combination of their values using both the naı¨ve Bayes and the logistic regression reached maximum accuracy, further supporting our findings.
Post-surgery Analysis
After surgery, the eleven psychological features were re-evaluated in the cohort of patients, although some values were lost due to the practical difficulties in assessing all patients. In addition, schizophrenia was removed as a feature, as it was irrelevant since there were no such cases. Therefore, 30 values (out of 165) were assigned using the associated conditional modes (based on the value of the Engel output) and, in total, there were 10 attributes and 15 instances: seizure-free (10) and improvement only (5).
The effects of surgery on cognitive function were first analyzed by comparing the psychological test results before and after surgery. The simplest way to compare these values was to subtract the post-surgery values from the pre-surgery values (the resulting values are denoted with the prefix Din Table S1). When these differences were compared using the Wilcoxon test, no significant differences were evident for any of the psychological features studied.
To investigate the possible link between post-surgery psycho-logical evaluation scores and surgical outcome, we performed a cluster analysis of all cases with respect to the post-surgery variables. A multinomial mixture model in which the parameters were estimated using the expectation-maximisation (EM) algo-rithm was selected for this purpose. This algoalgo-rithm provides the probability that a given case belongs to a cluster rather than a hard
assignment to that cluster. Since the distribution of the cases in terms of the Engel output was already known, the groups reported by the algorithm could be validated. This validation was satisfactory and when two groups were created, 13 out of the 15 cases were correctly clustered. Of the 13 correctly grouped cases, 8 were clustered in one group, while the remaining 5 were clustered in a second group along with the 2 incorrectly clustered cases (Table 5). This separation implies a significant pattern in post-surgical psychological evaluations that may be linked to surgery. This is more remarkable in the cases of "seizure-free" output, which maps with the first cluster.
We compared the post-surgery values of each feature with regard to the clustering assignments produced by the algorithm. It should be noted that the correspondence between the EM assignment and the real Engel outcome was not perfect (2 errors, Table S2). This analysis revealed significant differences for three features: postPIQ, postFIQ and postMvisII. Thus, the values of these three variables would appear to be relevant to the grouping differences between the cases in each cluster. Unfortunately, these results are of limited use because the association variable in the test is not actually adjusted to the class variable itself. We can only state that there are significant differences in these three features between the two clusters.
Discussion
Epileptic patients with pharmacoresistant TLE that are candidates for surgery are evaluated using time-consuming and expensive tests. Although epilepsy surgery is effective in reducing both the number and frequency of seizures, a significant proportion of these patients continue to suffer seizures after surgical intervention. Accordingly, there is considerable interest in identifying predictors of the surgical outcome in patients with TLE (for recent reviews see [10–11]). However, to the best of our knowledge, the relevance of individual clinical and psychological features has not yet been studied in detail, nor has a Rorschach
Figure 1. Number of times that features were included in the different intermediate subsets selected by the race search feature selection for over 1,000 dataset resamplings.
Figure 2. Estimated classification performance using LOOCV validation.Only features available before surgery were included in this performance analysis. The x-axis reflects the size of the subset of features retained. A) The upper chart shows the estimated accuracy; whereas, B) the lower chart shows the associated area under the ROC curve. Note that the features for a given point on the x-axis can differ depending on the classifier used (see Table 3 for the respective feature subsets).
evaluation of individual personality been included in the standard neuropsychological assessments used to predict surgical outcome [30]. The complexity of the data obtained from epileptic patients means it must be analyzed in a specific manner to identify any relationships and patterns. Given the usefulness of data mining in medical applications [31], we used machine learning tools to evaluate the ability of three supervised classifiers (naı¨ve Bayes, logistic regression and k-nearest neighbor) to predict the outcome of epilepsy surgery.
Analysis of the Pre-surgical Features
The first stage of our analysis involved the use of supervised classification to select features. Since all the features were included in the classification, this led to the generation of irrelevant and/or redundant information and we found that using three specific features produced the most accurate results: Side, P. Style and PIQ. Since locating the side on which seizure activity originates is generally accurate, particularly when determined by video electroencephalography [8–9], this feature represents a clear predictive variable. However, the findings also emphasize the importance of psychological features as good predictors (P. Style and PIQ).
Analysis of personality style revealed that while ambitent style (EB3) was associated with a poor surgical outcome (Engel II–III), introversive patients (EB1) had better surgical outcomes (Engel I) and that the outcome in the majority (85%) of extroversive (EB2) patients was good (Engel I). It is plausible that as yet unknown and complex mechanisms in the brain may underlie the relationship between different personality styles and the benefits that surgery
may produce. PET studies performed on TLE patients previously evaluated with a Rorschach test have demonstrated predominant hypometabolism in the left hemisphere of introversive patients,
Table 3.Variables ordered according to their frequency of selection during resampling and variable subset selection (occ: occurrence). Three different rankings are displayed - one for each of the classifiers used during the search.
Ranking Naı¨ve Bayes
Logistic
regression k-NN
Variable occ. Variable occ. Variable occ.
1 P. Style 958 Side 896 Side 891
2 Side 899 PIQ 885 SeizureFreq 870
3 PIQ 867 P. Style 875 P. Style 857
4 SeizureFreq 678 VIQ 862 VIQ 849
5 SurgeryAge 603 Depi 804 FSIQ 829
6 Sczi 596 FSIQ 772 OnsetAge 800
7 Gender 477 SurgeryAge 769 Sczi 773
8 Depi 446 Sczi 747 PIQ 765
9 OnsetAge 436 Gender 746 Depi 755
10 MlogI 428 MvisI 746 MvisII 754
11 MlogII 398 Cdi 740 Gender 734
12 FSIQ 395 ElapsedTime 738 MlogII 732
13 ElapsedTime 368 SeizureType 734 Febrile 728
14 Cdi 299 MlogI 723 SeizureType 707
15 MvisI 296 MvisII 722 ElapsedTime 699
16 VIQ 287 OnsetAge 721 MlogI 670
17 SeizureType 270 MlogII 716 Cdi 668
18 Febrile 258 Febrile 695 MvisI 627
19 MvisII 225 SeizureFreq 668 SurgeryAge 588
doi:10.1371/journal.pone.0062819.t003
Table 4.Features and associated p-values obtained from a Wilcoxon signed-rank test comparing the values of each feature with the Engel output. in order of increasing p-value.
Feature p-value
P. Style 0.0134{
Side 0.0433{
PIQ 0.0492{
SeizureFreq 0.1471
FSIQ 0.2334
Surgery Age 0.2384
Sczi 0.3096
Gender 0.3684
MvisI 0.4226
Depi 0.5165
MvisII 0.6022
MlogII 0.6070
Onset Age 0.6140
SeizureType 0.6140
ElapsedTime 0.7322
VIQ 0.8168
MlogI 0.8894
Cdi 1
Febrile 1
{
indicates statistical significance at a 95% confidence level. Features are listed. doi:10.1371/journal.pone.0062819.t004
Table 5.Probabilities of belonging to cluster 0 or cluster 1 for each case.
Case p(c0|x) p(c1|x) Engel 1 0.08417 0.91583 s1-seizure-free{
2 0.98861 0.01139 s1-seizure-free
3 0.95076 0.04924 s1-seizure-free
4 0.06282 0.93718 s2_3-only improvement
5 0.59592 0.40408 s1-seizure-free
6 0.01103 0.98897 s2_3-only improvement
7 0.99529 0.00471 s1-seizure-free
8 0.0332 0.9668 s2_3-only improvement
9 0.5379 0.4621 s1-seizure-free
10 0.01391 0.98609 s2_3-only improvement
11 0.00381 0.99619 s1-seizure-free{
12 0.95596 0.04404 s1-seizure-free
13 0.93247 0.06753 s1-seizure-free
14 0.5171 0.4829 s1-seizure-free
15 0.00944 0.99056 s2_3-only improvement
The last column shows the actual Engel score (not used in the clustering). {
indicates cases that were incorrectly clustered on the basis of the probability assigned by the clustering algorithm.
while extratensives displayed hypometabolism in the right hemisphere [32]. However, the cortical circuits involved in personality style and their role in seizure activity associated with hippocampal sclerosis remain unclear.
Patients with a normal-to-high and high PIQ displayed good surgical outcomes (Engel I), whereas seizure frequency was not reduced significantly in patients with low or normal-to-low PIQ scores (Engel II–III). Moreover, in the normal PIQ subgroup, a large proportion of the patients (77%) became seizure free (Engel I). The cognitive processes involved in the performance intelli-gence test remain unknown, although brain imaging studies suggest that some cortical regions are more critically involved than others, such as the frontal lobes [33–34]. In addition, lower PIQ may be associated with severe epilepsy, and perhaps with widespread brain disturbances, thus, the response to treatment would be more limited. Moreover, a positive correlation has been reported between PIQ scores and cortical grey matter thickness in regions of the temporal cortex [35–36]. Reduced cortical thickness, as measured by MRI, has also been described in the temporal, parietal, occipital and frontal lobes of TLE patients with hippocampal sclerosis [37]. Unfortunately, no volumetric cortical MRI studies were performed in our series of patients, precluding any analysis of the correlation between cortical volume and PIQ scores.
The three classification paradigms used in the present study were equally effective as tools to select epileptic patients as surgery candidates, with each showing the same estimated accuracy (89.47%). This estimation could be slightly overoptimistic as a side effect due to the use of LOOCV. However, our results revealed that relevant features are systematically found by all the classification models, reporting the same estimated performance. Even when there is a regularization penalty in the case of logistic regression, particular results are fully consistent with the rest. Therefore, in cases where data is available for the three key variables (Side, PIQ and P. Style) for a given population of TLE patients, any of these three classifiers would be useful when selecting the patients for surgery. Evaluations of similar classifiers with the inclusion of all features penalize the outcome prediction, most likely due to irrelevant and/or redundant information. This fact is in agreement with the behavior of classification models, which is not necessarily monotonic with respect to the inclusion of additional features [38].
Lastly, we found no significant difference in the evaluation of psychological features of our epileptic patients before and after
surgery, in line with the idea that personal psychological features are unchanged regardless of surgical outcome.
Although relatively few cases were examined, (n = 19), our findings were verified across all data, suggesting that the machine learning analysis described may become a powerful tool to be included in standard evaluations for epilepsy surgery centers. Since there are several thousand candidates for epilepsy surgery worldwide (with an estimated 100,000 to 200,000 potential candidates in the United States in 2003 alone [7]), the usefulness of our approach could be validated if implemented as a standard test for presurgical evaluation. This external validation on larger cohorts of patients is thus envisaged as crucial future work.
Supporting Information
Table S1 Wilcoxon signed-rank test comparing post-and
pre-surgery values of each feature (denoted with aDprefix). (DOC)
Table S2 Wilcoxon signed-rank test comparing the values of each psychological feature post-surgery using the clustering assignment as the grouping variable.
(DOC)
Table S3 Confusion matrices of the final classification using all
features and the most relevant three (naı¨ve Bayes and logistic) and four (k-NN) ones, respectively.
(DOC)
Text S1 Histopathological analyses protocol. (DOC)
Text S2 Supervised classification paradigms and performance measurement.
(DOC)
Acknowledgments
We thank A.I. Garcı´a and L. Valde´s for technical assistance.
Author Contributions
Conceived and designed the experiments: LAN JDF-O JDF RGdS. Performed the experiments: AK LAN JDF-O RGdS. Analyzed the data: RA LAN CB PL. Contributed reagents/materials/analysis tools: RA CB PL LAN AK JDF-O JDF RGdS. Wrote the paper: RA LAN JDF-O JDF CB PL.
References
1. Falconer MA (1974) Mesial temporal Ammon’s horn. sclerosis as a common cause of epilepsy. Aetiology, treatment, and prevention. Lancet 2:767–770. 2. Engel J Jr (1993) Historical perspectives and future directions. In: Wyllie E,
editors. The Treatment of Epilepsy, Principle and Practice. Philadelphia: Lea & Febiger. 989–998.
3. Wieser HG, Engel J Jr, Williamson PD, Babb TL, Gloor P (1993) Surgically remediable temporal lobe syndromes. In: Engel JJr, editors. Surgical treatment of epilepsies. New York: Raven Press. 49–63.
4. Meldrum BS, Bruton CJ, Adams J, Duchen LW (1992) Epilepsy. In: Graham DI, Lantos PL, editors. Greenfield’s Neuropathology. London: Arnold. 1246– 1283.
5. Honavar M, Meldrum BS, Graham DI, Lantos PL (1997) Epilepsy. In: Graham DI, Lantos PL, editors. Greenfield’s Neuropathology. London: Arnold. 931–971. 6. McIntosh AM, Wilson SJ, Berkovic SF (2001) Seizure outcome after temporal lobectomy: current research practice and findings. Epilepsia 42: 1288–1307. 7. Engel J Jr, Wiebe S, French J, Sperling M, Williamson P, et al. (2003) Practice
parameter: temporal lobe and localized neocortical resections for epilepsy: report of the Quality Standards Subcommittee of the American Academy of Neurology, in association with the American Epilepsy Society and the American Association of Neurological Surgeons. Neurology 60: 538–547.
8. Sola RG, Hernando-Requejo V, Pastor J, Garcia-Navarrete E, DeFelipe J, et al. (2005) Pharmacoresistant temporal-lobe epilepsy. Exploration with foramen ovale electrodes and surgical outcomes. Rev Neurol 41: 4–16.
9. Spencer S, Huh L (2008) Outcomes of epilepsy surgery in adults and children. Lancet Neurol 7: 525–537.
10. Aull-Watschinger S, Pataraia E, Czech T, Baumgartner C (2008) Outcome predictors for surgical treatment of temporal lobe epilepsy with hippocampal sclerosis. Epilepsia 49: 1308–1316.
11. Thom M, Mathern GW, Cross JH, Bertram EH (2010) Mesial temporal lobe epilepsy: How do we improve surgical outcome? Ann Neurol 68: 424–434. 12. Lacruz ME, Alarcon G, Akanuma N, Lum FCK, Kissani N, et al. (2004)
Neuropsychological effects associated with temporal lobectomy and amygdalo-hippocampectomy depending on Wada test failure. J Neurol Neurosurg Psychiatry 75: 600–607.
13. Akanuma N, Alarcon G, Lum F, Morris RG, Koutroumanidis M, et al. (2003) Lateralising value of neuropsychological protocols for presurgical assessment of temporal lobe epilepsy. Epilepsia 44: 408–418.
14. Exner J (1990) A Rorschach workbook for the comprehensive system. Rorschach Workshops, Asheville.
15. Yu HY, Shih YH, Su TP, Lin KN, Yiu CH, et al. (2009) Preoperative IQ predicts seizure outcomes after anterior temporal lobectomy. Seizure 18: 639– 43.
17. Arle JE, Perrine K, Devinsky O, Doyle WK (1999) Neural network analysis of preoperative variables and outcome in epilepsy surgery. J Neurosur 90: 998– 1004.
18. WMA (2008) Declaration of Helsinki, Sixth revision. In: World Medical Association.
19. Spencer DD, Engel J Jr (1993) Technical controversies. In: Engel JJr, editors. Surgical treatment of epilepsies. New York: Raven Press. 583–586.
20. Wechsler D (1997) Weschsler Adult Intelligence Scale. San Antonio: Psychological Corporation.
21. Wechsler D (1981) Wechsler Intelligence Scale for Adults-Revised. New York: Psycological Corporation.
22. Exner J (1991) The Rorschach, A comprehensive System. Interpretation. New York: Wiley. 2ndEd.
23. Exner J (1993) The Rorschach: A comprehensive System. Basic foundations. New York: Wiley. 3rd
Ed.
24. Engel J Jr (1987) Outcome with respect to epileptic seizures. In: Engel Jjr, editors. Surgical treatment of epilepsies. New York: Raven Press. 553–571. 25. Pepe MS (2004) The Statistical Evaluation of Medical Test for Classification and
Prediction. Oxford: University Press.
26. Moore AW, Lee MS (1994). Efficient algorithms for minimizing cross validation error. In: Proceedings of the Eleventh International Conference on Machine Learning. 190–198.
27. Otaegui D, Baranzini S, Arman˜anzas R, Calvo B, Mun˜oz-Culla M, et al. (2009) Differential micro RNA expression in PBMC from multiple sclerosis patients. PLoS ONE 4 (7): e6309.
28. Arman˜anzas R, Larran˜aga P, Bielza C (2012) Ensemble transcript interaction networks: A case study on Alzheimer’s disease. Comput Methods Programs Biomed 108: 442–450.
29. Garcı´a-Bilbao A, Arman˜anzas R, Ispizua Z, Calvo B, Alonso-Varona A, et al (2012) Identification of a biomarker panel for colorectal cancer diagnosis. BMC Cancer 12(43).
30. Jones-Gotman M, Smith ML, Risse GL, Westerveld M, Swanson SJ, et al. (2010) The contribution of neuropsychology to diagnostic assessment in epilepsy. Epilepsy Behav 18: 3–12.
31. Larran˜aga P, Calvo B, Santana R, Bielza C, Galdiano J, et al. (2006) Machine Learning in Bioinformatics. Brief Bioinform 17: 86–112.
32. de Felipe-Oroquieta J, Ortega F, Maldonado A, Pozo MA, Sola RG (2007) Cerebral Metabolism and Personality in Patients with Epilepsy of the Temporal Pole. Rorschachiana 28: 3–15.
33. Duncan J, Seitz RJ, Kolodny J, Bor D, Herzog H et al. (2000) A neural basis for general intelligence. Science 289: 457–460.
34. Gray JR, Chabris CF, Braver TS (2003) Neural mechanisms of general fluid intelligence. Nature Neurosci 6: 316–322.
35. Narr KL, Woods RP, Thompson PM, Szeszko P, Robinson D, et al. (2007) Relationships between IQ and regional cortical gray matter thickness in healthy adults. Cereb Cortex 17: 2163–2171.
36. Choi YY, Shamosh NA, Cho SH, DeYoung CG, Lee MJ, et al. (2008) Multiple bases of human intelligence revealed by cortical thickness and neural activation. J Neurosci 28: 10323–10329.
37. Lin JJ, Salamon N, Lee AD, Dutton RA, Geaga JA, et al. (2007) Reduced neocortical thickness and complexity mapped in mesial temporal lobe epilepsy with hippocampal sclerosis. Cereb Cortex 17: 2007–2018.