Page
1
of
11
Applying Data Mining Technique for the Optimal
Usage of Neonatal Incubator
Hagar Fady1, Taha Taha2and Mervat Mousa3
1
Dept. Of Computer Science & Eng., Faculty of Electronic Engineering
Menoufiya University, Menouf, Egypt [email protected]
2 Dept. Of Electronic & Electrical communication, Faculty of Electronic Engineering
Menoufiya University, Menouf, Egypt [email protected] 3
Dept. Of Computer Science & Eng., Faculty of Electronic Engineering
Menoufiya University, Menouf, Egypt [email protected]
Abstract
This research aims to provide intelligent tool to predict incubator Length of Stay (LOS) of infants which shall increase the utilization and management of infant incubators. The data sets of Egyptian Neonatal Network (EGNN) were employed and Oracle Data Miner (ODM) tool was used for the analysis and prediction of data. The obtained results indicated that data mining technique is an appropriate and sufficiently sensitive method to predict required LOS of premature and ill infant.
Key words: Length of Stay, Data Mining, Regression, Incubator, Premature.
1.
Introduction
Data Mining is the analysis of observational datasets to find unsuspected relationships and summarize data in novel ways that are both understandable and useful to the data owner. Data mining also can discover valuable and hidden knowledge from databases [1]. In healthcare, data mining is becoming increasingly popular, if not increasingly essential [2]. The healthcare environment is still ''information rich'' but ''knowledge poor''. There is a wealth of data available within the healthcare systems. However, there is a lack of effective analysis tools to discover hidden relationships and trends in data [3].
According to World Health Organisation (WHO) 30 August 2011 | Geneva, newborn deaths, that is deaths
in the first four weeks of life (neonatal period), today account for 41% of all child deaths before the age of five. The first week of life is the riskiest week for newborns, and yet many countries are only just beginning postnatal care programmes to reach mothers and babies at this critical time. Almost 99% of newborn deaths occur in the developing world. With a reduction of 1% per year, Africa has seen the slowest progress of any region in the world. Existing interventions can prevent two-thirds or more of these deaths if they reach those in need [4].
different propose a proposed This pape related demonstr module u the resea study of previous [7]. The section 6
2.
Re
Few in predictio extremely focused o or explor specified preterm model (M based on Ref. [8], inpatient departme decision Bayesian addition, used for [7] devel with tim factors o perinatal models categoric gestation3. A Su
Determ
In this p Process f suggested This met understan Modeling cyclical p algorithms to algorithms are d by Hintz et a
er is organized work in L rates process used in LOS p arch results. S f the propose research algo conclusion .
elated Wor
the literatu n in the hig y preterm in on the effects red variables t d LOS [7]. neonates usi MR) and an a n few prenatal, applied data length of ent. They app tree C4.5 and n classifier (NB
Naive Bayes missing data loped linear a me dependent only, perinatal
_ early-neo used to pred cal outcome fo nal age.
uggested D
mining LOS
aper, CRISP-for Data Mini d data mining thodology co nding, Data un g, Evaluation process (see F
o estimate incu e compared w al [7].
d as follows. S LOS predict
, algorithms prediction. Se Section 5, giv ed algorithms orithm presen
of the paper
rk
ure have in gh-risk patie nfants. Previo
of specific m that were asso Ref. [6], pr ing multiple artificial neura , perinatal and a mining tech stay in a plied one of th
d its successo BC) and its su sian imputatio handling. In and logistic r covariate in l _ early-neo onatal _later dict LOS as for infants <27
Data Minin
S
-DM (CRoss-ng) methodol g process for nsists of six nderstanding, n, Deploymen Fig. 1.) [9].
ubator's LOS. with the algorit
Section 2, rev tion. Section
and structur ection 4, descr ves a perform
s compared nted by Hintz is introduce
nvestigated ent population
ous studies morbidities on ociated with a edicted LOS linear regres al network (A d neonatal fac hniques to pr
geriatric hos he two classif or R-C4.5s, N uccessor NBC on (NBI) mod 2009, Hintz regression mo nclusion (perin onatal factors,
r factors). T s continuous 7 weeks estim
ng Process
Industry Stan logy is used a determining L phases (Busi Data prepara nt) intended . The thms views n 3 re of ribes mance with et al ed in LOS n of have LOS a pre-S for ssion ANN) ctors. edict spital fiers: Naïve Cs. In del is et al odels natal and These and mated
For
ndard as the LOS. iness ation, as a3. a Business
3.a.1 Pro EGNN is a n is to improve care in Egy research, edu
3.a.2 Pr It was found prediction m studies used linear regres network in L methods wer relied on the with EGNN. From previou is to predic creating hig models. 3.b Data Pre Data preparat selection, da applied to th efficiency, a prediction pro 3.b.1 Data The study w neonatal care
Fig. 1 CRISP
s and Data un
ocedures and not-for-profit o e the efficacy ypt through a ucation, and qu
revious resear that previous models based o statistical tec ssion, logisti OS prediction re used, no p e cases occurr
us survey it is ct LOS in E gh accuracy
eparation tion includes ata cleaning he data to he and scalability
ocess. a selection was done on
e unit .Tanta
P-DM Process
nderstanding
d forms of EG organization w and efficienc a co-ordinate uality improve rch researches de on few risk f chniques such ic regression n model. Altho
previous repo red in Egypt
s clearly that Egyptian env predictive
3 preprocessi and data tr elp improve y of the cla
n 443 infants University H
g
GNN: whose mission cy of neonatal e program of ement [10].
eveloped LOS factors. Those h as multiple n and neural ough different ort studied or and available
research goal vironment via data mining
ing steps (data ransformation) the accuracy assification or
Page
3
of
11
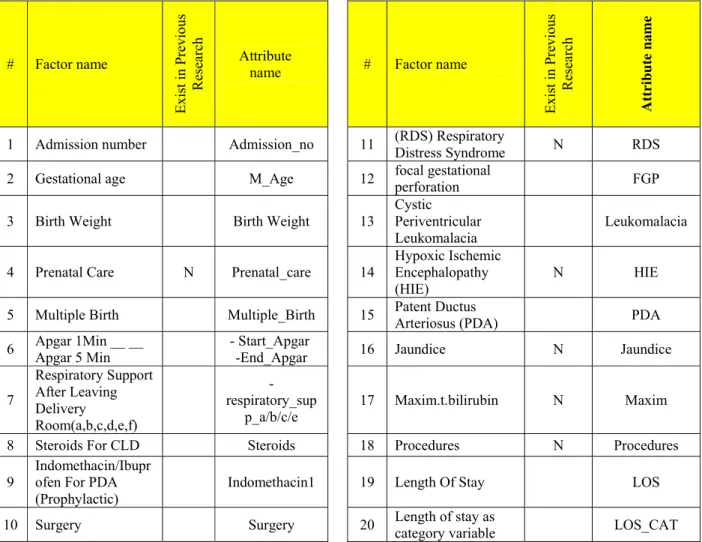
December 2010 and December 2011. Dead infants and Cases transferred to other hospitals before being discharged home were excluded. Infant's age ranged from 16 to 47 weeks and body weight ranged from 700 g to 5000 g. Data were organized and stored in electronic format. Each studied factor was identified
based on EGNN manual and prenatal specialists consulted as shown in [11] , [12]. Table 1 shows sample of those factors. Factors that were not included in previous research, Hintz et al [7], are marked with “N” in the column “Exist in Previous Research” of table 1 below.
Table 1: Sample Of Factors Studied In This Research
# Factor name
Exist i
n
Pr
evi
o
us
Research
Attribute
name # Factor name
Exist i
n
Pr
evi
o
us
Research
A
ttribut
e
na
me
1 Admission number Admission_no 11 (RDS) Respiratory
Distress Syndrome N RDS
2 Gestational age M_Age 12 focal gestational
perforation FGP
3 Birth Weight Birth Weight 13
Cystic Periventricular Leukomalacia
Leukomalacia
4 Prenatal Care N Prenatal_care 14
Hypoxic Ischemic Encephalopathy (HIE)
N HIE
5 Multiple Birth Multiple_Birth 15 Patent Ductus
Arteriosus (PDA) PDA
6 Apgar 1Min __ __
Apgar 5 Min
- Start_Apgar
-End_Apgar 16 Jaundice N Jaundice
7
Respiratory Support After Leaving Delivery
Room(a,b,c,d,e,f)
-respiratory_sup
p_a/b/c/e
17 Maxim.t.bilirubin N Maxim
8 Steroids For CLD Steroids 18 Procedures N Procedures
9
Indomethacin/Ibupr ofen For PDA (Prophylactic)
Indomethacin1 19 Length Of Stay LOS
10 Surgery Surgery 20 Length of stay as
category variable LOS_CAT
3.b.2 Data cleaning
In order to perform LOS prediction using ODM, the risk factors was represented in oracle database as attributes for the master table named TEST13_12 with (admission_no) primary key. data acquired from the hospital tends to be incomplete, noisy and inconsistent. In this step, we attempt to fill on missing values, smooth out noise while identifying outliers, and correct inconsistencies in the data. Historical Data collected from EGNN forms were
loaded into TEST13_12 table as data set using SQL developer release 3.
3. b.3 Data transformation
The study sample was randomly split into a development sample (211 patients [70%]),
strategy) “Other”. 3.c Modu 3.c.1 Tec Data min the follow I – It is n research II – Its ab III – Diff analyzed 3.c.2 Too
a. Attrib Oracle D Attribute Minimum attributes value. At size of a knowledg increasin
b. Predic
b‐1 mo
ba
and the res
ule Developm chnique selec ning was selec
wing: not commonly
might reach n bility to handl ferent mining d.
ol selection
bute Importan Data Mining e Importance m Description s by significa ttribute Impor a Classificatio ge needed to ng speed and a
ctive Model a Impo
b-1 P Categori
La
‐a Classificatio odel with naiv ayes algorithm
st recoded in
ment (modelin tion
cted for this re
used in LOS new results.
le huge amoun algorithms ca
nce Model g provides
(AI) that us n Length (M ance in deter rtance can be u
n problem, g eliminate som accuracy [13]. a- Attribute
ortance Mode
Predict LOS ical Variable ate) Discharg
on ve m
Cla model vect a
nto a bin na
ng)
esearch becaus
prediction, so
nts of data. an be tried and
Fig. 2 Wo
a feature c ses the algor MDL) to rank mining the ta used to reduc iving the user me attributes,
Strategies
el
b-As (Early, ge
b-1-b assification
l with support tor machine algorithm
amed
se of
o this
d
orking Strategies
alled rithm k the
arget e the r the thus
s and algorith
- Predictive Models
b Class mod logestic algo
The following I – Oracle mining activi release 11.1.0 II – Oracle SQ III – MS Exc
3. c.3 Definin The following strategies and
and Algorithms
b.1 Predic late) dischar Three predic classification logistic regr consulted adv classified as discharge. M
hms
-1-c ification del with
regression orithm
c- S A
g tools are use Data Miner ity, that act as 0.6.0 as a serv
QL developer el.
ng strategies g flow chart ( d algorithms:
ct LOS as ca rge
ctive models n method with
ession algori vised that if L early disch ore details are
b-2 Predi
b‐2‐a Regr model w support v machine alg Statestical
nalysis
ed in this rese version 11.1 s a client and ver.
r.
and algorithm Fig. 2) shows
ategorical va
s were const h Naive Baye ithms. Prenat LOS is less tha arge, otherwi e below.
ct LOS As C Variable
ression with vector
gorithm
earch: 1.0.4, for the d 11g database
ms s the work
riable (early
tructed using es , SVM and tal specialists an 30 day, it is ise it is late ontinuous
b-2-b Linear regression model(GLM)
e e
,
Page
5
of
11
b.1.a Classifications model with Naïve Bayes algorithm
Naïve Bayes looked at the historical data and calculated conditional probabilities for the target values by observing the frequency of attribute values and of combinations of attribute values [13].
The Bayes theorem states that
Prob B given A Prob A and B / Prob A (1)
Where B represents target class (early, late) and A represents attribute value.
The algorithm must count the number of cases where A and B occur together as a percentage of all cases (“pairwise” occurrences), and divide that by the number of cases where A occurs as a percentage of all cases (“singleton” occurrences). If these percentages are very small, they probably won’t contribute to the effectiveness of the model [12].
b.1.b Classifications model with Support Vector Machine algorithm
Oracle Data Mining supports two kernels, Linear and Gaussian. Data records with N attributes can be thought of as points in N-dimensional space, and SVM attempts to separate the points into subsets with homogeneous target values; points are separated by hyperplanes in the linear case, and in the non-linear case (Gaussian) by non-linear separators. SVM finds the vectors that define the separators giving the widest separation of classes (the “support vectors”) [13]. SVMs belong to the general category of kernel methods. A kernel method is an algorithm that depends on the data only through dot-products. When this is the case, the dot product can be replaced by a kernel function which computes a dot product in some possibly high dimensional feature space [31]. The naive way of making a non-linear classifier out of a linear classifier is to map our data from the input space X to a feature space F using a non-linear function ϕ : X → F In the space F the discriminant function is:
∅ (2) Suppose the weight vector can be expressed as a
linear combination of the training examples, i.e.
W ∑ α X (3)
Then: f X ∑ α X X b. (4) In the feature space, F this expression takes the form:
∅ ∅ (5)
the kernel function k x, x defined as , ∅ ∅ (6)
In terms of the kernel function the discriminant function is ∑ , (7)
The widely used kernel is the Gaussian kernel defined by: k X, X' exp ‐ɣ||X‐ X'|| (8)
Where ɣ is a parameter that controls the width of Gaussian [14]. In build activity, the kernel function was selected to be system determined, which allows the algorithm to select automatically the appropriate version of SVM to use. The active learning option was enabled.
It is a methodology, internally implemented, that optimizes the selection of a subset of the support vectors which will maintain accuracy while enhancing the speed of the model [13].
b.1.c Classifications model with logistic regression algorithm/(GLM)
Generalized linear models (GLM) represent the theoretical foundation on which linear regression can be applied to the modeling of categorical response variables. Common types of generalized linear models include logistic regression and Poisson regression. Logistic regression models the probability of some event occurring as a linear function of a set of predictor variables [14]. This model was developed for the validation of our result. it was used by the previous research [7]. The reference target class was 'early' class.
b.2 Predict LOS as Continuous Variable( the Number Of Days Spent At Incubator) 2 predictive models were constructed using regression method with support vector machine and linear regression algorithm to predict the target variable (LOS).
b.2.a Regression model with support vector machine algorithm
SVM solves regression problems by defining an N-dimensional “tube” around the data points, determining the vectors giving the widest separation [13].As the SVM setting in classification model, the kernel function was selected to be system determined, active learning was also enabled.
estimatin function a set of p error (e) y F x, The term linear reg …, xn). regressio dimensio computed single-pr paramete
y θ
This algo by co all.Confi
c. Statist Statistica used to and actua
In modul were des module IT\progra
4. Rese
4.aSam
1) 371 i .death infant 35 w were (25- weeks distrib 2) The in gram. infant 3) 78.81 discha
ng the value o (F) of one or parameters (θ1
[15]. θ e m multivariat gression with When multi on line cann onal space.
d simply by redictor linea ers for each of
θ x θ x
orithm was u mparing p dence level w
tical Analyses al analysis su explore the a al LOS.
le deploymen signed to enab in an efficie amming backg
earch Resu
mple Summar
infants were h occurred in ts in the study weeks 'estimat
between 30 a 30) weeks’ s’ EGA. Fi bution of infan
nfants birth w . Figure 4 sho ts' weight.
% of infant arge and 21.19
of a continuo more predicto
1 , θ2 , ..., θn),
te linear reg two or more iple predicto not be visu
However, th y expanding
ar regression f the predictor
... θn xn‐
used to valida prediction c was selected to
s
uch Pearson association b
nt phase, Simp ble medical te ent way with
ground.
ults
ry
included in n 18.6% of t y group, 235 ted gestationa and 35 weeks EGA range igure 3 sho nts' age. weight range
ows the samp
ts were cate 9% were late.
ous target (y) ors (x1, x2 , ... and a measu
gression refer predictors (x rs are used, ualized in he line can the equation to include s [15].
e (
ate our algorit capabilities o be 0.95.
correlation w etween predi
ple user interf eam to operate hout perquisit
the study sam them. Of the
were greater al age (EGA) ’ EGA, 8 we and 2 were ows the sam
from 700 to 5 ple distributio
egorized as e as a , xn), ure of
9 rs to
1, x2, the two-n be n for
the
(10)
thms for
were ctors
faces e the te of
mple 302 than ), 57
re in <25 mple
5000 on of
early
F
Fig. 5
Fig. 3 Sample
Fig. 4 Sample Di
5 Sample Distribu
Distribution – A
stribution – Birth
ution – LOS – Ca
Age
h Weight
ategory
4.b Char Table 2 c variable groups. F observed were earl EGA, av and 25% (LOS) w were late was abou discharge Age g r oup w eek E G A 25
25 – 30
30 – 35
>35
Table 2: L (early, late)
4.c Attr It ranke determin in fig 6. as they developm Leukoma sepsis, R Room(c,b higher si are still importan study the racterizing in characterizes (early, late) For infants le d average LO
ly discharge ; verage(LOS) w % were late; fo was about 25.5
e; for infants ut 17.9 day,8 e.
LOS
Avera
ge
18.0
0 20.0
5 25.5
17.9
LOS in days acc ) according to EG
ribute import ed the risk
ing the target As a result,
added nois ment samp alacia, Hemo Respiratory Su b), Maxim.t.b ignificance th taken into nce. Statistical
e relation betw
Fig. 6 Ranking R
ncubator leng LOS in days according to ess than 25 w OS was 18 da
; for infants a was 20 day , for infants at 5 day,70% we greater than 81% were ea
Avera ge Early n (% in EGA 2(100 6(75) 40(70 190(8
cording to EGA GA group
tance model r factors by variable (LO some attribute se or had n le i.e. I orrhage . S upport After bilirubin(jaund han other fact
consideratio l correlation w ween LOS and
Risk Factors by S
gth of stay and as catego o gestational weeks’ EGA ay,100% of t at 25 to 30 we , 75% were e 30 to 35, ave re early and 3 or equal to 3 arly ,19 were
Gro u p ) Lat e n (% in EGA
0) 0(0
) 2(25
0) 17(3
1) 45(1
group, LOS cat
result: significance S_CAT) as sh es was elimin no frequency Indomethacin Steroids, surg
Leaving Deli dice degree) ors .Other fa n but with was carried ou d other factors
ignificance
Page
7
of
orical age , the them eeks’ early erage 30 % 35, it late ( Gro u p ) ) 5) 0) 9) tegory e in hown nated y in n , gery, ivery had ctors less ut to .
11
4.d Predictin Variable (Ea 4.d.a Clas algorithm The model’ sample), show discharge for value 0 take discharge. D attributes -w them, show h discharge for 4.d.bCla Machine alg The setting determined” chose Gaussi 4.d.cClass regression al
Figure 8 sho class (late) descending o PDA, sepsis, and prenatal coefficient v which imply predicting lat
ng Length of arly Or Late)
ssification mo m
Fig. 7 Naive Ba
s build acti ws the probab r a given attri
the highest Down _syndro with values 0, high probabili r.
assification m orithm g for build
regarding Ke an function.
sification mo lgorithm
ows the coeffic .The coeffic order .some , surgery ,dow l_care with values in a that they w te discharge.
Stay as Categ )
odel with naï
ayes Build Result
ivity result bilities for pr ibute value.
probability o ome, FGP, PD
, indicates th ity for infant o
model with Su
d activity w ernel function
del with logis
cient statistics cients were attributes, lik wn_syndrom) value 0, h a logistic regre were extremely gorical ïve bayes (development redicting early Steroids with of being early DA and other he absence of of being early
pport Vector
was “system n. The system
stic
s for the target e sorted in ke( steroids
4.e Predi Variable
4.e.a Mach
The set determin chose G 2.751, co and epsil
Fig. 9 gi an indica value (in Clearly, around considera
4.e.b Algor
Fig 10 sh class (LO _Syndrom Prematur
Fig. 8 Coefficien
icting Length e
Regression m hine algorithm
Model
tting for b ed” regarding Gaussian func
omplexity fac lon: 0.024
Residu
ives informati ation of the n the Test dat for all LOS, the zero e able error exis
Fig.
Regression M rithm
Coeffi hows the coe OS). some att me, BPD_D rity, Surgery)
nt Statistics for T
h of Stay as C
model with Su m
l build activit build activity
g Kernel func ction with sta ctor: 0.51412,
ual plot ion about the
difference be taset) and the , majority of error, howev st in different
9 Residual Plot
Model with L
cient statistic efficient statis tributes, like( Diagnoses, ) with value
arget Class
Continuous
upport Vecto
ty result y was “sy ction. The sy andard devia , tolerance: 0
residuals, tha etween the a e predicted v f predictions
ver, cases LOS intervals
inear Regres
cs
stics for the ta ( Steroids, D IDM_Diagno 1, had a l r
ystem ystem ation: 0.001
at is, ctual alue. exist with s.
sion
arget Down oses, large
coefficient va that they wer
4.f Sta
Table 4 below
Table
risk fact
Age
Birth Weigh
FGP head_circum IDM IUGR
alues in a regr e extremely e
Fig. 10 Coeffi
Residual P
Fig. 11 Re
atistical Corr
w shows statis
e 4: Statistical
tor P
Co
-ht
-m (
ression mode ffective in pre
icient Statistics
Plot
esidual Plot
elation Resul
stical correlati
Correlation R
Pearson orrelation
(0.095)
-.153**
0.076 (0.019)
0.054 0.023
l which imply edicting LOS.
lts
ion results.
Results
P
0.098133173
<0.01
0.186937449 0.743911909 0.346665449 0.690037744 y
3
Page
9
of
11
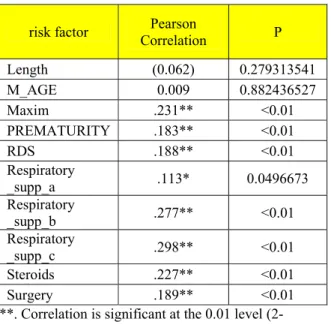
risk factor Pearson
Correlation P
Length (0.062) 0.279313541
M_AGE 0.009 0.882436527
Maxim .231** <0.01
PREMATURITY .183** <0.01
RDS .188** <0.01
Respiratory
_supp_a .113* 0.0496673
Respiratory
_supp_b .277** <0.01
Respiratory
_supp_c .298** <0.01
Steroids .227** <0.01
Surgery .189** <0.01
**. Correlation is significant at the 0.01 level (2-tailed).
*. Correlation is significant at the 0.05 level (2-tailed).
Although attribute importance model had neglected some risk factors in its ranking, the statistical analysis showed strong correlation between LOS and these factors. Birth weight, prematurity, maxim (jaundice degree), surgery, and steroids were strongly correlated with LOS. RDS, prematurity, maxim, surgery were positively associated with LOS, while birth weight, gestational age were inversely associated with LOS.
5. Module Evaluation
This work makes performance evaluation based on several criteria as shown in table 5, 6. Predictive confidence is a visual indication of the effectiveness of the model compared to a guess based on the distribution of target values in the build dataset [13]. If the model has a predictive confidence of 65.64% that means it is 65.64% better than naïve model.
The comparative tables (5,6) of predictive capabilities in case of algorithms used in our study and previous research’s algorithm presented by Hintz et al [7]. shows that:
1-
In LOS prediction models as categorical variableIn models that used naïve bayes and support vector machine classification algorithms, there was little difference in predictive confidence, overall accuracy and (Area Under Curve) AUC. However, total cost
was less in SVM algorithm. On other hand, the logistic regression algorithm presented poor capabilities compared with our algorithms.
2-
in LOS prediction models as continuous variableThe SVM regression algorithm presented higher capability than linear regression algorithm by means of lower error and higher predictive confidence. SVM are becoming increasingly popular in medicine [16]. It can emulate some traditional methods, such as linear regression and neural nets, but goes far beyond those methods in flexibility, scalability, and speed [13].
Overall, the predictive validity of the research models was very good to excellent, with point estimates for the AUC of the Receiver Operating Characteristic (ROC) curves ranging between 0.90 and 0.89.
It was noticed that for algorithms used both in this research and previous researches, mentioned in related works sections, performance indicators were better in this research which deploys data mining techniques. This could be explained by [17]"Traditional statistical methods, in general, require a great deal of user interaction in order to validate the correctness of a model. As a result, statistical methods can be difficult to automate. Moreover, statistical methods typically do not scale well to very large data sets. Data mining methods are suitable for large data sets and can be more readily
automated ".
Table 5: Module – Performance Indicator Comparison For Categorical Variable
Performance indicator
support vector machine algorithm
naïve bayes algorithm
logistic regression algorithm
*
Predictive confidence
65.76% 65.64% 24.41%
Average accuracy 0.828 0.828 0.622 Overall accuracy 0.874 0.868 0.791
Total cost 38 103.77 63
Area under ROC curve
0.894 0.907 0.791
Table 6: Module – Performance Indicator Comparison for Continuous Variable
Performance Indicator
support vector machine
Linear regression*
Predictive confidence 27.12% 12.99%
Mean absolute error 8.09 12
Root Mean Square Error 13.94 16.64
*This algorithm was used by Hintz et al [7].
6. Conclusion
This research is based on data collected from Egyptian hospitals using EGGN forms. The majority of factors listed in EGNN forms are common with factors studied in previous research worldwide. However, some factors are reflecting the Egyptian environment; i.e. jaundice and maxim.t.bilirubin which were found to be highly impacting the LOS.
In order to verify the obtained results, the simulation results are compared with the published data and give a good agreement with more comprehensive results as the module is trained by all cases went to the incubator. The obtained results are expected to be useful for determining the LOS especially in the Egyptian environment. In this paper the problem of inaccurate prognoses of infant LOS, which led to misuse of incubators, are discussed. The focus is on using different algorithms for intelligent and effective LOS prediction using data mining. For predicting LOS, the risk factors are listed and different data mining techniques were used.
The outcome of predictive data mining technique on the same dataset reveals that support vector machine appears to be most effective in categorical los prediction as it has the lowest cost, highest percentage of predictive confidence and accuracy, followed by naïve bayes (with a difference of less than 1% in predictive confidence) and logistic regression.
It also appears to be most effective for predicting LOS as continuous variable compared to the linear regression model. Other methods like logistic regression and linear regression are not performing well. The results showed that, our data mining algorithm has realized a better prediction confidence
and accuracy than the traditional statistical algorithms. The decision making for the length of stay has been improved and made more accurate. This provides the optimal and best incubator usage for the specific infant case.
Acknowledgments
Hager Fady thanks Dr.Asmaa Fady Sherief, assistant lecturer in forensic medicine and clinical toxicology department, Faculty of Medicine - Tanta university, for her help and cooperation in data collection. Also, Hager Fady thanks Dr.Eng.Ahmed Marzook for his guidance in Oracle programming.
References
[1] A. Almazyad, M. Ahamad and M. Siddiqui, "Effective Hypertensive Treatment Using Data Mining In Saudi Arabia," J. CLIN. MONITOR.
COMP., vol. 24, no. 2, 2010.
[2] H. Koh and G. Tan, "Data Mining Applications In Healthcare," J. Health. Info. Man, vol. 19, no. 2, pp. 64-72, 2005.
[3] J. Soni, U. Ansari, D. Sharma and S. Soni, "Predictive Data Mining for Medical Diagnosis:An Overview of Heart Disease Prediction," J. Comp. Appl., vol. 17, no. 8, Mar 2011.
[4] WHO, "Newborn deaths decrease but account for higher share of global child deaths," 2011. [Online]. Available:
http://www.who.int/mediacentre/news/releases/20 11/newborn_deaths_20110830/en/index.html.
[5] J. Sandham, "Baby Incubation," 2008. [Online]. Available: http://www.ebme.co.uk.
[6] B. Zerinkow and K. Holtmannspötter, "Predicting Length-Of-Stay In Preterm Neonates," European
Journal of Pediatrics, vol. 158, no. 1, 1999.
[7] S. Hintz, C. Bann, N. Ambalavanan, M. Cotten, A. Das and R. Higgins, "Predicting Time to Hospital Discharge for Extremely Preterm Infants," Journal of the American
Academy of Pediatrics, vol. 125, pp. 146-154, 2010.
Page
11
of
11
Stay," in 3rd International IEEE Conference on
Intelligent Systems, Aveiro, 2006.
[9] G. Kraljevic and S. Gotovac, "Modeling Data Mining Applications for Prediction of Prepaid Churn in Telecommunication Services," Automatika, vol. 51, no. 3, pp. 275-283, 2010.
[10] EGNN, "Egyptian Neonatal Network," [Online]. Available: http://www.egynewborn.net.
[11] EGNN, "28 Day/Discharge Form," EGNN, Cairo, 2010.
[12] EGNN, "Dataset Manual," EGNN, Cairo, 2010.
[13] R. Haberstroh, Oracle® Data Mining Tutorial for Oracle Data Mining 11g Release 1, Oracle, 2008.
[14] A. Ben-Hur and J. Weston, A User's Guide to Support Vector Machines.
[15] Oracle, "Introducing Oracle Data Mining, Oracle Data Mining Concepts 11g Release 1 (11.1)," [Online]. Available:
http://docs.oracle.com/cd/B28359_01/datamine.111/b28 129/intro_concepts.htm.
[16] M. Clinic, "Infant jaundice," Mayo Foundation for Medical Education and Research;, 2011. [Online]. Available: http://www.mayoclinic.com/health/infant-jaundice.
[17] Oracle Data Mining Concepts, 11g Release 1 (11.1), Oracle, 2008.
Hagar Fady was born in Tanta, Egypt, on March 14, 1984. She received B.Sc. degree (with distinction) in computer engineering from Tanta University, Egypt, in June 2005, the M.Sc. degree· in computer engineering from Menoufiya University, Egypt, in 2012. Currently she is a full time Oracle developer.
Taha E. Taha was born in Tanta, Egypt, on October 11, 1946. He received the B.Sc. degree (with distinction) in communication engineering from Menoufiya University, Egypt, in June 1969, the M.Sc. degree· in communication engineering from Helwan University, Egypt, in April 1978, and the Ph.D. degree (very honorable) in electronic engineering from the National Polytechnic
Institute, Toulouse, France, in June 1985. From September 1969 to July 1978, he was a
Demonstrator, in July 1978, he was an Assistant Lecturer, in November 1985, he was a Lecturer, in February 1990, he was an Assistant Professor, and in September 1995, he was named Professor, all in the Faculty of Electronic Engineering, Menoufiya University, Communication Department. He was appointed Vice Dean from February. 2002 to October 2005, and Head of the Communication Department, from November 2005 to July 2007. At present, he is an Emeritus Professor at the sa:ne department. His main research interests are surface acoustic wave devices, optical devices, superconductor devices, medical applications of ultrasound, and bioinformatics.