Sarcomere Lattice Geometry Influences
Cooperative Myosin Binding in Muscle
Bertrand C. W. Tanner1, Thomas L. Daniel2, Michael Regnier1*1Department of Bioengineering, University of Washington, Seattle, Washington, United States of America,2Department of Biology, University of Washington, Seattle, Washington, United States of America
In muscle, force emerges from myosin binding with actin (forming a cross-bridge). This actomyosin binding depends upon myofilament geometry, kinetics of thin-filament Ca2þactivation, and kinetics of cross-bridge cycling. Binding occurs within a compliant network of protein filaments where there is mechanical coupling between myosins along the thick-filament backbone and between actin monomers along the thin filament. Such mechanical coupling precludes using ordinary differential equation models when examining the effects of lattice geometry, kinetics, or compliance on force production. This study uses two stochastically driven, spatially explicit models to predict levels of cross-bridge binding, force, thin-filament Ca2þactivation, and ATP utilization. One model incorporates the 2-to-1 ratio of thin to thick filaments of vertebrate striated muscle (multi-filament model), while the other comprises only one thick and one thin filament (two-filament model). Simulations comparing these models show that the multi-filament predictions of force, fractional cross-bridge binding, and cross-bridge turnover are more consistent with published experimental values. Furthermore, the values predicted by the multi-filament model are greater than those values predicted by the two-filament model. These increases are larger than the relative increase of potential inter-filament interactions in the multi-filament model versus the two-filament model. This amplification of coordinated cross-bridge binding and cycling indicates a mechanism of cooperativity that depends on sarcomere lattice geometry, specifically the ratio and arrangement of myofilaments.
Citation: Tanner BCW, Daniel TL, Regnier M (2007) Sarcomere lattice geometry influences cooperative myosin binding in muscle. PLoS Comput Biol 3(7): e115. doi:10.1371/ journal.pcbi.0030115
Introduction
Muscle contraction is initiated by Ca2þbinding to troponin and the subsequent movement of tropomyosin on the thin filament, enabling myosin to cyclically attach and detach to actin (cross-bridge cycling) [1–7]. Underlying this process are myriad factors that contribute to the magnitude and time course of force production. These factors include the geometry of filaments in the sarcomere, the mechanical properties of the filaments and cross-bridges, the kinetics of thin-filament activation by Ca2þ, and the kinetics of cross-bridge cycling. Because contractile proteins interact in a highly structured, compliant lattice, mechanical coupling exists between myosins along the thick-filament backbone, between actin monomers or regulatory proteins (troponin and tropomyosin) along the thin filament, and between thick and thin filaments following cross-bridge formation. Thus, kinetic processes responsible for contraction are linked at the molecular level. Considerable evidence shows that Ca2þand cross-bridge binding at one location in the sarcomere can influence these processes at proximal regions of the sarcomere (reviewed in [7]), implying that coupled kinetics of thin-filament activation and cross-bridge cycling deter-mine the level of force generated in striated muscle.
Most models do not explicitly consider that spatial properties of muscle may influence contraction [1,3,4,6,8– 12]. Of the muscle contraction models containing both spatial and temporal variables, some provide either spatial predic-tions of steady-state condipredic-tions [9,13] or temporal predicpredic-tions of cross-bridge and thin-filament‘‘state’’without any spatial detail [12]. In contrast, a few recent spatially explicit models predict both spatial and temporal behavior [14–18], with
some simulations indicating that elasticity of the myofilament lattice contributes to coordination between cross-bridges that enhances bridge binding [15,17,18]. This cross-bridge–induced cross-bridge recruitment becomes a poten-tial mechanism of cooperativity that results from realignment between compliant myofilaments following myosin binding to actin. Previous spatially explicit models [14–17] lacked a Ca2þ regulatory cycle, spatially coordinated Ca2þactivation along the thin filament, and the physiological ratio of thick to thin filaments. These thin-filament components are particularly important for contraction because regions activated by Ca2þ binding to troponin largely determine the spatial distribution of bound cross-bridges. The current study adopts a spatially explicit model of regulatory proteins along the thin filament, in contrast to prior studies [17,18]. These additions enable investigating how force is controlled by two, coupled, spatial, and temporal processes: Ca2þ binding to activate the thin
Editor:Carl T. Bergstrom, University of Washington, United States of America
ReceivedFebruary 2, 2007;AcceptedMay 9, 2007;PublishedJuly 13, 2007
A previous version of this article appeared as an Early Online Release on May 10, 2007 (doi:10.1371/journal.pcbi.0030115.eor).
Copyright:Ó2007 Tanner et al. This is an open-access article distributed under the
terms of the Creative Commons Attribution License, which permits unrestricted use, distribution, and reproduction in any medium, provided the original author and source are credited.
Abbreviations:fa,fraction of modeled actin sites activated by Ca2þbinding to the thin filament;fxb,fraction of modeled myosin (cross-bridges) bound to actin;ka, spring constant for modeled thin-filament elements; km, spring constant for modeled thick-filament backbone elements; kxb, spring constant for modeled myosin;xb0, resting (unbound) distortion of myosin;x,distortion of the myosin
filament and subsequent myosin binding to the proximal, activated region of the thin filament.
Spatial and temporal aspects of contraction may be profoundly influenced by the coupled behavior between myosins throughout the compliant myofilament lattice, as nearly 70% of muscle compliance resides in the thick and thin filaments [19–23]. This significant compliance implies that cross-bridges do not operate independently while generating force [15,17,18]. Moreover, recent measurements [24–26] improve estimates about cross-bridge rate functions, depending on distortion and load, suggesting that the extent of realignment between compliant thick and thin filaments may affect kinetics of cross-bridge cycling (in addition to number of bound cross-bridges). Within this compliant system, however, the consequences of sarcomere lattice structure on cross-bridge dynamics remain unclear.
This study compares multiple models that have identical thin-filament and cross-bridge kinetics, but different model geometries, to examine the consequences of sarcomere lattice structure on Ca2þ-regulated contraction (Figure 1, see Meth-ods section). Consistent with previous models [15,17,18], motions and forces occur solely along the longitudinal axis of filaments in these current models (Figure 2). This one-dimensional assumption permits a system of linear equations to describe force-generating interactions between filaments (Equations 2–4). At the core of each model is a three-state cross-bridge cycle coupled with a three-state thin-filament regulatory model to control actomyosin binding through [Ca2þ]-sensitive kinetics (Figure 3). Initial model comparisons occurred between four different models (see Text S1). Of these geometric options, only one multi-filament model yields predictions that were consistent with the range of published values for muscle contraction (see Table S1). Therefore, we focus on comparing this multi-filament model (Figure 3) with a two-filament model (sensu[15]).
Throughout this study, we specifically consider contraction
in the absence of cooperative, kinetic feedback between thin-filament activation or cross-bridge binding [11,12,15,27–29]. Thus, any differences in simulation predictions between the multi-filament and two-filament models depend solely on differences between model geometry. Simulation results show that additional inter-filament interactions in the multi-filament model lead to greater fractional binding of cross-bridges, force production, and cross-bridge turnover com-pared with the two-filament model. Importantly, these increases are larger than predicted by normalizing for the Figure 1.Multi-Filament Geometry
The multi-filament model comprises four thick and eight thin filaments. (A) A cross-sectional representation of model geometry shows thick filaments in red and thin filaments in blue. Toroidal boundary conditions (outlined by the dotted white square) reflect the behavior at each edge onto the opposite edge of the simulation space. This condition permits simulating a subsection of infinite lattice space without any edge effects. (B) A truncated side view represents a single thick filament with two co-linear facing thin filaments in the plane of the page. Myosin extends from the central body of the thick filament. Thin filaments show each actin strand in a different shade of blue, with white actin monomers representing the actin nodes in the model. The proteins troponin (yellow) and tropomyosin (green) are located along each actin strand to provide Ca2þ-sensitive regulation of actin and myosin binding.
doi:10.1371/journal.pcbi.0030115.g001
Author Summary
Striated muscle is highly structured, and the molecular organization of muscle filaments varies within individuals (by fiber type) and taxonomically. The consequences of filament arrangement on muscle contraction, however, remain largely unknown. We explore how filament arrangement affects force production in muscle using spatially explicit models of many interacting myofilaments. Our analysis incorporates molecular scale force balance equations with Monte Carlo simulations of both actin–myosin interactions and thin-filament Ca2þactivation. Simulations show that a more physiological
additional filaments in the multi-filament model. These results indicate that there is a mechanism of cooperativity dependent upon sarcomere lattice structure (both the ratio and arrangement of myofilaments). Specifically, multi-fila-ment lattice structure further coordinates cross-bridge bind-ing to enhance cross-bridge recruitment and turnover without any requirements for cooperative feedback mecha-nisms attributed to thin-filament activation. Additional studies investigating other mechanisms of cooperativity acting via kinetic feedback pathways to amplify thin-filament activation or cross-bridge binding are ongoing in our lab and in others [30,31]. Findings from the current study, however, imply that certain lattice geometries facilitate greater cross-bridge binding and turnover, which may be an important mechanism of cooperativity contributing to muscle perform-ance. Earlier aspects of this work have been published previously [30,32,33].
Results
Three principle conclusions follow from our analysis of the multi-filament and two-filament models: 1) the multi-filament model simulates literature values of skeletal muscle force, ATPase, and cross-bridge binding better than the two-filament model; 2) in the absence of a cross-bridge feedback on thin-filament activation, there is no difference in Ca2þ sensitivity between the two models; and 3) multi-filament
model geometry amplifies the influence of filament compli-ance on cross-bridge binding and turnover.
Dynamic Behavior
These models provide both temporal and spatial predic-tions for force, cross-bridge binding, thin-filament Ca2þ activation (fraction-available actin nodes), and ATP con-sumption via cross-bridge turnover. Temporal dynamics of these predictions highlight similarities and differences between the simpler two-filament model and the multi-filament model (Figure 4). Although the multi-multi-filament and two-filament models show similar thin-filament activation dynamics that lead to greater magnitude and rate of force generation with increasing [Ca2þ], the multi-filament geom-etry produces higher force and signal-to-noise ratio. Max-imal, average, steady-state force (at pCa 4, where pCa ¼ log10[Ca2þ]) for the multi-filament model is 958.5632.3 pN,
compared with 9.2 6 8.2 pN for the two-filament model
(mean 6SD). This ’100-fold increase in force occurs even though the potential inter-filament interactions in the multi-filament model increase only 24 times.
Relative force (ratio of predicted force to total myosin) adjusts for the relative number of potential interactions between models and is about 4-fold greater (¼100/24) in the multi-filament model (Figure 4A). The maximal relative force value predicted by the multi-filament model (’2 pN myosin1 at pCa 4, Figure 4A) lies in the range (’1–3 pN myosin1) estimated from experimental studies [25,34,35]. Isometric force measurements from single fibers set the low end of this value at 1–1.7 pN myosin1[34,35], depending upon temper-ature and estimated myosin binding (fxb). Rescaling the value of 1.4 pN per head [25] from single-molecule studies sets the upper end of this range at 2.8 pN myosin1. The predicted relative force values by the two-filament model (Figure 4A) are below this range. Furthermore, tensile stress (force per cross-sectional area) for the multi-filament model, 171 66 kPa, is also consistent with literature values (Table S1, see Methods section for calculated area ¼ 5,600 nm2). Collec-tively, these results suggest that the more physiological lattice geometry in the multi-filament model introduces a geometry-dependent increase in predicted force values, agreeing better with experimental force values than the two-filament model. Comparing relative force traces across multiple [Ca2þ] (Figure 4A) shows more variation in the two-filament model, even though these traces average 24 times as many simulation runs as multi-filament traces (see Methods section). Although the multi-filament traces show less relative variation in force level, these traces have occasional‘‘spikes’’not present in the two-filament traces due to increased two-filament averaging. Greater variation in the two-filament model results from a lower number of cross-bridge interactions between the filaments. Additionally, force-generating events are less frequent in the two-filament model, giving each of these events more influence on the force level.
Thin-filament activation does not depend on geometry differences between the two models (largely because this study does not examine cross-bridge feedback increasing thin-filament activation). Thin-filament activation contrasts with force production and cross-bridge binding, which both depend upon the coupled probability of myosin binding a proximal actin node with the probability of that actin node being activated by Ca2þ. The fraction of thin-filament sites Figure 2.Filament Mechanical Interactions
Figure 4.Transient Predictions
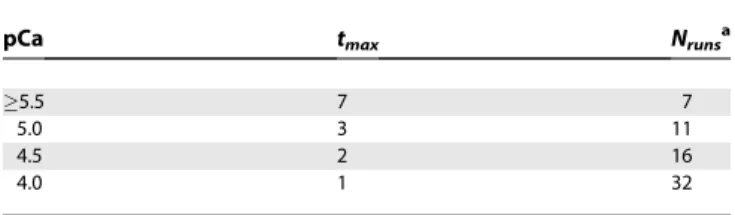
Temporal predictions of average relative force (A), fractional thin-filament nodes available to bind with myosin,fa(B), and fractional cross-bridge binding,fxb(C) for the multi-filament (black) and two-filament (green) models at pCa levels 4.0, 6.0, and 7.5 (pCa¼ log10[Ca2þ]). The number of simulations trials averaged to generate each trace (Nrunsor 24Nruns) is summarized in Table 3. Our standard mechanical parameters apply to these simulations:kxb¼5,ka¼5229, andkm¼6060 pN nm1.
doi:10.1371/journal.pcbi.0030115.g004
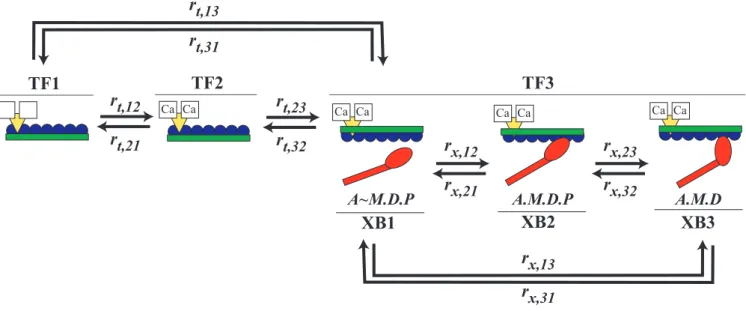
Figure 3.Kinetic Scheme
Model kinetic structure (using the same color scheme as Figure 1) shows coupled, three-state cycles for thin-filament activation and cross-bridge formation. Thin-filament states TF1, TF2, and TF3, represent no Ca2þbound to troponin, Ca2þbound to troponin, and Ca2þbound to troponin plus a
available to bind myosin (fa) is calculated from the number of actin nodes populating state TF3 divided by the total number of actin nodes. Magnitude and rate offaincrease with [Ca2þ] (Figure 4B), and maximal steady-statefa(pCa 4) for the multi-filament and two-multi-filament models is 0.9060.01 and 0.90 6 0.03, respectively. Given identical thin-filament activation kinetics in both models, with no influence of cooperative feedback between the kinetics of thin-filament activation and cross-bridge cycling in either model, we expect similar thin-filament activation dynamics. Stochastic variation in fa is slightly less in the multi-filament versus the two-filament model, likely because the increased number of actin nodes decreases the influence of any single actin node. For each model, variation in fa is smaller than variation in the corresponding force trace at a similar [Ca2þ]. This decreased variance in fa (compared with force) occurs because Ca2þ -binding kinetics assume a spatially homogeneous [Ca2þ] within the cell (in contrast to the spatial constraints of cross-bridge binding and force generation). Although these differences leading to thin-filament activation and force production may appear subtle, they demonstrate that spatially explicit implementation of thin-filament activation is critical for investigating the molecular mechanisms con-trolling force production.
Lower fractional myosin binding (fxb) in the two-filament model is not limited byfa, which implies differences in cross-bridge binding stem purely from geometry differences between the two models (Figure 4C). fxb is calculated from the sum of cross-bridges in states XB2 and XB3 divided by the total number of cross-bridges. Similar to force and fa, the
magnitude and rate of fxb increases with increasing [Ca2þ]. Maximumfxb(pCa 4) is 0.10160.002 and 0.01560.014 for the multi-filament and two-filament models, respectively. This predicted multi-filament value is near the low end of estimates [34–36], and stiffness properties of the lattice or kinetic feedback may augment this value (discussed below in detail).
Steady-State Behavior
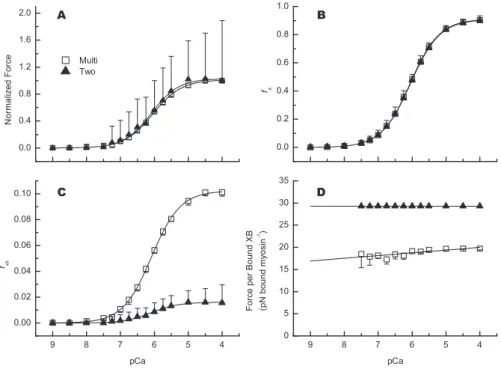
Steady-state predictions (mean6SD) for normalized force,
fa, and fxbover a range of [Ca2þ] (Figure 5A–5C) show little difference in Ca2þsensitivity between the two models (Tables 1 and S2; for calculations, see Methods section). As mentioned
above, the multi-filament model produces ’100 times the
maximal force with ’6 times the fxb as the two-filament model. While there appears to be more variation in force-pCa plots (Figure 5A, where force was normalized to the value at pCa 4 for each model) than in corresponding fxb-pCa plots (Figure 5C), this is a consequence of normalizing force
without changing fxb calculations from Figure 4. The
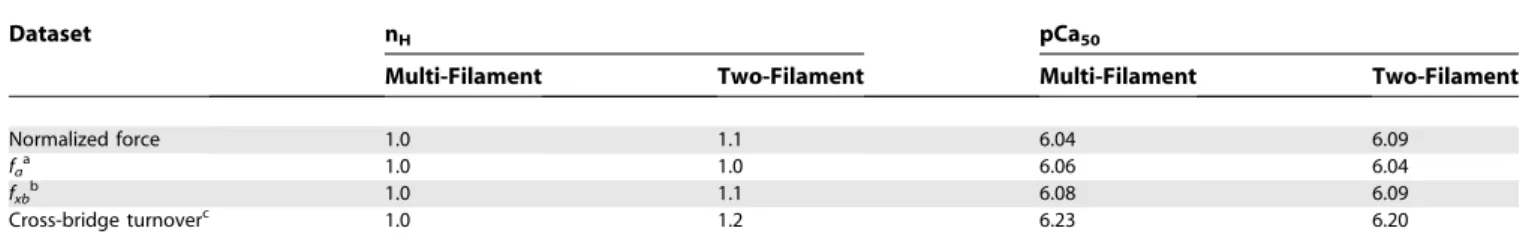
coefficients of variation between the force-pCa and fxb-pCa datasets within a given model are nearly identical. Sensitivity to Ca2þ (Table 1), is calculated by data fits to a three-parameter Hill equation using pCa as the independent variable (Equation 22). These values fornHare close to one, as expected in the absence of cooperative feedback between the kinetics of calcium binding to thin filaments and cross-bridge recruitment. The similarities between nH and pCa50 for steady-state force, fa, and fxb result from identical thin-filament kinetics between the two models (Figure 3, Table 2). Figure 5.Steady-State Predictions
Again this highlights that greater force andfxbin the multi-filament model result from a difference in geometry between the two models. Thus, sarcomere lattice structure introduces
a cooperative mechanism that is independent of Ca2þ
-mediated mechanisms.
To determine how model geometry affects the balance of force in each model, we calculated the ratio of steady-state force to number of attached myosin at all simulated [Ca2þ]. Average steady-state force per bound myosin (Figure 5D) is ’17 pN for the multi-filament model compared with’30 pN for the two-filament model. These predicted values (atkxb¼5 pN nm1) are greater than experimental estimates of’6–8 pN per attached myosin head [35,37], although multi-filament model predictions of force per bound myosin over a range of slightly more compliant kxbvalues are more consistent with these experimental estimates (discussed below in detail). These values (Figure 5D) are consistent with estimates for actomyosin rigor bonds [38–40], which may set an upper limit on possible force borne per attached myosin. Two-tailed bootstrap analysis [41] of these results (Figure 5D) indicates a significant slope (p , 0.05) for the multi-filament (¼0.56 pN Bound XB1pCa1) and two-filament models (8.0
3109pN Bound XB1pCa1). This slope is much larger for the multi-filament model, indicating an increase in force produced by a bound cross-bridge as [Ca2þ] increases. This Ca2þ-sensitive increase implies a coordination between cross-bridge binding and cycling in the multi-filament model that is not observed in the two-filament model.
Steady-state predictions of ATP consumption are greater for the multi-filament model than for the two-filament model for all [Ca2þ] (Figure 6A). Maximal ATP consumption (pCa 4)
in the multi-filament model is 3.9 6 0.2 ATP s1 myosin1 compared with 0.03 6 0.12 ATP s1 myosin1 in the two-filament model, ’135-fold difference. This multi-filament ATPase value agrees well with measured values from skeletal fibers (¼3.5 ATP s1myosin1; [42]). Parameter values for Hill-curve fits on these data show a slightly increased Ca2þ sensitivity (pCa50, Table 1) for ATP consumption compared with the mechanics predictions in Figure 5A–5C. Normalizing ATPase to the number of myosins directly compares the effect of lattice geometry on cross-bridge turnover rate. This indicates that the ’6-fold increase in cross-bridge binding (fxb) in the multi-filament model cooperatively enables’135 times the cross-bridge cycling. These results, coupled with the results from Daniel et al. [15], suggest that increased cross-bridge binding and turnover occurs through enhanced compliant realignment of filaments in the lattice. In contrast, low ATP consumption in the two-filament model suggests that cross-bridges are binding, and producing force, but cross-bridge turnover is less frequent. This implies that the two-filament model remains more static, while the multi-filament model exhibits more active realignment between filaments.
Steady-state tension cost, calculated from the quotient of ATP consumption and force, does not significantly differ between the two models at pCa 4 (multi-filament¼0.00416
0.0003 versus two-filament ¼ 0.0057 6 0.0436 ATP s1
myosin1pN1). Two-tailed bootstrap analysis [41] of tension cost indicates a small, but significant (p,0.05) slope in the tension cost-pCa relationship (0.001 ATP s1myosin1pN1) for the multi-filament model. A similar analysis of tension cost in the two-filament model yields no significant [Ca2þ] dependence. This result indicates similar mechanisms of individual cross-bridge cycling in each model. Specifically, if an individual cross-bridge binds in either model, it ultimately undergoes a similar range of distortions throughout the cycle.
Rate of Force Generation
The two models predict a nonlinear increase in the rate of force generation (rf) with increasing [Ca2þ] (calculated as discussed in the Methods section, [17]). Maximalrf(pCa 4.0) is 486 10 s1versus 596176 s1(mean6SD) for the multi-filament and two-multi-filament model, respectively. Importantly, the mean values ofrffor a given normalized force are similar for both models. This similarity suggests that individual cross-bridge binding kinetics depend on [Ca2þ] and force level, but Table 2.Thin-Filament Transition Rates
Equilibrium Transition Rate
K1¼
rt;12
rt;21¼10 5(M1)
rt,12¼53105(M1s1)
K2¼rtrt;;2332¼10 rt,23¼10 (s 1)
K3¼K1K12¼
rt;31
rt;13¼10
6(M) rt,
31¼5 (s1)
doi:10.1371/journal.pcbi.0030115.t0002
Table 1.Ca2þSensitivity for the Multi-Filament and Two-Filament Models
Dataset nH pCa50
Multi-Filament Two-Filament Multi-Filament Two-Filament
Normalized force 1.0 1.1 6.04 6.09
faa 1.0 1.0 6.06 6.04
fxbb 1.0 1.1 6.08 6.09
Cross-bridge turnoverc 1.0 1.2 6.23 6.20
Data are summarized by curve-fitting parameters (Equation 22) that indicate slope (nH) at half maximum (midpoint¼pCa50) for data shown in Figures 5 and 6. a
Fraction of actin nodes available to bind myosin (fa).
b
Fraction of bound cross-bridges (fxb).
c
1 ATP consumed per cross-bridge cycle (ATP s1
myosin1
are independent of model geometry. The nonlinear relation-ship between predicted rf values versus normalized steady-state force (Figure 7) is similar in shape to measured force redevelopment rates plotted against normalized steady-state force from single, demembranated muscle cell experiments [43–49]. The extraordinarily large SD in the two-filament model predictions follows from an exponential, as opposed to normal, frequency distribution in the set ofrfvalues.
Though the shape of therf-normalized force relationship is similar in both models, the stochastic variation in rf (error bars in Figure 7) is much less for the multi-filament (A) than the two-filament (B) model. This difference in variation
results from greater and more consistent cross-bridge bind-ing at the onset of contraction in the multi-filament model, which follows from a greater number of Ca2þ-activated actin nodes. For example, within the first few time steps of a simulation at pCa 4 in both models, roughly 50% of the actin nodes are available to bind with myosin (fa, Figure 4B). This initialfalevel creates a finite duration (’50 ms) when the thin filament is submaximally activated, leading to spatial inho-mogeneities of Ca2þ-activated regions along the thin filament, even at pCa 4. Building on results discussed above, the likelihood that these few Ca2þ-activated regions align with a proximal myosin is much greater in the multi-filament versus the two-filament model. Hence, variance in the distribution of initial Ca2þ-activated actin nodes being spatially available for immediate cross-bridge binding is much less for the multi-filament model. Moreover, any realignment of the multi-filaments following initial cross-bridge binding can increase the probability of additional cross-bridge binding by improving the alignment with these Ca2þ-activated regions of the thin filament. Thus, increased compliant realignment in the multi-filament model may also help reduce stochastic variation inrf through increased cross-bridge recruitment.
Mechanical Tuning of Myofilament Lattice Stiffness Maximizes Force Produced at Saturating [Ca2þ]
Myofilament stiffness values influence maximal predicted force (pCa¼4) in both models (Figure 8). To examine the coupling between filament stiffness and predicted force, we used two types of simulations. One set varied thin-filament stiffness (ka) and cross-bridge stiffness (kxb), while keeping thick-filament stiffness (km) fixed (Figure 8A and 8B). The other set of simulations simultaneously varied both thick- and thin-filament stiffness (kF) by a scalar factor (X), while co-varyingkxb(Figure 8C).
The approach used in the first set of simulations (varying only kaand kxb, Figure 8A and 8B) is consistent with prior unregulated models of contraction [15,17], which showed that stiffness of the filament lattice may be‘‘tuned’’to maximize predicted force. Generally, varyingkxbin both current models produces little force at the most compliantkxbvalues. Force
Figure 7.Rate of Force Generation (rf)
Averagerfplotted against normalized force, for the multi-filament (A, open square) and two-filament (B, black triangle) models, is calculated from a single, increasing exponential function ([17], and Methods section). Predictions are shown as mean6SD, using single-sided error bars along each axis. Error bars that are not visible lie within the symbol. Note the difference in scale on the ordinates.
doi:10.1371/journal.pcbi.0030115.g007
Figure 6.Steady-State Cross-Bridge Turnover
Average ATPase (one ATP per cross-bridge cycle) for the multi-filament (open square) and two-filament (black triangle) model is plotted against pCa. Predictions are shown as mean 6SD. When error bars are not visible, they reside within the symbol. Mechanical parameters forkxb,ka, andkmare the same as those listed in the legend of Figure 4. Solid lines represent least squares minimization of ATP consumption to a three-parameter Hill equation (Equation 22).
increases to a maximum ridge near moderatekxbvalues and then diminishes as kxbfurther increases. Note, however, the force dependence onkain the multi-filament model (Figure 8B), which forms an L-shaped ridge of maximum force that is not present in the two-filament model (Figure 8A). Addition-ally, force decreases at higherkaandkxbvalues in the multi-filament predictions (Figure 8B). This decrease differs from the results of Chase et al. [17], where predictions of force continue to rise over increasing values of ka and kxb. Our model produces results similar to those of Chase et al. [17] if we increase values ofkxb, but do not correspondingly decrease
xb0 (Equation 13). The contrast between the L-shaped
maximum force contour in the multi-filament model and the simple ridge of maximal force in the two-filament model likely follows from increased realignment between compliant filaments in the multi-filament lattice that leads to increased cross-bridge binding at greater kxb values. This increased range of myofilament stiffness values that produce high force levels in the multi-filament model demonstrates the influence of a cooperative mechanism arising solely from geometry differences between the two current models.
The second set of simulations variedkm,ka, and kxbin the multi-filament model to more fully examine how mechanical properties of the lattice affect force production. This expanded approach (compared with prior studies [15,17] as well as with Figure 8A and 8B) simultaneously varied both thick- and thin-filament stiffness (kF) by a scalar factor (X), while independently varying kxb. These simulation results show a plateau of high force across a range of stifferkxbvalues that extends from moderate to high kF values (Figure 8C). This elevated force plateau extends across the stiffest filament andkxbvalues (Figure 8C), and thus differs from the L-shaped ridge of elevated force when only ka varied (Figure 8B). Similar to Figure 8B, the maximal force contour occurs near parameter values that correspond with experimentally derived filament stiffness values [log10 X ¼ 0] [20–23]. However, there is a slight shift in position of the maximal contour between Figure 8B and 8C. Figure 8C also shows a clearly defined peak of maximal force, in contrast to the ridge of maximal force in simulations tuningkaindependently ofkm (Figure 8B).
Ca2þRegulation and Myofilament Stiffness Properties Influence Force, Cross-Bridge Binding, and Cross-Bridge Turnover
Multi-filament model predictions of steady-state force as a function of [Ca2þ], cross-bridge stiffness (kxb), and filament stiffness (kF) (uniformly varying both thick- and thin-filament stiffness as in Figure 8C) show that increasing [Ca2þ] increases force (Figure 9A–9F). Because the model contains no feed-back between crossbridge binding and thin-filament activa-tion (fa) kinetics, fais not affected by stiffness properties of the myofilament lattice (unpublished data). For allkxbvalues (Figure 9A–9F), there is similar shape to the surface of force produced over the full range of kF values. Force level is elevated at larger filament stiffness (kF) values and diminishes with more compliant filament values. Also, greaterkxbvalues produce a sharper decline in force as filament compliance increases (lower kF values). The maximal contour value of each plateau (across kxbvalues) occurs at kF values that are similar to experimentally measured values for thick- and thin-filament stiffness [log10X ¼ 0] [20–23]. However, the
Figure 8.Maximal Force Varies with Lattice Stiffness
Contour plots of average steady-state force at maximal Ca2þactivation
(pCa 4) across a range of mechanical lattice parameters are shown for the two-filament (A) and multi-filament (B,C) models. All simulation predictions adjustkxbover a range of [0.1–10] pN nm1, shown on the abscissa of each panel. Simulations adjustingkaandkxb, while keeping km fixed at 6,060 pN nm1were done for both models (A,B). These simulations adjustedkaover a four-decade range (with respect to the original value ofka) using a scalar multiplier,X, that ranged from [2 to 2] in log10space, represented on the ordinate of (A) and (B). (C), however, is a different type of simulation performed only with the multi-filament model. This second type of simulation simultaneously scales the stiffness of both thick and thin filaments (kF) from their original values, using a similar range ofXas (A) and (B). Colored-scale bars for force in pN are shown to the right of each panel; note the difference in scale between the two-filament predictions (A) and the multi-filament predictions (B,C). The maximum contour value (white solid circle) is 16, 963, and 933 pN for (A–C).
maximal force contour becomes more sharply defined with a peak that shifts slightly toward more compliantkFvalues at greaterkxbvalues (white dots in Figure 9A–9F). The maximal force value for each panel is moderate at compliantkxbvalues, increases to a maximum at kxb pN nm1 (Figure 9D), then slightly diminishes with increasingly stiffkxb.
Simulations suggest that the number of bound cross-bridges is not directly correlated with the level of force produced. Altering [Ca2þ], kF, andkxbresults in the greatest fractional cross-bridge binding (fxb) at lowestkxbvalues (Figure 9G–9L). This maximalfxblevel contrasts with force, which is minimal at lowestkxbvalues (Figure 9A–9F). There are general similarities between force production and fxb as [Ca2þ] and myofilament stiffness varies: 1) increased [Ca2þ] increases cross-bridge binding, 2) the maximal contour of each panel occurs at similarkFvalues (corresponding to measured values, [20–23]), and 3) the maximal contour width narrows with a shift in the peak (white dots) askxbincreases. In contrast to force predictions, a plateau of elevatedfxb(over a range ofkF values) exists only at more compliantkxb values (Figure 9G and 9H), and these plateaus narrow into ridges at greaterkxb values (Figure 9I–9L). Moreover,fxbconsistently declines with increasingkxbvalues, although force increases and stabilizes at a high magnitude with increasing kxbvalues. Examining the
complex correlation between fxb (Figure 9G–9L) and force (Figure 9A–9F) indicates that relatively small changes in these values can compound to produce larger shifts in estimates of average force borne per bound myosin.
Multi-filament model predictions suggest that cross-bridge turnover decreases with increasing cross-bridge stiffness (one ATP per cross-bridge cycle, Figure 9M–9R). Across all kxb values, with respect to any specifickFvalue, ATPase increases with increasing [Ca2þ]. In all panels (Figure 9M–9R), the maximal contour of cross-bridge turnover occurs at pCa 4 (white dots), and this maximum shifts toward more compliant filament values with decreasedkxb. Additionally, the peak of
the maximum contour becomes sharper as kxb increases.
These results, coupled with force (Figure 9A–9F) and fxb (Figure 9G–9L), illustrate how force production results from an interaction between mechanical properties of the lattice and kinetics of Ca2þ-regulated cross-bridge binding.
In summary, comparing results across the panels of Figure 9 show how muscle contraction depends on Ca2þ-regulated cross-bridge binding within a compliant myofilament lattice. The greatest ATP consumption (Figure 9M) and cross-bridge binding (Figure 9G) occur atkxb¼1pN nm1, akxbvalue that produces minimal levels of force (Figure 9A). Together, these results suggest that energy consumed at thiskxbvalue is used Figure 9.Steady-State Predictions Vary with Lattice Stiffness and [Ca2þ]
Contour plots of average steady-state predictions from the multi-filament model for force (A–F), fractional cross-bridge binding,fxb(G–L), and cross-bridge turnover (or ATP consumption, [M–R]) as a function of [Ca2þ],kxb, and filament stiffness,kF(simultaneously scaling both thick- and thin-filament stiffness usingXas in Figure 8C). Within each panel, values of pCa range from 9–4, whilekFvalues are identical to those in Figure 8C.kxbincreases from left to right across each column of panels as indicated (ranging from 1–15 pN nm1). Contour levels are specified by the color bar at the far right of each row. Areas appearing brown indicate regions where steady-state values exceed the upper limit of the color bar. The solid white circle in each panel corresponds to the maximum contour level, not a single maximum point in pCa-log10XkFkxbspace. The maximum force contour for (A–F) is 683, 766, 897, 949, 885, and 940 pN. Maximal fractional binding is 0.24, 0.18, 0.17, 0.16, 0.14, and 0.13 for (G–L), and maximal ATP consumption is 14.4, 8.57, 6.81, 5.89, 4.58, and 3.74 ATP s1myosin1for (M–R).
to stretch out the filaments, increasing both realignment between compliant filaments and cross-bridge cycling, rather than producing force. On the other extreme, wherekxb¼15 pN nm1, there is a high magnitude of force (Figure 9F), very little ATP consumption (Figure 9R), and minimal cross-bridge binding (Figure 9L), which largely follows from little compliant realignment in the more rigid filament lattice. At
intermediate kxb values, there is a transition between
compliant realignment in the filament lattice that coordi-nates force production versus myosin binding. Comparing all panels in Figure 9 indicates that an optimal lattice stiffness leads to a high ratio of force to ATP consumption (one metric of the energetic consequences of contraction) atkxb¼3–7 pN nm1, near physiological filament stiffness values (log10X¼0).
Discussion
This study investigated the effect of sarcomere lattice geometry on thin-filament activation, cross-bridge binding, force production, and ATP utilization by comparing two spatially explicit, Ca2þ-regulated, compliant myofilament models of muscle contraction. The multi-filament model incorporated the physiological ratio of filaments (2–thin:1– thick) in a hexagonal lattice similar to vertebrate striated muscle, while the two-filament model employed a single thin and thick filament. Both models used identical rate functions for thin-filament and cross-bridge kinetics, and neither model incorporated any cooperative feedback between cross-bridge binding and thin-filament activation. The multi-filament model predicts greater force production, cross-bridge recruitment, and cross-bridge turnover with less stochastic variation relative to the two-filament model. These increases are larger than ascribed by the greater number of potential filament interactions in the multi-filament model. Multi-filament model predictions agree better with exper-imental muscle force and ATPase measurements than two-filament predictions (Table S1), indicating that models including a more physiological representation of sarcomere lattice structure may better analyze the underlying mecha-nisms responsible for muscle contraction.
Our model geometry produces a filament network repre-senting myosin molecules that directly face thin filaments at hexagonal vertices of the lattice. These geometrical assump-tions collapse the three-dimensionality of the system, permitting a linear system of equations to represent filament sliding and force generation in one dimension. This mathematical implementation requires some modifications from known muscle ultrastructure. For example, the thick-filament geometry differs somewhat from vertebrate striated muscle (see the Methods section and Figures S1–S4), and cross-bridge formation in muscle can involve additional degrees of freedom not explicitly addressed by this study (three-dimensional mobility of myosin heads, radial thick-and filament spacing, thick-and rotation or torsion of the thin-filament helices). Other groups are developing three-dimen-sional models to simulate contraction [50]. However, this study focuses on thick- and thin-filament interactions along the axial direction of the sarcomere lattice and investigates the effect of geometry on two coupled, spatial processes (thin-filament activation and cross-bridge binding) that are important modulators of contraction.
Two central results emerged from this study. First, the ratio
and arrangement of thick and thin filaments influences contractile dynamics. Second, contraction depends on an inseparable coupling between geometry, kinetics, and me-chanical (stiffness) properties of the myofilament lattice. Interestingly, increases in force production and cross-bridge turnover in the multi-filament versus two-filament model
were greater (.100-fold) than the increased number of
possible inter-filament interactions resulting from differ-ences in model geometry (24-fold). This indicates a mecha-nism of cooperative cross-bridge binding that depends on geometry of the myofilament lattice (Figures 4 and 5). The greater force and cross-bridge turnover in the multi-filament model is likely associated with greater realignment within the compliant filament lattice via an increased number of cross-bridge interactions. These findings present a possible con-sequence of lattice structure in all muscle systems, where variation in the ratio and ultrastructural organization of thick and thin filaments may enhance contractile perform-ance for the given function across different muscle types.
The inseparable coupling between geometry, kinetics, and mechanical (stiffness) properties of the myofilament lattice suggests that spatial, kinetic, or mechanical aspects of muscle function cannot be considered individually when examining muscle performance. This finding follows from simulations co-varying myofilament compliance within two spatial net-works while maintaining identical model kinetics (Figures 8 and 9). Importantly, predictions of maximal force occurred at myofilament compliance values near those reported exper-imentally [20–23]. Together, these two broad findings demonstrate that future studies examining mechanisms of contraction should consider coupling between: spatial be-havior of thin-filament regulatory proteins, position and load-dependent cross-bridge cycling, compliant myofila-ments, and sarcomere lattice geometry.
Myofilament Compliance Influences Myosin Force Production and Energy Utilization
Varying the stiffness of cross-bridges and myofilaments alters the relative partitioning of mechanical energy, con-tributing in part to the behaviors observed in Figure 8. Several molecular phenomena contribute to the tuning observed in these force surfaces as compliance is varied at maximal [Ca2þ]. The key difference between these simulations is the ridge of high force seen in Figure 8B where thin- (ka) and thick- (km) filament stiffness vary independently. This ridge contrasts with the high force plateau for simulations in which ka and km co-varied (Figure 8C). These simulations suggest that the chemical energy imparted to cross-bridges from ATP hydrolysis is manifest as mechanical energy in the forms of force and deformation within the filament lattice. Thus, for a given amount of energy, some is partitioned as forces transmitted throughout the lattice, and some is partitioned to distortions within the lattice.
relative to filament stiffness, there is decreased cross-bridge deformation and increased force production. These changes occur through coordinated cross-bridge binding that main-tains strain in the filament lattice. Further increasing cross-bridge stiffness forms a ridge of high force as ka and km approach the same order of magnitude (when log10X¼0 for ka) by favorably partitioning energy into both force and lattice distortion (Figure 8A and 8B). This ridge falls off as thin filaments become very stiff in comparison with thick filaments (when log10X . 0 for ka in Figure 8A and 8B), because energy is partitioned primarily into thick-filament distortion. Indeed, this also explains development of the high-force plateau when uniformly scaling both ka and km (Figure 8C), in contrast to the high force ridge when changing
kaalone (Figure 8B).
Two other molecular processes also contribute to the steady-state tuning behaviors; these are recruitment of cross-bridges and their state transitions. As previously reported [15,17], the portion of mechanical energy manifest as lattice distortions alters the position of thin-filament binding sites, thus contributing to an increased probability of cross-bridge attachment. However, high lattice compliance leads to mechanical energy being partitioned almost completely to distortion, and produces little force. Herein lies the crucial tradeoff: distortion allows greater cross-bridge recruitment, but simultaneously decreases the fraction of energy parti-tioned to force that is distributed throughout the lattice.
Energy partitioned to lattice deformation controls another crucial feedback mechanism associated with kinetic state
transitions. As shown in Figure 10 and in prior studies [3,4,15], the probability of state transitions depends strongly on cross-bridge distortion. Thus, energy imparted to the compliant filament lattice from cross-bridges causes defor-mation which, in turn, results in cross-bridge distortion. In contrast, cross-bridge binding in an infinitely stiff lattice will have all of the strain-dependent mechanical energy appear as force and none as filament deformation. In this latter situation, all cross-bridges behave independently, with no feedback between bridges to influence additional cross-bridge binding or cycling. Importantly, the mechanism of cross-bridge–induced cross-bridge recruitment requires ex-tensible myofilaments and can only be modeled via spatially explicit methods.
Cross-bridge compliance also contributes to cross-bridge recruitment. Chemical energy from ATP hydrolysis is trans-formed into mechanical energy in the cross-bridge regardless of stiffness (kxb). However,kxbaffects the likelihood of a cross-bridge finding an actin site as well as the amount of deformation following binding. This restricts stiffer cross-bridges to bind at nearer sites on the thin filament and may produce higher forces even though distortions will be less. In contrast, a more flexible cross-bridge can bind to more distant regions of the thin filament. These examples illustrate how energy partitioning depends on the stiffness of both filaments and cross-bridges. Thus, smaller deformations associated with stiffer cross-bridges limit additional recruit-ment of other stiff cross-bridges because they too must be Figure 10.Free Energy and Transition Rate Profiles
Position-dependent free energy differences (A) and transition rates (B–D) between cross-bridge states (see Figure 3) are shown forkxb¼5 pN nm1. The coordinate along the abscissa of each panel,x, represents the position difference between a particular pair of actin and myosin nodes associated with cross-bridge formation (Equation 9).
(A) Horizontal lines give free energies of detached states (XB1), with the difference between the two horizontal lines representing the standard free energy drop over a full cross-bridge cycle (DG(x), Equation 8).DG(x) is used to define the minimum in each parabolic free energy wellG2(x) andG3(x) (representing bound states XB2 and XB3).
near binding sites, and less compliant realignment of binding sites occurs in a stiffer lattice (Figure 9G–9L).
Lattice compliance also contributes to the ATP utilization associated with cross-bridge cycling (Figure 9M–9R). Simu-lations that varied myofilament compliance result in high force, moderate cross-bridge binding, and moderate ATP consumption near physiological values ofkaandkmover akxb range of 3–7 pN nm1. Increasing filament or cross-bridge stiffness shows that force remains high with reduced cross-bridge binding and cycling (Figure 9). On the other hand, if the lattice becomes increasingly compliant, minimal force is produced with high ATP consumption. This suggests that an intermediate level of lattice compliance, near physiological values [20–23], optimizes coordinated cross-bridge binding and cycling via compliant realignment of the filament lattice while producing a high level of force with a lower ATP cost.
Myofilament Lattice Geometry Amplifies Compliant Realignment of Cross-Bridge Binding Sites
Crossbridge–induced crossbridge recruitment results in greater force production and ATPase through realignment of myosin binding sites on compliant thin filaments [15,17]. This effect is amplified by the geometry of the multi-filament (versus the two-filament) model, which more closely reflects the ratio of thick to thin filaments in muscle. Moreover, the augmented force, cross-bridge recruitment, and cross-bridge turnover is larger than would be predicted simply from the greater number of potential interfilament interactions in the multi-filament model. Thus, a cooperative mechanism of contraction arises solely from differences in sarcomere lattice structure.
Even though individual cross-bridges have identical model kinetics, the ensemble average of cross-bridge behavior differs between models (Figures 5–7). The ratio of ATP utilization to force produced is similar between models, which suggests that any single cross-bridge cycle (in either model) preserves the partition of energy from ATP into lattice distortion and force production. Despite this sim-ilarity, the force per bound cross-bridge in the multi-filament model is about 40% less than that in the two-filament model (Figure 5D). This likely results from a decrease in the mean distortion of a bound cross-bridge moving through its cycle in the multi-filament model. The decreased mean distortion may result from increased realignment in the multi-filament lattice, which contributes to a decreased force borne by a cross-bridge through the lifetime of a cycle. Alternatively, the increased realignment between filaments in the multi-filament model could enhance coordination between cross-bridges, leading to increased rates of turnover or shifting the temporal distribution of the cycle toward less distorted conformations. Currently, we cannot determine the relative influence from each of these possible mechanisms, as both are intimately coupled given the model kinetics. In any event, the lower force per cross-bridge in the multi-filament model indicates that cross-bridges spend less time in highly distorted configurations and that sarcomere lattice geometry also influences kinetic behavior of cross-bridges.
Model Geometry Does Not Affect Ca2þRegulation in the Absence of Kinetic Feedback
The component of force generation that is solely a consequence of Ca2þ activation of the thin filament is not
influenced by sarcomere lattice structure (Figures 4 and 5). A spatially explicit model of regulatory proteins in a system of compliant filaments is an important component of the spatial–temporal coupling between thin-filament activation and cross-bridge binding. Additionally, coupling these two spatial processes is essential to describe the Ca2þ-dependent amplitude and rate of force development (Figures 4–7). Two important features of the multi-filament model permit investigating contractile dynamics as a function of [Ca2þ] (compared with previous models [15, 17]): 1) thin-filament kinetics represent Ca2þbinding with and dissociating from troponin, interactions between troponin subunits, and move-ment of tropomyosin, and 2) these activation kinetics are spatially explicit to represent regulatory characteristics of troponin and tropomyosin along the thin filament. These advances introduce a platform to investigate spatial and kinetic molecular mechanisms of cooperativity that may contribute to contraction [11,12,15,27–29].
The current simulations demonstrate a form of coopera-tive contraction resulting from sarcomere lattice geometry in a system of compliant filaments, but additional forms of cooperativity may result from feedback by cross-bridges or thin-filament regulatory proteins on Ca2þ activation or tropomyosin mobility [12,27,29,51,52]. One example of this kinetic feedback may be coordinated movement between adjacent tropomyosin molecules following Ca2þbinding with troponin, which activates a region of thin filament greater than the 37 nm length of a single tropomyosin molecule [29]. The similarity of Ca2þ sensitivity (pCa
50) between thin-filament activation, cross-bridge binding, force production, and ATPase in the current models (Table 1) is likely to diverge with cross-bridge and thin-filament–dependent
co-operative feedback mechanisms on Ca2þ activation, as
preliminary work suggests [30–32]. Whether or not any form of kinetic cooperativity is considered in future models of muscle contraction, our results show that the structural determinants of cooperative cross-bridge binding will always play a crucial role in force generation.
Methods
This study focuses on two Ca2þ-regulated, spatially explicit models of muscle contraction. Defined above, the multi-filament model consists of four thick filaments and eight thin filaments (Figure 1A). Multiple thick and thin filaments interact in a hexagonal lattice similar to vertebrate striated muscle [53,54]. The two-filament model is a reduced version of the multi-filament model, where myosin molecules and actin monomers only interact along a single plane [15]. Although the simulations discussed in this paper use isometric conditions, half-sarcomere length (¼1.2lm) and filament overlap are controlled variables, similar to previous models [15,17].
Geometry. A central assumption restricts interactions between
filaments to prescribed regions along thick and thin filaments that directly face each other. This constraint provides a mathematical accounting that enables multiple filaments to interact and reduces a three-dimensional, nonlinear problem into one-dimensional, linear system. These regions of potential interaction represent myosin molecules along thick filaments or myosin binding sites on actin along thin filaments. Dividing these regions into a set of mathemat-ical structures, called nodes, provides a basis of points along the filaments about which forces balance and motions occur.
interact with six different thin filaments while each thin filament interacts with three different thick filaments. The second property is a toroidal boundary condition along the longitudinal axis of the half-sarcomere. Employing this boundary condition at the cross-sectional edges of our simulation wraps each edge onto its opposite edge (Figure 1A). This boundary condition removes any inhomogeneities near the edge of our simulation by eliminating any longitudinal simulation boundary and preserves the 2–thin:1–thick filament ratio within a finite simulation volume. The simple lattice structure depicted in Figure 1A represents myosin filaments coaxially spaced at 40 nm [53]. Thus, the interactions simulated in the multi-filament model represent an 80 (¼2340) nm by 70 (¼2340cos(p/6) ) nm cross-section of infinite lattice space using only four thick filaments and eight thin filaments.
Vertebrate thick-filament structure has three-myosins extending from the filament backbone every 14.3 nm in relaxed muscle (myosin layer lines) [53,55]. Our model preserves this physiological spacing between myosin layer lines along the thick filament, producing a similar number of myosins that can potentially bind actin (¼120 multi-filament versus 150 per half-sarcomere length thick filament in vertebrates). Modeled thick filaments (Figures 1 and 2) are 858 nm long and consist of 60 myosin nodes and one node at the M-line to permit position control [17]. Myosin nodes represent myosin layer lines, and the resting, unstrained length between adjacent myosin nodes (m0) is 14.3 nm. Two myosins extend radially from the filament
backbone at each node to form a two-start helix, rotatingp/ 3 radians everym0. This thick-filament geometry produces six rows of myosin
that project from the center of the thick filament with an overall periodicity of 42.9 nm for the filament. Each row of myosin projects toward a different thin filament. Additional geometric comparisons of different lattice structures are provided in Figures S1–S4.
Each thin filament is 1,119 nm long, containing a total of 90 actin nodes distributed along two entwined actin strands and one node at the Z-line for position control (Figures 1 and 2). Each actin strand has a helical pitch identical to vertebrate striated muscle [¼pradians every 37.3 nm, 53]. Actin nodes along each strand are separated by 24.8 nm and rotated by 2p / 3 radians, at rest. The actin nodes represent target binding sites for myosin and provide a spatially explicit accounting for the regulatory proteins to control Ca2þ -sensitive activation along the thin filament. Similar to physiological thin-filament structure, these two entwined actin strands oppose each other bypradians. We translate the initial node on one strand by 12.4 nm relative to the initial node on the complementary strand, making the nodes rotationally translated by 4p/ 3 radians (¼pþp/ 3; initial offset plus rotation accompanying the 12.4-nm translation). This accounting creates a coiled thin filament where the resting length between adjacent actin nodes (a0) is 12.4 nm and distributes the 90
actin nodes along three rows (spaced every 37.3 nm along each row). Each row of thin-filament nodes directly faces three different thick filaments.
Controlling thick- and thin-filament interactions via [Ca2þ] with
spatial characteristics of regulatory proteins is a fundamental advancement from previous spatially explicit models [14–18]. The spatial and temporal effects of troponin and tropomyosin are explicitly accounted for in the sections describing model geometry and kinetics. As above, the two actin strands provide a basis for modeling Ca2þ-activated regions of the thin filament. The spatially explicit model parameter Tmspan represents the influence of
tropomyosin by setting the range of adjacent Ca2þ-influenced regions
along each actin strand, effectively determining the number of adjacent actin nodes (i.e., thin-filament length) available for myosin binding.Tmspan represents the effective distance over which Ca2þ
binding with troponin facilitates tropomyosin movement—activating thin-filament regions where myosin can bind to actin.Tmspanwas set
at 37 nm in this study, making two adjacent actin nodes along an actin strand available to bind myosin. The first region influenced by
Tmspanbegins with the first actin node on each strand, making the
following region along each strand influence the next two actin nodes on that strand. This accounting scheme continues along the entire thin filament. While preliminary studies [32] variedTmspanto explore
how cooperative mechanisms of thin-filament Ca2þactivation may contribute to force generation [29], this study fixesTmspanto focus
solely on the consequences of different sarcomere lattice geometry between models.
Mechanics.Mechanics describing simulated force use a system of
linear springs (Figure 2) and balance forces at each node in the filament lattice [15,17]. As mentioned above, we model filament sliding and force generation along the longitudinal axis of the half-sarcomere. This assumption collapses the model into a linear system of equations comprising a vector of actin and myosin node positions
(X), a matrix of spring constants (K), and a vector of boundary conditions (V). Solving the instantaneous force balance
X¼K1V ð1Þ
through Gaussian elimination allows us to calculateXgiven known cross-bridge binding conditions throughout the filament network. Individual entries toKandVresult from decomposing Equation 1 into spring constants, rest lengths, and boundary conditions at the filament ends. As with previous models, we also assume that viscous and inertial forces are negligible [15,17,18].
We assign three spring constants,km,ka, andkxbto the elements
between thick-filament nodes, between thin-filament nodes, and between thick and thin filaments following myosin binding to actin (representing the cross-bridge), respectively (Figure 2). Consistent with the earlier two-filament model [15],kmis;1.4 times greater than ka(¼65 pN nm1for 1-lm filament length) [20–23]. Most simulations
in this study setkmandkaat 6,060 and 5,229 pN nm1to maintain
measured filament stiffness values between myosin nodes and actin nodes (for rest lengthsm0anda0). Also, most simulations in this study
use a kxb of 5 pN nm1. Although this kxb value is greater than
estimates from single molecule measurements, 0.69–1.3 pN nm1 [25,56], it is closer to estimates of 3–5 pN nm1from muscle fiber measurements [34–37]. Usingkxb¼1pN nm1in previous models and
in this study resulted in relatively low predicted force (compared with
kxb¼5 pN nm1[15, 17], Figures 8 and 9), suggesting that a parameter
value of 5 pN nm1better estimatesk
xbthan 1 pN nm1. We recognize
that kxb is a fundamental myosin property contributing to the
chemomechanical energy transduction and force produced in muscle. Therefore, running a large number of simulations charac-terized the effect ofkxbon predicted force, fractional myosin binding
(fxb), and cross-bridge turnover (Figure 9). This approach illustrates
howkxbinfluences simulations across the range of estimated values
(1–5 pN) listed above, while recognizing the variability and difficulty associated with exactly specifying this parameter value. The resting distortion of a myosin cross-bridge (xb0) is directly linked to kxb
(Equation 13), and no stiffness parameters (km,ka, orkxb) depend on
[Ca2þ] as suggested by Isambert et al. [19].
The instantaneous sum of forces at each actin or myosin node in the network is zero, independent of any actomyosin binding. As described above, the system of linear equations describing this force balance uses spring constant and position information between all connected nodes. Force development and any corresponding realign-ment in the filarealign-ment network may distort the distance between nodes from specified rest lengths. Generally, each term in the equations below (Equations 2–4) contributes to the force balance as a Hookean spring element of stiffness km, ka, or kxb with a distortion from
corresponding rest lengthm0,a0, orxb0. As further described below, xb0(Equation 13) represents the unbound rest length where myosin
S1 heads (assuming coincident behavior of the two S1 heads per modeled myosin molecule) position is offset from its corresponding myosin node. The balance of forces about myosin node at positionmj
oriented to bind with co-linear facing actin node at position ai
(depicted in Figure 2):
kmðmjþ1mjm0Þ kmðmjmj1m0Þ þkxbðaimjxb0Þ ¼0; ð2Þ wheremj1andmjþ1represent the position of myosin nodes adjacent
tomjalong the thick filament. Equation 2 is written for a coordinate
system defining positive force to the right, such thatmj1,mj,mjþ1.
The first and second terms of Equation 2 balance forces along the thick filament, while the third term accounts for the interaction between thick and thin filaments associated with cross-bridge formation. If there is no cross-bridge binding, the third term disappears from Equation 2 (kxb¼0). A similar balance of forces
occurs about the actin nodes at positionaiandak(Figure 2, where ai1,aiþ1,ak1, andakþ1are positions of actin nodes adjacent toaiand akalong each respective thin filament:
kaðaiþ1aia0Þ kaðaiai1a0Þ kxbðaimjxb0Þ ¼0 ð3Þ
kaðakþ1kia0Þ kaðkiak1a0Þ ¼0 ð4Þ
Following any cross-bridge binding in the network, forces balance throughout the lattice causing myofilaments to deform or realign. Any local distortion and node realignment in the system affects the balance of force throughout the entire network.
Force per filament is calculated using distortion (difference from rest length) in the spring element nearest the Z- or M-line (Dxi). Total
summing over the number of filaments in parallel at the ends of our half-sarcomere simulation:
FZline¼ X8
i¼1
kaDxi ð5Þ
and
FMline¼ X4
i¼1
kmDxi; ð6Þ
whereFZ-line¼ FM-line.
Kinetics.Model kinetics (Figure 3) use a three-state cross-bridge
cycle coupled with a three-state, [Ca2þ]-sensitive, thin-filament
regulatory cycle (Figure 3). Cross-bridge kinetics are distortion-dependent, as with previous models [1,3,4,10,15,17,57]. The kinetics of each bridge depends upon the behavior of all other cross-bridges through coupled interactions within the compliant filament lattice [15]. While more complete chemomechanical descriptions of cross-bridge cycling would require an increased number of bio-chemical states [3,4,6,10], we continue using a three-state cross-bridge model to directly compare with earlier modeling efforts [15,17].
Previous models suggest that a minimum of three mechanical states is required to characterize actomyosin binding and force production [15,17]: an unbound or weakly bound, nonforce-bearing state (XB1), a state where myosin binds to actin in a conformation preceding the mechanical transition, often referred to as the powerstroke (XB2), and a state where myosin is bound to actin in a conformation following the powerstroke (XB3) (Figure 3). The pre-powerstroke state (XB2) should contribute less force to the myofilament lattice than the post-powerstroke state (XB3), similar to the two-attached states outlined by Eisenberg et al. [3]. However, the actual force borne by any cross-bridge (¼kxb(aimjxb0) (in Equation 2 or Equation 3, see
Figure 2) depends on its distortion from rest length.
Concomitant with each mechanical state is a biochemical state representing the cyclical hydrolysis of ATP, release of inorganic phosphate (Pi) and ADP, and binding of another ATP that leads to
dissociation of myosin from actin Figure 3. These states represent a collapsed version of larger biochemical schemes [6]. The nonforce-bearing state (XB1) corresponds to a biochemical state where myosin binds the ATP hydrolysis products ADP and Piand is unbound or
weakly bound to actin. In the pre-powerstroke state (XB2), the actomyosin complex is formed with myosin having ADP and Pi
bound. While it remains debated whether Pi is released before,
concurrent with, or following the powerstroke, the post-powerstroke state (XB3) represents an actomyosin conformation where myosin has released Piand only ADP is bound [6,58–62]. The transition back to
the nonforce-bearing state entails myosin releasing ADP, binding ATP, and dissociating from actin.
Cross-bridge elasticity [1] imposes position-dependent transition rates throughout the cross-bridge cycle. Elastic sliding between filaments creates either a positive or negative force exerted by the cross-bridge and depends upon cross-bridge distortion [3]. Consis-tently, the current state transitions intimately couple distortion of a myosin molecule with filament realignment throughout the lattice (Figure 10). While the thermodynamic and kinetic parameters describing cross-bridge cycling in the model are exactly the same for each myosin, the geometry and mechanical coupling between myosins and filaments does not allow myosin molecules to function independently [15]. The specific functions defining cross-bridge free energies and transition rates are presented below.
Biochemical and structural studies demonstrate that both spatial and temporal thin-filament processes regulate actomyosin binding [7]. Thin-filament regulation results from interactions between Ca2þ
binding to troponin, and subsequent movement of tropomyosin exposing myosin binding sites on actin to allow cross-bridge cycling [63]. A structural regulatory unit spans 37.3 nm along each actin strand of thin filaments, containing one troponin and tropomyosin that covers seven actin monomers. Thus, Ca2þ binding to each troponin will expose only a local region of myosin binding sites along each actin strand in proximity to the troponin complex. The coupled mechanical and structural properties of myofilaments further influence actomyosin binding along the filaments, where up to two myosin can potentially bind per 37.3 nm actin strand. Hence, the spatial and kinetic processes of thin-filament activation and cross-bridge cycling are inseparable.
Two key events underlying the thin-filament regulatory model are Ca2þ binding to troponin and the ensuing interaction between
troponin and tropomyosin (Figure 3). We simulate these events along each actin strand of the thin filament in conjunction withTmspam
(introduced above in the geometry section). This method directly links spatial and kinetic characteristics of troponin and tropomyosin to regulate actomyosin binding, which is unique to this model. While portions of the thin filament may be activated, whether any binding occurs depends on myosin proximity (Equation 15).
The thin-filament kinetic model (Figure 3) employs three states [51,63], with transition rates defined below (Table 2). In the first state (TF1), no Ca2þis bound to troponin and actin nodes are unavailable to bind cross-bridges. The second state (TF2) has Ca2þbound to
troponin, and actin nodes remain unavailable to bind cross-bridges. In the third state (TF3), Ca2þis bound to troponin and actin nodes
are available to bind with myosin. The equilibria-associated thin-filament state transitions (K1,K2, orK3) adhere to:
1¼K1K2K3 ð7Þ
maintaining thermodynamic stability [64]. Each equilibrium equals the ratio of forward (rt,ij) to reverse (rt,ji) thin-filament transition rates.
Two-filament model. The two-filament model in this study is a
subset of filament interactions from the multi-filament model. The simulations employ the same thick- and thin-filament geometry of the multi-filament model, but permit interactions between only one thick and one thin filament. Mathematically, this reduces the multi-filament model interaction to a single row of myosin and actin nodes that co-linearly face each other [15]. This results in fewer inter-filament interactions: 20 myosin nodes and 30 actin nodes. In all other regards (geometry, kinetics, and mechanics), the two-filament model is identical to the multi-filament model.
Implementation algorithm. All simulations were programmed
using Matlab (version 7.0, The Mathworks, http://www.mathworks. com). Monte Carlo simulations use a fixed time step (Dt) of 1 ms, and state transitions were accepted by comparingpij(¼rijDt) to a random
number generated from a uniform distribution [15,17]. Simulations evaluate kinetics at all actin and myosin nodes and calculate the resulting force balance at each time step. At each time step, the algorithm scans through each region of thin-filament activation (set byTmspan) using thin-filament kinetics and Monte Carlo methods to
determine the thin-filament state associated with each actin node. Following the thin-filament query, the algorithm scans through myosin nodes using Monte Carlo methods to determine cross-bridge state transitions based on cross-bridge kinetics, proximal actin node availability, and filament position. Finally, the program calculates the effects of these kinetic transitions on myofilament realignment to determine the position of all actin and myosin nodes to begin the next time step according to Equation 1.
Kinetic rates. The total free energy liberated over a complete
actomyosin cycle (DG) depends upon the standard free energy of ATP hydrolysis (DG0,ATP) and the concentration of ATP, ADP, and Pi
[3,4,34]:
DG¼ DG0;ATPln ½ ATP
½ADP½Pi ð8Þ
Similar to previous models [3,4,15,17], Equation 8 defines all free energies in units of RT, where R is the ideal gas constant and T is temperature in Kelvin.DG0,ATP¼13RT at 300K [4], and we set [ATP]¼
5 mM, [ADP]¼30lM, [Pi]¼3 mM, and T¼288K, which makesDG’
24RT. Free energies for the nonforce bearing (G1), pre-powerstroke
(G2), and post-powerstroke (G3) states depend on distance (x) and
cross-bridge stiffness (kxb,RT), in units of RT nm2(which converts to
pN nm1using an appropriate scale factor).xis calculated from the
position difference between a myosin node and its nearest available actin node. Using the example depicted in Figure 2 for myosin extending from myosin node at positionmjand binding to actin node
at positionai:
x¼aimj: ð9Þ
Following binding x determines cross-bridge distortion and consequently its contribution to the force balance (Equation 2,kxb(ai mjxb0)¼kxb(x–xb0)). Free energy functions define elastic behavior
in each cross-bridge state (Figure 10A):
G1ðxÞ ¼0; ð10Þ
G2ðxÞ ¼aDGþkxb;RTðxxb0Þ2; ð11Þ
G3ðxÞ ¼gDGþkxb;RTx2: ð12Þ
G1(x) arbitrarily sets the reference energy at 0 RT to begin an ATP