www.atmos-chem-phys.net/11/5745/2011/ doi:10.5194/acp-11-5745-2011
© Author(s) 2011. CC Attribution 3.0 License.
Chemistry
and Physics
Diurnally resolved particulate and VOC measurements at a rural
site: indication of significant biogenic secondary organic aerosol
formation
S. J. Sjostedt1,2, J. G. Slowik1,3, J. R. Brook2, R. Y.-W. Chang1, C. Mihele2, C. A. Stroud2, A. Vlasenko1,2, and
J. P. D. Abbatt1
1Department of Chemistry, University of Toronto, Toronto, ON, M5S 3H6, Canada 2Environment Canada, Science and Technology Branch, Toronto, ON, M3H 5T4, Canada 3Paul Scherrer Institut, Villigen, Switzerland
Received: 5 October 2010 – Published in Atmos. Chem. Phys. Discuss.: 11 November 2010 Revised: 25 May 2011 – Accepted: 31 May 2011 – Published: 21 June 2011
Abstract. We report simultaneous measurements of volatile
organic compound (VOC) mixing ratios including C6 to
C8aromatics, isoprene, monoterpenes, acetone and organic
aerosol mass loadings at a rural location in southwestern On-tario, Canada by Proton-Transfer-Reaction Mass Spectrom-etry (PTR-MS) and Aerosol Mass SpectromSpectrom-etry (AMS), re-spectively. During the three-week-long Border Air Quality and Meteorology Study in June–July 2007, air was sampled from a range of sources, including aged air from the polluted US Midwest, direct outflow from Detroit 50 km away, and clean air with higher biogenic input. After normalization to the diurnal profile of CO, a long-lived tracer, diurnal analyses show clear photochemical loss of reactive aromatics and pro-duction of oxygenated VOCs and secondary organic aerosol (SOA) during the daytime. Biogenic VOC mixing ratios increase during the daytime in accord with their light- and temperature-dependent sources. Long-lived species, such as hydrocarbon-like organic aerosol and benzene show little to no photochemical reactivity on this timescale. From the nor-malized diurnal profiles of VOCs, an estimate of OH con-centrations during the daytime, measured O3concentrations,
and laboratory SOA yields, we calculate integrated local or-ganic aerosol production amounts associated with each mea-sured SOA precursor. Under the assumption that biogenic precursors are uniformly distributed across the southwestern Ontario location, we conclude that such precursors contribute significantly to the total amount of SOA formation, even
dur-Correspondence to:S. J. Sjostedt ([email protected])
ing the period of Detroit outflow. The importance of aromatic precursors is more difficult to assess given that their sources are likely to be localized and thus of variable impact at the sampling location.
1 Introduction
Although ozone and particulate matter have been histori-cally viewed as two independent criteria for characterizing air quality, it is now recognized that there is a tight relation-ship between them. In particular, it is well known that ox-idation of volatile organic compounds (VOCs) leads to tro-pospheric ozone production. Under close scrutiny of late is the coupled role that photochemistry and VOCs play in the production of secondary organic aerosol (SOA) (Seinfeld and Pankow, 2003; Kroll and Seinfeld, 2008; de Gouw and Jimenez, 2009; Hallquist et al., 2009).
The oxidation of VOCs is initiated by reaction with atmo-spheric radicals, and by ozone in the case of olefins (Atkin-son and Arey, 2003). During the day the primary oxidant is the hydroxyl radical (OH) and, in the presence of sun-light and NOx the products go on to form ozone and
that of smaller ones. However, should the oxidation of the parent VOC ultimately lead to a substantial decrease in the vapor pressure and decomposition does not occur to a sizable degree, the products can then go into the condensed phase to form secondary organic aerosol (SOA) (Pankow, 1994). Formation of an oxygenated product of sufficiently low va-por pressure may require multiple generations of oxidation products. Whether the oxidation products ultimately end up as an aerosol depends on several factors such as the struc-ture of the parent compound, the composition of the aerosol and the NOx concentration. Low NOx environments may
be more conducive to SOA production due to the formation of low vapor pressure organic peroxides from reaction with HO2(Kroll and Seinfeld, 2008; de Gouw and Jimenez, 2009;
Hallquist et al., 2009). Also, note that SOA formation may occur in the aqueous phase via condensed-phase processes, such as those driven by carbonyl uptake.
To assess the degree of SOA formation via gas phase oxi-dation and subsequent condensation that might have occurred over a specific region a standard approach is to incorporate organic aerosol laboratory yields, i.e. the amount of SOA formed from a specific VOC precursor under a prescribed set of conditions in a large reaction chamber, into a chemical transport model that includes spatially resolved VOC emis-sion fluxes, gas-phase chemistry, horizontal and vertical air transport, gas and particle deposition, etc. (Chen et al., 2006; Kleeman et al., 2007; Murphy and Pandis, 2009). This ap-proach is taken in the paper by Stroud et al. (2011) that is part of this special issue, using Environment Canada’s AURAMS chemical transport model (Gong et al., 2003; Stroud et al., 2008; Makar et al., 2009).
Here, we present a novel measurement-based approach where we match the degree of chemical loss of diurnally av-eraged SOA precursors to the simultaneous measurement of oxygenated organic aerosol formation. This allows us to as-sess the degree to which the measured VOCs contribute to the total SOA formed locally. Carbon monoxide is used to normalize for dynamical effects, particularly associated with the changing height of the boundary layer (de Gouw et al., 2009). The advantage of this method is that both the VOC precursor and organic aerosol amounts are directly measured, without the need for an emissions model. The only external information required is the yield of SOA from specific VOC precursors and the rate constants for radical-driven loss of the VOCs, both of which can be taken from laboratory ex-periments described in the literature. Uncertainties to this approach are also important to point out, the most significant of which is that the measurements are from only one loca-tion whereas SOA formaloca-tion occurs over a wider geographic extent. For that reason, we emphasize that the SOA forma-tion rate calculaforma-tions are for just the observaforma-tion locaforma-tion; a chemical transport model is necessary to assess SOA forma-tion regionally.
To illustrate this analysis approach we use measurements taken during the Boundary Air Quality and Meteorology
Study (BAQS-Met), an air quality study during the sum-mer of 2007 involving Environment Canada, academic re-searchers, and the Ontario Ministry of the Environment. The overall goal of BAQS-Met was to evaluate the degree to which pollution in southwestern Ontario is influenced by long-range transport or formed locally, and by complex me-teorology that prevails across many areas due to the high fre-quency of lake breezes associated with the Great Lakes.
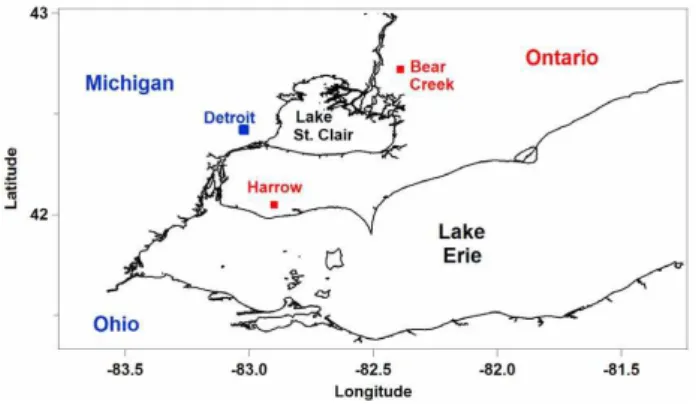
For this paper, a specific goal was to assess the relative de-gree to which different VOC precursors contributed to SOA formation at a rural location – Harrow, Ontario – using the analysis approach outlined above. Although VOCs of both biogenic and anthropogenic origin are known to be impor-tant in the formation of SOA, the magnitude of each con-tribution remains an open question (de Gouw et al., 2005, 2008; Heald et al., 2005; Volkamer et al., 2006; Kleinman et al., 2007). Past studies in polluted environments have had difficulty obtaining closure between the amount of SOA formed and that predicted by models. Agreement in biogenic regimes has been better of late (Capes et al., 2009; Slowik et al., 2010). Harrow provides a locale that is influenced by both local and regional biogenic sources and anthropogeni-cally impacted air that is photochemianthropogeni-cally fresh (when from Detroit, Michigan) and aged (when from the Ohio Valley). As such, we focus on the relative degree to which biogenic sources contribute to the local rates of SOA formation rela-tive to aromatic (i.e. anthropogenic) precursors for this loca-tion. Finally, we perform an initial comparison of our results to those from the AURAMS chemical transport model.
2 Experimental
2.1 BAQS-Met field campaign
Figure 1. Harrow, ON and the surrounding area
Fig. 1.Harrow, ON and the surrounding area.
2.2 Measurements
Volatile organic compounds (VOCs) levels were measured using a proton-transfer reaction mass spectrometer (PTR-MS) (Lindinger et al., 1998; de Gouw and Warneke, 2007) (Ionicon Analytik). In the PTR-MS, H3O+ ions generated
by a discharge in water vapor ionize trace gases that have a higher proton affinity than water. The resulting ions are de-tected with a quadrupole mass spectrometer. Because this soft ionization technique causes relatively little fragmenta-tion, measured mass-to-charge ratios can frequently be di-rectly related to the parent ion, and so VOCs can be iden-tified to some degree. Species with the same molecular weight, such as the xylenes and ethylbenzene cannot be dis-tinguished. The same is true with all the monoterpenes, and with methyl vinyl ketone and methacrolein, that yield signal at the same mass-to-charge ratio.
The PTR-MS was calibrated with a custom standard that contained, amongst other species: acetone, isoprene, methyl vinyl ketone, benzene, toluene, andα-pinene in the 500 ppbv range (Apel-Riemer Environmental Inc., USA). Species-dependent calibration factors and detection limits, along with the activated charcoal backgrounding method and sample line details, are described in detail elsewhere (Vlasenko et al., 2009). For this study the sample line inlet was at 3 m above the ground. The mass spectrometer was operated in full scan mode with data points collected across the full mass range (m/z21–160) every 140 s.
Please refer to Levy et al. (2010), which is part of this special issue, for details on the measurements of CO, O3, and
SO2. BTEX measurements from Windsor and Bear Creek
were analyzed using the methods from Wang et al. (2005). A compact time-of-flight aerosol mass spectrometer (C-ToF AMS, Aerodyne Inc., USA) measured the composition of the non-refractory component of submicron aerosol. The non-refractory component is empirically defined as species that are vaporizable over a roughly 1 s time interval at 870 K and 10−7torr. AMS operating principles are described else-where (Drewnick et al., 2005; Jayne et al., 2000; Jimenez
et al., 2003) while operation and analysis procedures during the present study are described in a paper in this special issue (Slowik et al., 2011).
2.3 PMF analysis of the organic aerosol mass spectra
Positive Matrix Factorization (Paatero and Tapper, 1994; Paatero, 1997) was applied to the organic aerosol mass spec-tral data using the PMF2 software package (P. Paatero, U. of Helsinki, Finland) in robust mode, together with the CU AMS PMF Tool (Ulbrich et al., 2009). Details of the PMF are given in Slowik et al. (2011). As described in that paper, the best PMF solution consisted of four factors, which we la-bel HOA (hydrocarbon-like organic aerosol), 1, OOA-2 (oxygenated organic aerosol, types 1 and OOA-2) and Factor 4. Briefly, the HOA factor is thought to arise from primary an-thropogenic emissions and has a mass spectrum characteris-tic of aliphacharacteris-tic hydrocarbons. The OOA-1 and OOA-2 fac-tors are more oxygenated; using the empirical relationship between the fraction of organic signal occurring at m/z44 (CO+2 ion) and the molecular O:C ratio derived by Aiken et al. (2008), we estimate O:C values of∼0.96 and∼0.50 for 1 and 2, respectively. The 1 and OOA-2 mass spectra are similar to those of low-volatility OOA (LV-OOA) and semivolatile OOA (SV-OOA), respectively (Jimenez et al., 2009). It is likely that OOA-1 represents the less volatile and more aged SOA fraction. Factor 4 (also referred to as the UNKN factor in Slowik et al., 2011), was only a minor component of the organic aerosol except at the end of the study, when winds shifted to a moderate, steady south/southwest flow. The CO+2 ion (m/z44) intensity con-stitutes only 0.01 of its spectrum, suggesting a low O:C ra-tio. This factor coincides with a period of high isoprene and low aromatics, suggesting a biogenic influence, and a sul-fate plume from Midwestern US locations. Taken together, these observations suggest the Factor 4 may be due to uptake of fresh biogenic VOCs onto preexisting sulfate aerosol or reactive uptake of isoprene, but we recognize this is highly speculative (see Slowik et al., 2011 and its interactive dis-cussion).
2.4 AURAMS model
2000 600 400 200 0 Benzene
6/23/2007 6/26/2007 6/29/2007 7/2/2007 7/5/2007 7/8/2007 7/11/2007 EDT 2000 1500 1000 500 0 C8 Aroma ti cs 1500 1000 500 0 Tolue n e
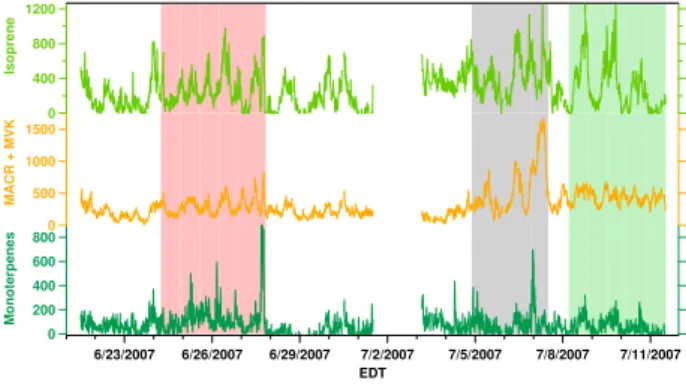
Figure 2. Aromatic VOC time series, as measured by the PTR-MS. Units are in pptv.
Fig. 2. Aromatic VOC time series, as measured by the PTR-MS.
Units are in pptv. Red, black and green shaded periods refers to different air mass episodes: Processed Air, Detroit Air, and Sulfate and Biogenic Air, respectively.
3 Results and discussion
3.1 Diurnal profiles for the full campaign
The full gas-phase data set has been broken down into three specific groups for analysis. Aromatics, which consists of benzene, toluene, and C8 aromatics (xylenes + ethyl
ben-zene), are species of anthropogenic origin with variable chemical lifetimes. Biogenics are comprised of relatively short-lived (i.e. lifetimes less than a day) chemicals directly emitted from foliage, such as the monoterpenes and isoprene as well as the 1st generation oxidation products of isoprene, methacrolein (MACR) and methyl vinyl ketone (MVK). The final group is comprised of acetone and ozone, which are relatively longer-lived oxygenates primarily produced pho-tochemically from the processing of both biogenic and an-thropogenic VOC precursors. To this group we add carbon monoxide (CO) as a tracer species that is longer lived than the above species and sulfur dioxide (SO2)as a primary
pol-lutant from industrial fossil fuel combustion. Time series of the mixing ratios of these species are in Figs. 2, 3 and 4.
The aerosol data have been divided into two subsets. The first delineates the sub-micron aerosol mass arising from organics and the inorganic species, sulfate (SO24−), nitrate (NO−3)and ammonium (NH+4). The second shows the or-ganic aerosol factors that have been derived from the PMF analysis. There are four factors that arise, as described in the previous section. These time series are in Fig. 5.
The measurements exhibit consistent diurnal profiles for both the gas phase species and aerosol composition. As is commonly recognized, such diurnal changes in observed val-ues can be attributed to both chemistry and dynamical ef-fects, such as changes in the boundary layer height that occur over the course of a 24 h day. To account as best as possi-ble for these dynamical effects, the diurnally averaged sig-nals for each species are normalized to CO, given that it is a long-lived chemical tracer. This technique is used widely,
800 600 400 200 0 Monoterpene s
6/23/2007 6/26/2007 6/29/2007 7/2/2007 7/5/2007 7/8/2007 7/11/2007 EDT 1200 800 400 0 Isopre n e 1500 1000 500 0
MACR + MVK
Figure 3. Biogenic VOC time series, as measured by the PTR-MS. Units are in pptv.
Fig. 3. Biogenic VOC time series, as measured by the PTR-MS.
Units are in pptv. Red, black and green shaded periods refers to different air mass episodes: Processed Air, Detroit Air, and Sulfate and Biogenic Air, respectively.
500
250
0
CO
6/23/2007 6/26/2007 6/29/2007 7/2/2007 7/5/2007 7/8/2007 7/11/2007 EDT 60 40 20 0 SO 2 80 60 40 20 0 Ozone 4 3 2 1 A c etone
Figure 4. Selected gas species time series. Acetone was measured by the PTR-MS,
Fig. 4.Selected gas species time series. Acetone was measured by the PTR-MS, whereas the others by standard air quality measure-ment instrumeasure-ments. Units are in ppbv. Red, black and green shaded periods refers to different air mass episodes: Processed Air, Detroit Air, and Sulfate and Biogenic Air, respectively.
25
20
15
10
5
0
A
e
ro
so
l com
p
o
s
ition
(
μ
g m
-3)
6/23/2007 6/26/2007 6/29/2007 7/2/2007 7/5/2007 7/8/2007 7/11/2007
EDT Organic
SO4
NO3
NH4 a)
10
8
6
4
2
0
PMF O
rganics (
μ
g m
-3 )
6/23/2007 6/26/2007 6/29/2007 7/2/2007 7/5/2007 7/8/2007 7/11/2007
EDT OOA 1 OOA 2 HOA Factor 4 b)
Figure 5. Time Series of AMS species in the upper frame. Factors from the Positive
Fig. 5. Time Series of AMS species in the upper frame. Factors
from the Positive Matrix Factorization of the AMS organics are shown in the lower frame. Red, black and green shaded periods refers to different air mass episodes: Processed Air, Detroit Air, and Sulfate and Biogenic Air, respectively.
for how normalization to CO affects the quantities presented in this paper, we present both data and calculations with and without CO normalization.
The diurnal profile of CO at Harrow during the study is shown in Fig. 6, where it is seen that mixing ratios rise throughout the night, indicative of relatively local emissions occurring into an increasingly shallow boundary layer. Dur-ing the time of afternoon heatDur-ing the mixDur-ing ratios are small-est due to mixing within a deeper boundary layer. (Note that for this diurnal profile, and for all others in the paper, we do a 21-point running average of all data, where the aver-age is the arithmetic mean.) We acknowledge that CO could be impacted by short episodes of high anthropogenic input and/or a diurnal profile in the rate of local CO production that can be of biogenic or anthropogenic origin. However, these effects are minimized by our location, which is largely removed from major local sources of pollution, and by aver-aging data across the full campaign period.
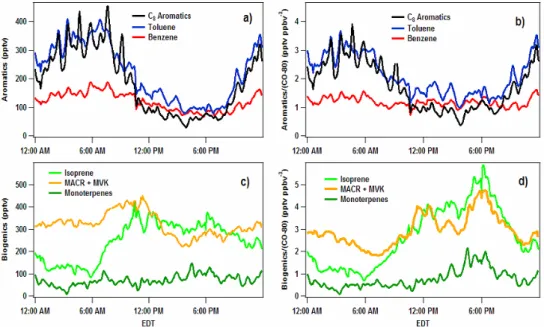
After CO normalization, the aromatics (Fig. 7) exhibit a consistent pre-dawn peak and, for toluene and the C8
species, an afternoon minimum that extends from about 12:00 to 19:00 EDT. Such a pattern is consistent with chem-ical species whose source is direct emission and whose pri-mary oxidant is the hydroxyl radical. After normalization, benzene mixing ratios remain constant throughout the day, consistent with the relatively long chemical lifetime of this species. Note that the flat diurnal profile for benzene pro-vides added support that the normalization to the CO diurnal variation is a justifiable approach for decoupling boundary layer mixing from chemical loss processes, for the primary anthropogenic VOCs at least.
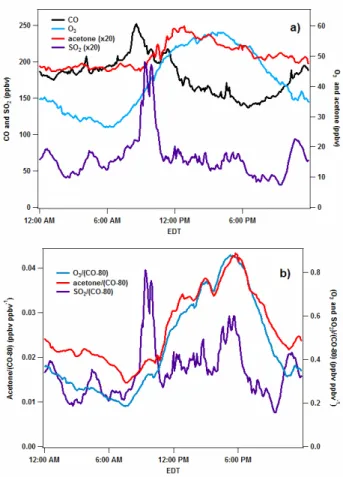
Figure 6. Diurnal profiles of selected trace gases, with (b) and without (a) norma
Fig. 6.Diurnal profiles of selected trace gases, with(b)and without
(a)normalization to CO less its regional background value.
Conversely, secondary chemical species that are formed from photochemistry such as acetone, ozone and PTR-MS formaldehyde (not shown) display an enhancement during the afternoon hours (see Fig. 6). The peak, with normaliza-tion to the boundary layer, is around 18:00 EDT. The diurnal profiles of acetone and ozone are quite similar to each other, indicating that both are photochemically produced and that both have relatively long chemical lifetimes. The biogenic species (isoprene and MVK/MACR) also peak in the late afternoon (Fig. 7). Qualitatively, the profiles are consistent with enhanced isoprene emissions during the day and with subsequent loss via reaction with OH, although the isoprene signals likely arise from more local emissions than those of the longer-lived oxidation products. It is somewhat surpris-ing that MVK/MACR does not peak after isoprene, perhaps due to transport effects, e.g. downward transport of these species during the day. The release of monoterpenes is de-pendent on temperature and thus the early evening maximum is likely due to local emissions and decreasing OH as the sun sets.
Figure 7. Diurnal profiles of aromatics (upper frames, a and b) and biogenic species
Fig. 7.Diurnal profiles of aromatics (upper frames,aandb) and biogenic species (lower frames,candd), without normalization to CO less its regional background value (left frames,aandc) and with normalization (right frames,bandd).
Figure 8. Diurnal profiles of AMS species (upper frames, a and b) and AMS organic
Fig. 8.Diurnal profiles of AMS species (upper frames,aandb) and AMS organic PMF factors (lower frames,candd), without normalization to CO less its regional background value (left frames,aandc) and with normalization (right frames,bandd).
of sites worldwide (Zhang et al., 2007). Of the remaining half of the particulate matter, the majority was contributed by sulfate followed by ammonium and nitrate. The organ-ics and sulfate displayed a prominent daytime enhancement, similar to that of O3and acetone, indicative of
photochem-ical formation of each species, whereas the nitrate profile was enhanced early in the morning and reached a minimum in the afternoon. The nitrate profile is likely affected by a
variety of factors, such as accumulation of HNO3 at night
arising from N2O5 hydrolysis and by low temperatures of
night that preferentially partition nitrate to particulates and the warm daytime temperatures which do not allow nitrate to persist. The sulfate afternoon maximum will be driven by photochemistry, arising from gas-phase oxidation of SO2to
form H2SO4, which either partitions to pre-existing particles
As described above, the organic aerosol fraction was bro-ken down into four factors by Positive Matrix Factorization. Briefly, HOA is representative of primary, hydrocarbon-like emissions, whereas OOA-1 and OOA-2 both represent oxi-dized organic aerosol, with the former more oxygenated than the latter. Factor 4 is associated with a significant fraction of the total organic mass only during the last three days of the campaign.
With diurnal analysis (Fig. 8), the normalized profiles show that the amounts of aerosol mass attributed to the two oxygenated factors and to Factor 4 rise in the afternoon when photochemistry is most active. OOA-1 reaches its peak value somewhat later than OOA-2, consistent with it aris-ing from oxidation of OOA-2 components and bearis-ing more oxidized. Both factors rise in value at the same time just before 12:00 EDT. Conversely, HOA remains relatively un-changed throughout the 24-h day, much like the long-lived aromatic species, benzene. We interpret this to indicate that the timescale for heterogeneous or photochemical oxidation of HOA chemical components into volatile products or into a more oxygenated factor is longer than a few hours.
3.2 Campaign episodes
Although this paper focuses primarily on the overall behavior observed during the BAQS campaign at Harrow, a variety of air mass types were prevalent during the full campaign. To demonstrate this, we illustrate three distinct periods (see shaded regions in Figs. 2 to 5). Please refer to Slowik et al. (2011) for an analysis of the nature and transformation of the organic aerosol during specific campaign periods.
The first period is from 06:00 EDT on 24 June until 16:00 EDT on 27 June, during which the acetone levels are es-pecially high while the C8 aromatics are not. Winds were
generally out of the southwest. Furthermore, the toluene-to-benzene ratio, a marker of photochemical aging (Roberts et al., 1984), is also low (mean value=1.4), indicative of photochemically processed air. In the aerosol phase, sulfate was the dominant species by mass, although substantial or-ganics were present. This period is referred to asProcessed Air, which we believe arrived from the US Midwest by pass-ing over Lake Erie without recent significant anthropogenic VOC input. In particular, the fetch from the north shore of Lake Erie is quite short, only a few km, to the observation site over farmland. Temperatures were also elevated with air flow from the south. During theProcessed Airperiod OOA1 was the largest organic PMF component, generally consis-tent with the view that OOA1 is indicative of highly aged, oxidatively processed air.
The second period, from midnight on 5 July until 12:00 EDT on 7 July, was dominated by winds out of the northwest, in the direction of Detroit. As such, this period is referred to asDetroit Air. In contrast to theProcessed Airthe aromatic mixing ratios reached their highest mixing ratios during this period. Also, the toluene to benzene ratio (mean=2.4) was
higher indicating that Harrow was influenced by fresher an-thropogenic emissions. In the aerosol phase the highest or-ganic mass loading occurred at this time and there was little sulfate. During the Detroit Air plume, the OOA2 factor, less oxygenated than OOA1, is more dominant, consistent with new SOA formation.
The final period, from 05:00 EDT on 8 July until the end of the campaign, looks similar to the processed air in that the toluene-to-benzene ratio is diminished (mean =1.4). This period is distinguished from theProcessed Airperiod by the extremely low aromatic signals and the enhanced mixing ra-tios of isoprene, which reached their peak values during this time. There is a steady wind flow from the southwest-west and the temperatures are high. As the sulfate levels are ele-vated at times, we refer to this period asSulfate and Biogenic Air, and we believe it is characterized by aged air to which fresh biogenic emissions have been injected. PMF Factor 4 is attributed to the majority of the organic aerosol mass during this period.
We now examine diurnal profiles of the selected time pe-riods. Whereas diurnal profiles for a full three week cam-paign are expected to give some average representation of the nature of the air at the site, we anticipate that average di-urnal profiles over short time periods of a few days will not be as smooth due to more prominent interference by specific events. Nevertheless, qualitatively, the results are expected to provide valuable insight into the atmospheric processes involved.
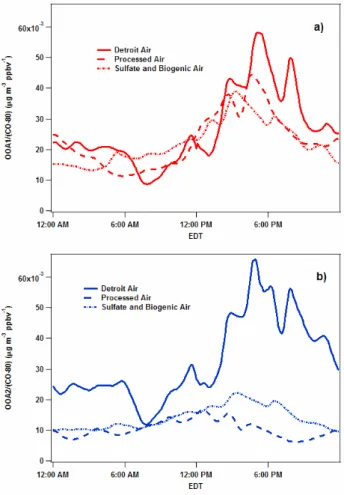
In particular, in Fig. 9, the diurnal profiles of the OOA-1 factor during these different episodes are all roughly the same, with similar timing and amounts of organic aerosol formed during the day. During theProcessed Airevent, the increase in OOA-1 levels is more than a factor of two higher than that of OOA-2 formed, whereas the amount of OOA-2 formation is similar to the amount of OOA-1 formation dur-ingDetroit Air. It appears as though there are similar levels of OOA-1 precursors (and oxidants) present in all the sam-pled air masses suggesting that OOA-1 formation occurs in a highly regional manner, whereas the levels of OOA-2 precur-sors are significantly enhanced during the polluted episode of Detroit Air. This is consistent with the higher levels of aromatics measured at that time, and perhaps unmeasured, semivolatile VOCs (Robinson et al., 2007), that are likely to also form OOA-2.
3.3 Relationship of VOCs to SOA formation
Figure 9. Diurnal profiles of CO-normalized AMS PMF factors during selected ep
Fig. 9.Diurnal profiles of CO-normalized AMS PMF factors during selected episodes of the campaign: OOA1-upper frame, OO2-lower frame.
overall campaign. Also, we present results for just the De-troit Airperiod.
Specifically, the approach we take is to calculate the inte-grated production rate of SOA (1SOA) due to OH oxidation according to:
1SOA= Z T
0
kVOC+OxidY[VOC][Oxidant]dt (1)
whereY is the yield of SOA from a specific VOC precur-sor,kVOC+Oxidis the gas-phase rate constant for reaction of
the VOC with either O3 or OH, [Oxidant] is either the OH
or O3concentration at timet, and [VOC] is the VOC
con-centration at timet. Appropriate unit conversions are per-formed so that1SOA is expressed in µg m−3. In practice
we approximate the integral of Eq. (1) as a summation, with time steps of 5 min. We recognize that the quantity1SOA represents the total production of SOA over a time periodT
under the assumption that the OH and VOC concentrations, and the SOA yield, are the same at locations upwind of the observation site, i.e. that the local production rate as calcu-lated by Eq. (1) at Harrow is constant over a spatial extent corresponding to the distance traveled by a gas-phase
pre-cursor during its chemical lifetime. While clearly a major assumption, we believe that uncertainties that may arise are diminished by the use of average diurnal behavior across the full campaign time period plus the fact that the environs close to Harrow are all similar, with small sections of forest inter-spersed amongst agricultural land. Thus, we expect that this assumption will be more valid for biogenic precursors that will have more spatially uniform emission sources. For aro-matics, however, where the sources will be more localized, greater uncertainties may arise. In particular, this approach does not account for very short-lived species that contribute to SOA formation upwind of Harrow but are not measured at the site. These issues are discussed in greater detail below.
We now discuss how each of the terms in Eq. (1) was ob-tained. First, the laboratory yields of SOA from a variety of VOC precursors have been studied extensively in numerous chamber experiments. For example, for the aromatics, stud-ies (e.g. Hurley et al., 2001; Jang and Kamens, 2001; Ng et al., 2007b; Hildebrandt et al., 2009) have measured yields with many showing high NOx levels leading to lower SOA
yields. Biogenic precursors have also been studied (e.g. Kroll et al., 2006; Ng et al., 2007a; Kleindienst et al., 2009) and a NOxdependence has also been observed in some cases. For
use in Eq. (1), we have chosen to use the following yields: (i) for the aromatics we take the two-product parameters from (Ng et al., 2007b) for high NOx conditions and the
mass-independent yields from the same paper for low NOx
condi-tions. Note that for the two-product cases, yields are assessed using the organic mass present at a specific time step in the summation, (ii) for isoprene, for high NOx, we use the
aver-age yield from Experiments 9, 11 and 12 in Kroll et al. (2006) given that the organic mass loading in those experiments is close to the average organic aerosol mass during BAQS. For low NOx, we take the two-product parameters from Henze
and Seinfeld (2006), and (iii) for the monoterpenes, we con-sider both OH oxidation and ozonolysis. For ozonolysis, we have employed the two-product parameters from Shilling et al. (2008). Note that we assume that α-pinene constitutes all of the PTR-MS monoterpene signal. Separating the con-tributions of ozone and hydroxyl radicals to SOA formation from monoterpenes in chamber studies is non trivial. In Ng et al. (2007a) the authors explicitly change OH sources from HOOH to HONO to examine the effect of NOx. This leads
to a low NOxSOA yield of 38 % and high NOxSOA yield of
7 % (Experiments 1 and 4 from Table 2 of Ng et al.). The au-thors acknowledge that in the low NOxexperiments 30 ppbv
of O3is formed and up to 35 % of the SOA observed during
peak formation may be attributable to ozonlysis. Even taking the contribution of ozone into account the yield of monoter-pene OH oxidation in a low NOxenvironment provides the
could lead to a higher SOA yield. We have decided to use the high NOxyield from Ng et al., and a 25 % low NOxyield
that takes into account the ozonolysis contribution.
Second, the gas-phase rate constant between OH and the VOC is taken directly from Atkinson et al. (2006), calcu-lated for the field temperature conditions. In the case of the C8aromatics, with the PTR-MS signal possibly arising from
the three different xylenes and also from ethyl benzene, we weight the rate constants for the four individual species by the typical relative mixing ratios for these species measured in tunnel emission studies (Schauer et al., 1999, 2002).
Third, the VOC concentrations are taken directly from the time-resolved, diurnally averaged VOC mixing ratios mea-sured at Harrow.
Finally, given that OH concentrations were not measured at Harrow, we estimate the amount of OH present near the observation site by following the approach published by de Gouw et al. (2009) who evaluated the average amount of OH present in Mexico City during the MILAGRO field cam-paign. We refer the reader to this paper for additional details. Briefly, noting that the loss of C8 aromatics and toluene is
due to OH chemistry, we use the following expression:
[Aromatic0] − [AromaticT]
[Aromatic0]
=A(1−exp(−kAromatic+OH[OH]est1t )) (2)
This expression is the integrated rate equation for loss of aro-matics due to OH chemistry over a time period1textending from an initial time 0 to timeT. The factorAtakes into ac-count that aromatics may be emitted locally during the day and are not lost to reaction with OH, i.e. the value ofAwould be unity if there were no local daytime emissions. Its value can be determined empirically by noting that the most reac-tive C8aromatics, i.e. the xylenes and ethyl benzene, reach
a steady minimum value early in the afternoon that extends through to early evening.
For this work, we estimate the average OH concentration,
[OH]est, that extends from 06:00 EDT to 18:00 EDT, corre-sponding to the total time over which there is loss of aromat-ics observed, i.e. the aromatic mixing ratios rise after 18:00 EDT due to decreasing OH and continued aromatic emis-sions. Thus, we setT=12 h. We choose theAfactor from the C8 aromatic time series, i.e. the most reactive
aromat-ics, as the minimum value within a five-hour window about 15:00 EDT. At this time, the aromatic mixing ratio is 0.28 of its starting value (i.e. as a one-hour average centered at 06:00 EDT), representing anAvalue of 0.72. The average OH con-centration was then calculated from Eq. (2) for both the C8
aromatic and the toluene data, yielding an average value of 3.6×10⁶molecules cm−3. Specifically, this is a measure of the average OH concentration at the Harrow site over the 12 h window from 06:00 EDT to 18:00 EDT. We do not believe this value is accurate to more than a factor of two given the uncertainties involved in its calculation. As an example, if
we choose, instead, theAfactor from the value for the C8
aromatics for a one-hour window around 18:00 EDT, i.e. the end period of the minimum plateau reached by the aromat-ics, we arrive instead at a value forA=0.61. In this case, the average OH concentration across the 12-h window is es-timated to be 6.7×10⁶molecules cm−3. On the other hand, we know that theAvalue is not unity. In particular, there certainly are local emissions of aromatics during the day be-cause the C8aromatic signal reaches its minimum value so
close to noon. If there were no local emissions, the PTR-MS signal for these species would continue to drop throughout the afternoon hours when OH concentrations are high.
To accurately implement Eq. (1), we require time resolved OH concentrations, whereas the above calculation yields only a 12-h average. To determine the average OH concen-trations in each 5-min interval we scale the time-resolved OH concentrations calculated from the averaged results of the AURAMS model that was run for the Harrow study time pe-riod to give the average concentration from the 06:00 EDT to 18:00 EDT time period that was determined above. A diurnal profile of OH concentration is shown in the Supplement.
The results from the calculation of the integrated and CO normalized SOA formation amounts during the entire cam-paign are presented in Table 1, where we include values under both high and low NOx conditions. Also included
in the table are the observed increases in the AMS organic aerosol amount from the same time period, as deduced from Fig. 8. In particular, we estimate the increase of organic aerosol amount by taking the difference between one hour averages about the minimum and maximum values observed diurnally. Finally, we include the contribution to the SOA that may arise from ozonolysis of monoterpenes calculated using Eq. (1) with measured ozone concentrations, and the appropriate rate constant (Atkinson et al., 2006) and labo-ratory secondary aerosol yields forα-pinene (Shilling et al., 2008), specifically, two-product fits for data with measured aerosol densities. We note that with no HO2measurements
at Harrow, it is difficult to determine whether SOA formation was proceeding in a high or low NOxregime. Specifically,
a key step in the reaction mechanism that leads to condens-able organics is thought to be the loss of the RO2radical that
is formed after initial OH attack on the VOC precursor and subsequent O2 addition. The RO2 species can react either
with peroxy radicals, principally HO2, or with NO. Without
HO2measurements, we include in Table 1 SOA formation by
OH oxidation under conditions of both high and low NOx, as
specified by the different yields measured in laboratory ex-periments.
Table 1.Calculated Contributions to Secondary Organic Aerosol Formation for the Full Campaign (all normalized to CO).
High NOx Low NOx
Calculated1Org Fraction of Calculated1Org Fraction of (µg m−3ppbv−1) Observed (%) (µg m−3ppbv−1) Observed (%)
Benzene-OH 9.3×10⁻⁵ 0.2 2.8×10⁻⁴ 0.5
Toluene-OH 4.1×10⁻⁴ 0.7 2.0×10⁻³ 3.3
C8Aromatics-OH 4.6×10⁻⁴ 0.8 3.2×10⁻³ 5.2
Calculated Total Aromatic1Org 9.6×10⁻⁴ 1.6 5.5×10⁻³ 9.0
Isoprene-OH 8.4×10⁻³ 13.8 7.2×10⁻³ 11.8
Monoterpenes-OH 6.0×10⁻³ 9.8 2.3×10⁻² 37.7
Monoterpenes-O3 7.3×10⁻³ 12.0 7.3×10⁻³ 11.9
Calculated Total Biogenic1Org 2.2×10⁻² 36.1 3.8×10⁻² 62.3
Calculated Total1Org 2.3×10⁻² 37.7 4.3×10⁻² 70.5
Measured1Org 6.1×10⁻²µg m−3ppbv−1
Table 2.Calculated Contributions to Secondary Organic Aerosol Formation for the Detroit Air period (all normalized to CO).
High NOx Low NOx
Calculated1Org Fraction of Calculated1Org Fraction of (µg m−3ppbv−1) Observed (%) (µg m−3ppbv−1) Observed (%)
Benzene-OH 2.7×10⁻⁴ 0.2 5.4×10⁻⁴ 0.4
Toluene-OH 1.1×10⁻³ 0.8 4.0×10⁻³ 3.1
C8Aromatics-OH 9.5×10⁻⁴ 0.7 5.1×10⁻³ 3.9
Calculated Total Aromatic1Org 2.3×10⁻³ 1.8 9.6×10⁻³ 7.4
Isoprene-OH 1.3×10⁻² 10.0 1.6×10⁻² 12.3
Monoterpenes-OH 5.6×10⁻³ 4.3 2.1×10⁻² 16.2
Monoterpenes-O3 4.8×10⁻³ 3.8 4.8×10⁻³ 3.7
Calculated Total Biogenic1Org 2.3×10⁻² 17.7 4.2×10⁻² 32.3
Calculated Total1Org 2.5×10⁻² 19.2 5.2×10⁻² 40.0
Measured1Org 1.3×10⁻¹µg m−3ppbv−1
From Table 1 it is clear that this approach predicts that the biogenic sources of SOA during the BAQS-Met study at Harrow dominate over the aromatic sources. In particu-lar, the source of the biogenics will be the dispersed forests amongst farmland that extend for hundreds of kilometers in southwestern Ontario. An important caveat is that there may be unidentified anthropogenic VOCs that act as SOA precur-sors as well, such as primary alkanes associated with trans-portation emissions, so in this work we can only compare the role of biogenics relative to aromatics measured by the PTR-MS, in terms of SOA formation capability.
We recognize that there are uncertainties in the absolute values of the SOA production values that need to be dis-cussed in detail. First, there are uncertainties in the OH val-ues as described above. Second, an assumption is that the VOC mixing ratios measured at Harrow are representative of those in the surrounding regions in which the daytime
Table 3.Calculated Contributions to Secondary Organic Aerosol Formation for the Full Campaign less the Detroit Air period (all normalized to CO).
High NOx Low NOx
Calculated1Org Fraction of Calculated1Org Fraction of (µg m−3ppbv−1) Observed (%) (µg m−3ppbv−1) Observed (%)
Benzene-OH 5.3×10⁻⁵ 0.1 1.7×10⁻⁴ 0.3
Toluene-OH 2.2×10⁻⁴ 0.4 1.2×10⁻³ 1.9
C8Aromatics-OH 2.7×10⁻⁴ 0.4 2.0×10⁻³ 3.1
Calculated Total Aromatic1Org 5.4×10⁻⁴ 0.8 3.4×10⁻³ 5.3
Isoprene-OH 4.5×10⁻³ 7.0 5.4×10⁻³ 8.5
Monoterpenes-OH 5.1×10⁻³ 6.4 2.0×10⁻² 31.3
Monoterpenes-O3 7.3×10⁻³ 11.4 7.3×10⁻³ 11.4
Calculated Total Biogenic1Org 1.7×10⁻² 26.5 3.3×10⁻² 51.6
Calculated Total1Org 1.8×10⁻² 28.1 3.7×10⁻² 57.8
Measured1Org 6.4×10⁻²µg m−3ppbv−1
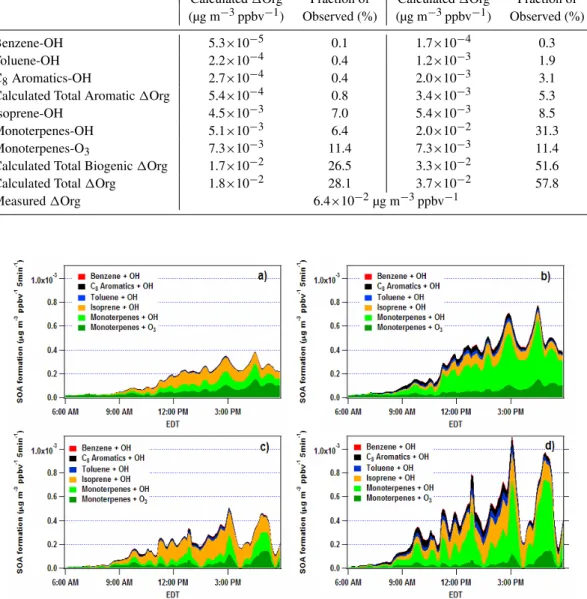
Fig. 10.Amounts of SOA formed per unit time and colored by precursor and oxidant, as calculated using the methods described in the text.
(a)Full campaign, high NOx,(b)full campaign, low NOx,(c)Detroit air, high NOx,(d)Detroit air, low NOx. All data have been normalized
to CO.
during the period ofDetroit Air. For the rural site Bear Creek to the northeast of Harrow, the measurements were on aver-age a factor of two lower, however. This suggests that in clean conditions, the role of the aromatics may be overesti-mated using the Harrow values, which may have higher local pollution sources or indirect input from nearby large urban sources.
Third, processes not addressed with this approach in-clude aerosol deposition during the time interval under study. However, aerosol depositional is apparently quite small given the flat diurnal profiles of the CO-normalized HOA PMF fac-tor. The flat diurnal profile indicates that there are no sub-stantial loss processes of particles containing HOA species, either chemical or depositional.
is decreased by roughly a factor of two, i.e. roughly 50 % less SOA is generated. This gives some indication of the sensi-tivity of the calculations to extreme episodes. Tables 2 and 3 provide a further estimate of this uncertainty, where the re-sults without and with theDetroit Airepisode are presented. It is seen that the time period without urban outflow is gen-erally similar to the full campaign results, with the degree of closure the same to within 60–70 % and the biogenics domi-nating as SOA precursors. It should be noted that the derived OH values used for Table 3, withoutDetroit Air, are attenu-ated by 15 % over the total campaign due to lower mean pre-dawn aromatic concentrations. As expected, duringDetroit Air, the relative importance of aromatic SOA is enhanced compared to the results whenDetroit airis excluded. Inter-estingly, the absolute amounts of biogenic SOA calculated to form are roughly the same during Detroit outflow as at other times.
Fifth, as with many models, we are only using the SOA yields from processes studied in traditional chamber exper-iments is occurring and we assume instantaneous formation of SOA after VOC loss. We are not accounting for SOA that might arise from multiphase processes such as carbonyl up-take processes that might occur on acidic particles.
Finally, to address the impact of vertical mixing and role of CO normalization in this regard, we present results in the Supplementary Information without CO normalization. It is seen that the relative contributions to SOA formation from the biogenics and aromatics remain generally unchanged. The absolute degree of closure of SOA formation amounts improves in high NOxscenarios without CO normalization
and in low NOxconditions exceeds the observed change in
organic mass. Note that without CO normalization, the diur-nal formation of SOA is not as pronounced. We consider the CO normalization approach to be a more accurate portrayal of the chemistry, however, given the degree to which it shows that relatively long lived species such as benzene and HOA are steady in amount throughout the day.
To gain an additional sense of the level of uncertainties involved, two more calculations are presented. In partic-ular, we also report the calculated and observed integrated formation rates of the sulfate aerosol species. We assume that the formation of sulfate in the afternoon proceeds via OH chemistry, specifically via the rate-limiting gas-phase re-action of SO2 with the OH radical. Indeed, the formation
rate of sulfate in the afternoon resembles that of organics which are presumably also forming via OH-driven processes. We are not addressing processing that may occur via clouds, which would not have the same diurnal profile. Once ulti-mately formed from this chemistry, gas-phase sulfuric acid condenses to form aerosol sulfate. This is clearly seen in Fig. 8 where the diurnal analysis indicates a large amount of sulfate production during the photochemically active day-time. Contrary to the organics where the VOC precursors are more uniform both spatially and temporally, SO2
mix-ing ratios are temporally variable due primarily to passage of
sporadic pollution plumes arising from power plants nearby, both in Ontario and the US Midwest. Part of the morning enhancement in SO2levels may be due to mixing from aloft
as the boundary layer breaks up in the morning.
Using the equivalent form of Eq. (1) but with the VOCs replaced by SO2 and with the appropriate gas-phase
rate constant (Sander, 2006), the calculated and observed sulfate integrated production rates are: 2.5×10⁻² and 6.2×10⁻²µg m−3ppbv−1, respectively. We assume that the yield, Y, is equal to unity, i.e. all sulfuric acid formed by SO2oxidation condenses to form AMS-measureable sulfate.
The agreement between the calculated and observed sulfate amounts is roughly a factor of two. If the higher estimate of the OH concentration offered above were used, then the level of agreement would be close to 100 %. We believe this degree of agreement provides a level of validation for the general approach that we present with regards to the estimate of OH levels and the CO normalization procedure, but it does not address the added factors that affect the yield of organic aerosol, related to its semi-volatile nature and that the yield depends on precursor, oxidation conditions, etc.
As a second evaluation, we performed very simple calcu-lations where we calculate the amount of SOA that would form, when accounting for yield, from the diurnal loss in the normalized aromatic mixing ratios displayed in Fig. 7. For the sum of all the aromatics, we find that the SOA formation amount is essentially the same, to within 4 %, as that calcu-lated with the more detailed approach presented in Table 1.
3.4 Comparison to predictions from an air quality
model
The approach we have presented for the calculation of SOA production amounts is empirically based, relying on simulta-neous measurements of VOCs and organic aerosol amounts, and literature values for VOC/oxidant rate constants and SOA yields. It is computationally simple, but has consid-erable uncertainties associated with it, as outlined above. By contrast, commonly used chemical transport models are highly complex, relying on coupled chemical, emissions and dynamics modules. Although such models are clearly the first choice for modeling organic aerosol formation across a regional domain, it is important that their output can be val-idated through detailed diagnostic evaluations, i.e. they need to be able to match observations and evaluations of relevant processes at a fixed site as we have done here.
To that end we compare diurnal profiles of AURAMS model predictions and the PTR-MS and AMS measurements at Harrow during BAQS. It is seen in Fig. 11 that the compar-ison for the gas-phase aromatics is good, especially for the reactive species toluene and the C8aromatics. On the other
Fig. 11.Diurnal profiles of measured (solid lines) aromatic(a)and biogenic species(b)compared to those from the AURAMS photo-chemical model (dashed lines).
OH levels within the model, (2) too low local biogenic emis-sions and/or (3) not enough vertical mixing at dusk and dawn in the model. Finally, the predicted levels of SOA formation during the day (i.e. the increase during the daytime hours) are somewhat lower than those observed at Harrow, likely because of insufficient biogenic SOA contributions (Fig. 12). While we point these differences out, detailed analysis of the source of these inconsistencies within the model are well out-side the scope of this paper. Overall, the degree of SOA clo-sure (i.e. to within roughly factors of two to three) from the simple approach presented in this paper is not dissimilar to that for the full chemical transport model.
4 Summary
In this paper we have applied a diurnal analysis approach to assess the role of different VOC precursors to the rates of SOA formation at a specific location, where the VOCs are measured by PTR-MS. Measurements were conducted at a rural site in southwestern Ontario subject to a wide variety of air masses during a three-week campaign near summer
8
6
4
2
0
A
e
rosol
M
a
ss
(
μ
g m
-3)
12:00 AM 6:00 AM 12:00 PM 6:00 PM EDT
Organics Sulfate Nitrate Organics (AURAMS) Sulfate (AURAMS) Nitrate (AURAMS)
Fig. 12. Comparison between diurnal profiles for AMS
measure-ments (solid lines) and AURAMS predictions (dotted lines).
solstice in 2007. A long-lived tracer, CO, is used to normal-ize for dynamical effects associated primarily with changing boundary layer height during the day. Integrated production rates of SOA are compared to observed values, as measured by the formation of organic aerosol measured with an AMS. The calculations suggest that biogenic precursors dominate SOA production over aromatic source gases at this site dur-ing the full campaign, consistent with continental observa-tions that indicate a large contribution from modern (versus fossil fuel) carbon to SOA (de Gouw and Jimenez, 2009). An important caveat to the relative importance of the biogenics is the possible role of SOA formation from aromatic precursors upwind of the observation site. In particular, by analyzing an individual time period when Detroit outflow was prevalent, we do indeed predict a more substantial role for the aromat-ics than when this period is excluded from the analysis. By performing analyses on the campaign withoutDetroit Airwe are able to emphasize the importance of biogenic precursors to the local formation rate of SOA at Harrow.
This simple analytic approach has important uncertainties arising from dilution/transport effects that may not be cap-tured by the CO normalization approach and errors in the estimated OH concentrations, as described in detail above. Nevertheless, even with these uncertainties, it is intriguing that the degree of SOA closure (i.e. between 38 and 71 % depending on high or low NOx conditions with CO
We propose that measurements of this type, that are now relatively standard (such as those by PTR-MS and AMS, and increasingly OH), could be performed at multiple sites across a region to determine the generality of diurnal pro-files observed at any one site. If similar, this straightforward approach for estimating secondary aerosol production rates would be validated and thus act as a valuable method for as-sessing chemical transport model predictions of SOA forma-tion across the same region.
Supplementary material related to this article is available online at:
http://www.atmos-chem-phys.net/11/5745/2011/
acp-11-5745-2011-supplement.pdf.
Acknowledgements. The authors acknowledge the help of G. Evans
and research group for housing the AMS in a mobile van during BAQS. Funding for this campaign came through the Ontario Min-istry of the Environment, Environment Canada and NSERC. We acknowledge Environment Canada’s NAPS program for the canis-ter measurements of BTEX species at Windsor and Bear Creek. We also want to thank Katherine Hayden and Milos Markovic for the use of their airborne CO and aerosol measurements, and Richard Leaitch for discussions.
Edited by: R. McLaren
References
Aiken, A. C., Decarlo, P. F., Kroll, J. H., Worsnop, D. R., Huff-man, J. A., Docherty, K. S., Ulbrich, I. M., Mohr, C., Kimmel, J. R., Sueper, D., Sun, Y., Zhang, Q., Trimborn, A., Northway, M., Ziemann, P. J., Canagaratna, M. R., Onasch, T. B., Alfarra, M. R., Prevot, A. S. H., Dommen, J., Duplissy, J., Metzger, A., Baltensperger, U., and Jimenez, J. L.: O/C and OM/OC ra-tios of primary, secondary, and ambient organic aerosols with high-resolution time-of-flight aerosol mass spectrometry, Envi-ron. Sci. Technol., 42, 4478–4485, 2008.
Atkinson, R. and Arey, J.: Gas-phase tropospheric chemistry of bio-genic volatile organic compounds: A review, Atmos. Environ., 37, S197–S219, 2003.
Atkinson, R., Baulch, D. L., Cox, R. A., Crowley, J. N., Hamp-son, R. F., Hynes, R. G., Jenkin, M. E., Rossi, M. J., Troe, J., and IUPAC Subcommittee: Evaluated kinetic and photochemi-cal data for atmospheric chemistry: Volume II – gas phase re-actions of organic species, Atmos. Chem. Phys., 6, 3625–4055, doi:10.5194/acp-6-3625-2006, 2006.
Capes, G., Murphy, J. G., Reeves, C. E., McQuaid, J. B., Hamil-ton, J. F., Hopkins, J. R., Crosier, J., Williams, P. I., and Coe, H.: Secondary organic aerosol from biogenic VOCs over West Africa during AMMA, Atmos. Chem. Phys., 9, 3841–3850, doi:10.5194/acp-9-3841-2009, 2009.
Chen, J. J., Mao, H. T., Talbot, R. W., and Griffin, R. J.: Application of the CACM and MPMPO modules using the CMAQ model for the eastern united states, J. Geophys. Res.-Atmos., 111, D23s25, doi:10.1029/2006jd007603, 2006.
de Gouw, J. and Jimenez, J. L.: Organic aerosols in the Earth’s atmosphere, Environ. Sci. Technol., 43, 7614–7618, 2009. de Gouw, J. and Warneke, C.: Measurements of volatile organic
compounds in the Earth’s atmosphere using proton-transfer-reaction mass spectrometry, Mass Spectrom. Rev., 26, 223–257, 2007.
de Gouw, J. A., Middlebrook, A. M., Warneke, C., Goldan, P. D., Kuster, W. C., Roberts, J. M., Fehsenfeld, F. C., Worsnop, D. R., Canagaratna, M. R., Pszenny, A. A. P., Keene, W. C., Marchewka, M., Bertman, S. B., and Bates, T. S.: Budget of organic carbon in a polluted atmosphere: Results from the New England air quality study in 2002, J. Geophys. Res.-Atmos., 110, D16305, doi:10.1029/2004jd005623, 2005.
de Gouw, J. A., Brock, C. A., Atlas, E. L., Bates, T. S., Fehsen-feld, F. C., Goldan, P. D., Holloway, J. S., Kuster, W. C., Lerner, B. M., Matthew, B. M., Middlebrook, A. M., Onasch, T. B., Peltier, R. E., Quinn, P. K., Senff, C. J., Stohl, A., Sullivan, A. P., Trainer, M., Warneke, C., Weber, R. J., and Williams, E. J.: Sources of particulate matter in the northeastern United States in summer: 1. Direct emissions and secondary formation of organic matter in urban plumes, J. Geophys. Res.-Atmos., 113, D08301, doi:10.1029/2007jd009243, 2008.
de Gouw, J. A., Welsh-Bon, D., Warneke, C., Kuster, W. C., Alexan-der, L., Baker, A. K., Beyersdorf, A. J., Blake, D. R., Cana-garatna, M., Celada, A. T., Huey, L. G., Junkermann, W., Onasch, T. B., Salcido, A., Sjostedt, S. J., Sullivan, A. P., Tanner, D. J., Vargas, O., Weber, R. J., Worsnop, D. R., Yu, X. Y., and Zaveri, R.: Emission and chemistry of organic carbon in the gas and aerosol phase at a sub-urban site near Mexico City in March 2006 during the MILAGRO study, Atmos. Chem. Phys., 9, 3425–3442, doi:10.5194/acp-9-3425-2009, 2009.
Drewnick, F., Hings, S. S., DeCarlo, P., Jayne, J. T., Gonin, M., Fuhrer, K., Weimer, S., Jimenez, J. L., Demerjian, K. L., Bor-rmann, S., and Worsnop, D. R.: A new time-of-flight aerosol mass spectrometer (ToF-AMS) – instrument description and first field deployment, Aerosol Sci. Technol., 39, 637–658, 2005. Gong, S. L., Barrie, L. A., Blanchet, J. P., von Salzen, K., Lohmann,
U., Lesins, G., Spacek, L., Zhang, L. M., Girard, E., Lin, H., Leaitch, R., Leighton, H., Chylek, P., and Huang, P.: Cana-dian aerosol module: A size-segregated simulation of atmo-spheric aerosol processes for climate and air quality models – 1. Module development, J. Geophys. Res.-Atmos., 108, 4007, doi:10.1029/2001jd002002, 2003.
Hallquist, M., Wenger, J. C., Baltensperger, U., Rudich, Y., Simp-son, D., Claeys, M., Dommen, J., Donahue, N. M., George, C., Goldstein, A. H., Hamilton, J. F., Herrmann, H., Hoff-mann, T., Iinuma, Y., Jang, M., Jenkin, M. E., Jimenez, J. L., Kiendler-Scharr, A., Maenhaut, W., McFiggans, G., Mentel, Th. F., Monod, A., Pr´evˆot, A. S. H., Seinfeld, J. H., Surratt, J. D., Szmigielski, R., and Wildt, J.: The formation, properties and impact of secondary organic aerosol: current and emerging is-sues, Atmos. Chem. Phys., 9, 5155–5236, doi:10.5194/acp-9-5155-2009, 2009.
1367–1378, doi:10.5194/acp-11-1367-2011, 2011.
Heald, C. L., Jacob, D. J., Park, R. J., Russell, L. M., Hue-bert, B. J., Seinfeld, J. H., Liao, H., and Weber, R. J.: A large organic aerosol source in the free troposphere miss-ing from current models, Geophys. Res. Lett., 32, L18809, doi:10.1029/2005gl023831, 2005.
Henze, D. K. and Seinfeld, J. H.: Global secondary organic aerosol from isoprene oxidation, Geophys. Res. Lett., 33, L09812, doi:10.1029/2006gl025976, 2006.
Hildebrandt, L., Donahue, N. M., and Pandis, S. N.: High forma-tion of secondary organic aerosol from the photo-oxidaforma-tion of toluene, Atmos. Chem. Phys., 9, 2973–2986, doi:10.5194/acp-9-2973-2009, 2009.
Hurley, M. D., Sokolov, O., Wallington, T. J., Takekawa, H., Kara-sawa, M., Klotz, B., Barnes, I., and Becker, K. H.: Organic aerosol formation during the atmospheric degradation of toluene, Environ. Sci. Technol., 35, 1358–1366, 2001.
Jang, M. S. and Kamens, R. M.: Characterization of secondary aerosol from the photooxidation of toluene in the presence of NOx and 1-propene, Environ. Sci. Technol., 35, 3626–3639,
2001.
Jayne, J. T., Leard, D. C., Zhang, X. F., Davidovits, P., Smith, K. A., Kolb, C. E., and Worsnop, D. R.: Development of an aerosol mass spectrometer for size and composition analysis of submi-cron particles, Aerosol Sci. Technol., 33, 49–70, 2000.
Jimenez, J. L., Jayne, J. T., Shi, Q., Kolb, C. E., Worsnop, D. R., Yourshaw, I., Seinfeld, J. H., Flagan, R. C., Zhang, X. F., Smith, K. A., Morris, J. W., and Davidovits, P.: Ambient aerosol sam-pling using the aerodyne aerosol mass spectrometer, J. Geophys. Res.-Atmos., 108, 8425, doi:10.1029/2001JD001213, 2003. Jimenez, J. L., Canagaratna, M. R., Donahue, N. M., Prevot, A. S.
H., Zhang, Q., Kroll, J. H., DeCarlo, P. F., Allan, J. D., Coe, H., Ng, N. L., Aiken, A. C., Docherty, K. S., Ulbrich, I. M., Grieshop, A. P., Robinson, A. L., Duplissy, J., Smith, J. D., Wil-son, K. R., Lanz, V. A., Hueglin, C., Sun, Y. L., Tian, J., Laak-sonen, A., Raatikainen, T., Rautiainen, J., Vaattovaara, P., Ehn, M., Kulmala, M., Tomlinson, J. M., Collins, D. R., Cubison, M. J., Dunlea, E. J., Huffman, J. A., Onasch, T. B., Alfarra, M. R., Williams, P. I., Bower, K., Kondo, Y., Schneider, J., Drewnick, F., Borrmann, S., Weimer, S., Demerjian, K., Salcedo, D., Cot-trell, L., Griffin, R., Takami, A., Miyoshi, T., Hatakeyama, S., Shimono, A., Sun, J. Y., Zhang, Y. M., Dzepina, K., Kimmel, J. R., Sueper, D., Jayne, J. T., Herndon, S. C., Trimborn, A. M., Williams, L. R., Wood, E. C., Middlebrook, A. M., Kolb, C. E., Baltensperger, U., and Worsnop, D. R.: Evolution of organic aerosols in the atmosphere, Science, 326, 1525–1529, doi:10.1126/science.1180353, 2009.
Kleeman, M. J., Ying, Q., Lu, J., Mysliwiec, M. J., Griffin, R. J., Chen, J. J., and Clegg, S.: Source apportionment of secondary organic aerosol during a severe photochemical smog episode, At-mos. Environ., 41, 576–591, 2007.
Kleindienst, T. E., Lewandowski, M., Offenberg, J. H., Jaoui, M., and Edney, E. O.: The formation of secondary organic aerosol from the isoprene + OH reaction in the absence of NOx,
At-mos. Chem. Phys., 9, 6541–6558, doi:10.5194/acp-9-6541-2009, 2009.
Kleinman, L. I., Daum, P. H., Lee, Y. N., Senum, G. I., Springston, S. R., Wang, J., Berkowitz, C., Hubbe, J., Zaveri, R. A., Brech-tel, F. J., Jayne, J., Onasch, T. B., and Worsnop, D.: Aircraft
observations of aerosol composition and ageing in new england and mid-atlantic states during the summer 2002 New England air quality study field campaign, J. Geophys. Res.-Atmos., 112, D09310, doi:10.1029/2006jd007786, 2007.
Kroll, J. H. and Seinfeld, J. H.: Chemistry of secondary organic aerosol: Formation and evolution of low-volatility organics in the atmosphere, Atmos. Environ., 42, 3593–3624, 2008. Kroll, J. H., Ng, N. L., Murphy, S. M., Flagan, R. C., and
Sein-feld, J. H.: Secondary organic aerosol formation from isoprene photooxidation, Environ. Sci. Technol., 40, 1869–1877, 2006. Levy, I., Makar, P. A., Sills, D., Zhang, J., Hayden, K. L., Mihele,
C., Narayan, J., Moran, M. D., Sjostedt, S., and Brook, J.: Un-raveling the complex local-scale flows influencing ozone patterns in the southern Great Lakes of North America, Atmos. Chem. Phys., 10, 10895–10915, doi:10.5194/acp-10-10895-2010, 2010. Li, Q. B., Jacob, D. J., Munger, J. W., Yantosca, R. M., and Parrish, D. D.: Export of noy from the north amer-ican boundary layer: Reconciling aircraft observations and global model budgets, J. Geophys. Res.-Atmos., 109, D02313, doi:10.1029/2003jd004086, 2004.
Lindinger, W., Hansel, A., and Jordan, A.: Proton-transfer-reaction mass spectrometry (PTR-MS): On-line monitoring of volatile or-ganic compounds at pptv levels, Chem. Soc. Rev., 27, 347–354, 1998.
Makar, P. A., Moran, M. D., Zheng, Q., Cousineau, S., Sassi, M., Duhamel, A., Besner, M., Davignon, D., Crevier, L.-P., and Bouchet, V. S.: Modelling the impacts of ammonia emissions reductions on North American air quality, Atmos. Chem. Phys., 9, 7183–7212, doi:10.5194/acp-9-7183-2009, 2009.
Murphy, B. N. and Pandis, S. N.: Simulating the formation of semivolatile primary and secondary organic aerosol in a regional chemical transport model, Environ. Sci. Technol., 43, 4722– 4728, 2009.
Ng, N. L., Chhabra, P. S., Chan, A. W. H., Surratt, J. D., Kroll, J. H., Kwan, A. J., McCabe, D. C., Wennberg, P. O., Sorooshian, A., Murphy, S. M., Dalleska, N. F., Flagan, R. C., and Seinfeld, J. H.: Effect of NOxlevel on secondary organic aerosol (SOA)
formation from the photooxidation of terpenes, Atmos. Chem. Phys., 7, 5159–5174, doi:10.5194/acp-7-5159-2007, 2007a. Ng, N. L., Kroll, J. H., Chan, A. W. H., Chhabra, P. S., Flagan,
R. C., and Seinfeld, J. H.: Secondary organic aerosol formation from m-xylene, toluene, and benzene, Atmos. Chem. Phys., 7, 3909–3922, doi:10.5194/acp-7-3909-2007, 2007b.
Paatero, P.: Least squares formulation of robust non-negative factor analysis, Chemometrics Intell. Lab. Syst., 37, 23–35, 1997. Paatero, P. and Tapper, U.: Positive matrix factorization - a
nonneg-ative factor model with optimal utilization of error-estimates of data values, Environmetrics, 5, 111–126, 1994.
Pankow, J. F.: An absorption-model of gas-particle partitioning of organic-compounds in the atmosphere, Atmos. Environ., 28, 185–188, 1994.
Parrish, D. D., Ryerson, T. B., Holloway, J. S., Neuman, J. A., Roberts, J. M., Williams, J., Stroud, C. A., Frost, G. J., Trainer, M., Hubler, G., Fehsenfeld, F. C., Flocke, F., and Weinheimer, A. J.: Fraction and composition of NOy
trans-ported in air masses lofted from the North American conti-nental boundary layer, J. Geophys. Res.-Atmos., 109, D09302, doi:10.1029/2003jd004226, 2004.
C., Albritton, D. L., and Sievers, R. E.: Measurements of aro-matic hydrocarbon ratios and NOxconcentrations in the rural
troposphere - observation of air-mass photochemical aging and NOxremoval, Atmos. Environ., 18, 2421–2432, 1984.
Robinson, A. L., Donahue, N. M., Shrivastava, M. K., Weitkamp, E. A., Sage, A. M., Grieshop, A. P., Lane, T. E., Pierce, J. R., and Pandis, S. N.: Rethinking organic aerosols: Semivolatile emissions and photochemical aging, Science, 315, 1259–1262, doi:10.1126/science.1133061, 2007.
Sander, S.: Chemical kinetics and photochemical data for use in atmospheric studies, Evaluation Number 15, NASA, JPL, 2006. Schauer, J. J., Kleeman, M. J., Cass, G. R., and Simoneit, B. R.
T.: Measurement of emissions from air pollution sources. 2. C1through C30 organic compounds from medium duty diesel
trucks, Environ. Sci. Technol., 33, 1578–1587, 1999.
Schauer, J. J., Kleeman, M. J., Cass, G. R., and Simoneit, B. R. T.: Measurement of emissions from air pollution sources. 5. C1 -C32organic compounds from gasoline-powered motor vehicles,
Environ. Sci. Technol., 36, 1169–1180, 2002.
Seinfeld, J. H. and Pankow, J. F.: Organic atmospheric particulate material, Annu. Rev. Phys. Chem., 54, 121–140, 2003.
Shilling, J. E., Chen, Q., King, S. M., Rosenoern, T., Kroll, J. H., Worsnop, D. R., McKinney, K. A., and Martin, S. T.: Par-ticle mass yield in secondary organic aerosol formed by the dark ozonolysis of α-pinene, Atmos. Chem. Phys., 8, 2073–2088, doi:10.5194/acp-8-2073-2008, 2008.
Slowik, J. G., Stroud, C., Bottenheim, J. W., Brickell, P. C., Chang, R. Y.-W., Liggio, J., Makar, P. A., Martin, R. V., Moran, M. D., Shantz, N. C., Sjostedt, S. J., van Donkelaar, A., Vlasenko, A., Wiebe, H. A., Xia, A. G., Zhang, J., Leaitch, W. R., and Ab-batt, J. P. D.: Characterization of a large biogenic secondary or-ganic aerosol event from eastern Canadian forests, Atmos. Chem. Phys., 10, 2825–2845, doi:10.5194/acp-10-2825-2010, 2010. Slowik, J. G., Brook, J., Chang, R. Y.-W., Evans, G. J., Hayden,
K., Jeong, C.-H., Li, S.-M., Liggio, J., Liu, P. S. K., McGuire, M., Mihele, C., Sjostedt, S., Vlasenko, A., and Abbatt, J. P. D.: Photochemical processing of organic aerosol at nearby continen-tal sites: contrast between urban plumes and regional aerosol, Atmos. Chem. Phys., 11, 2991–3006, doi:10.5194/acp-11-2991-2011, 2011.
Stroud, C. A., Morneau, G., Makar, P. A., Moran, M. D., Gong, W., Pabla, B., Zhang, J., Bouchet, V. S., Fox, D., Venkatesh, S., Wang, D., and Dann, T.: OH-reactivity of volatile organic com-pounds at urban and rural sites across canada: Evaluation of air quality model predictions using speciated VOC measurements, Atmos. Environ., 42, 7746–7756, 2008.
Stroud, C. A., Makar, P. A., Moran, M. D., Gong, W., Gong, S., Zhang, J., Hayden, K., Mihele, C., Brook, J. R., Abbatt, J. P. D., and Slowik, J. G.: Impact of model grid spacing on regional-and urban- scale air quality predictions of organic aerosol, At-mos. Chem. Phys., 11, 3107–3118, doi:10.5194/acp-11-3107-2011, 2011.
Ulbrich, I. M., Canagaratna, M. R., Zhang, Q., Worsnop, D. R., and Jimenez, J. L.: Interpretation of organic components from Posi-tive Matrix Factorization of aerosol mass spectrometric data, At-mos. Chem. Phys., 9, 2891–2918, doi:10.5194/acp-9-2891-2009, 2009.
Vlasenko, A., Slowik, J. G., Bottenheim, J. W., Brickell, P. C., Chang, R. Y. W., Macdonald, A. M., Shantz, N. C., Sjost-edt, S. J., Wiebe, H. A., Leaitch, W. R., and Abbatt, J. P. D.: Measurements of VOCs by proton transfer reaction mass spectrometry at a rural Ontario site: Sources and correlation to aerosol composition, J. Geophys. Res.-Atmos., 114, D21305, doi:10.1029/2009jd012025, 2009.
Volkamer, R., Jimenez, J. L., San Martini, F., Dzepina, K., Zhang, Q., Salcedo, D., Molina, L. T., Worsnop, D. R., and Molina, M. J.: Secondary organic aerosol formation from anthropogenic air pollution: Rapid and higher than expected, Geophys. Res. Lett., 33, L17811, doi:10.1029/2006GL026899, 2006.
Wang, D., Fuentes, J. D., Travers, D., Dann, T., and Connolly, T.: Non-methane hydrocarbons and carbonyls in the lower Fraser valley during Pacific 2001, Atmos. Environ., 39, 5261–5272, 2005.