ACPD
12, 29475–29533, 2012Formation of organic aerosol in the Paris
region
Q. J. Zhang et al.
Title Page
Abstract Introduction
Conclusions References
Tables Figures
◭ ◮
◭ ◮
Back Close
Full Screen / Esc
Printer-friendly Version Interactive Discussion
Discussion
P
a
per
|
Dis
cussion
P
a
per
|
Discussion
P
a
per
|
Discussio
n
P
a
per
|
Atmos. Chem. Phys. Discuss., 12, 29475–29533, 2012 www.atmos-chem-phys-discuss.net/12/29475/2012/ doi:10.5194/acpd-12-29475-2012
© Author(s) 2012. CC Attribution 3.0 License.
Atmospheric Chemistry and Physics Discussions
This discussion paper is/has been under review for the journal Atmospheric Chemistry and Physics (ACP). Please refer to the corresponding final paper in ACP if available.
Formation of organic aerosol in the Paris
region during the MEGAPOLI summer
campaign: evaluation of the
Volatility-Basis-Set approach within the
CHIMERE model
Q. J. Zhang1,13, M. Beekmann1, F. Drewnick2, F. Freutel2, J. Schneider2,
M. Crippa3, A. S. H. Pr ´ev ˆot1, U. Baltensperger3, L. Poulain4, A. Wiedensohler4, J. Sciare5, V. Gros5, A. Borbon1, A. Colomb1,6, V. Michoud1, J.-F. Doussin1, H. A. C. Denier van der Gon7, M. Haeffelin8, J.-C. Dupont8, G. Siour1,9, H. Petetin1,12, B. Bessagnet9, S. N. Pandis10, A. Hodzic11, O. Sanchez12, C. Honor ´e12, and O. Perrussel12
1
LISA/IPSL, Laboratoire Interuniversitaire des Syst `emes Atmosph ´eriques, CNRS, UMR7583, Universit ´e Paris Est Cr ´eteil (UPEC) et Universit ´e Paris Diderot (UPD), Cr ´eteil, France
2
Max Planck Institute for Chemistry, Particle Chemistry Department, Mainz, Germany
3
Paul Scherrer Institute, Villigen, Switzerland
4
ACPD
12, 29475–29533, 2012Formation of organic aerosol in the Paris
region
Q. J. Zhang et al.
Title Page
Abstract Introduction
Conclusions References
Tables Figures
◭ ◮
◭ ◮
Back Close
Full Screen / Esc
Printer-friendly Version Interactive Discussion
Discussion
P
a
per
|
Dis
cussion
P
a
per
|
Discussion
P
a
per
|
Discussio
n
P
a
per
|
5
Laboratoire des sciences du climat et de l’environnement, IPSL, CEA et l’Universit ´e de Versailles, CNRS, Saint-Quentin, France
6
Laboratoire de M ´et ´eorologie Physique, Clermont-Ferrand, France
7
TNO, Dept. Climate, Air and Sustainability, Utrecht, The Netherlands
8
IPSL, Ecole Polytechnique, INSU/CNRS l’Universit ´e de Versailles, Saint-Quentin,, France
9
Institut National de l’EnviRonnement industriel et des rISques, Verneuil en Halatte, France
10
Institut of Chemical Engineering Sciences, Foundation for Research and Technology, Hellas, Patras, Greece
11
National Center for Atmospheric Research, Boulder, USA
12
AIRPARIF, Agence de Surveillance de la qualit ´e de l’air, Paris, France
13
ARIA Technologies, Boulogne-Billancourt, France
Received: 17 October 2012 – Accepted: 31 October 2012 – Published: 15 November 2012 Correspondence to: Q. J. Zhang ([email protected])
ACPD
12, 29475–29533, 2012Formation of organic aerosol in the Paris
region
Q. J. Zhang et al.
Title Page
Abstract Introduction
Conclusions References
Tables Figures
◭ ◮
◭ ◮
Back Close
Full Screen / Esc
Printer-friendly Version Interactive Discussion
Discussion
P
a
per
|
Dis
cussion
P
a
per
|
Discussion
P
a
per
|
Discussio
n
P
a
per
|
Abstract
Results of the chemistry transport model CHIMERE are compared with the measure-ments performed during the MEGAPOLI summer campaign in the Greater Paris Region in July, 2009. The Volatility-Basis-Set approach (VBS) is implemented into this model, taking into account the volatility of primary organic aerosol (POA) and the chemical
ag-5
ing of semi-volatile organic species. Organic aerosol is the main focus and is simulated with three different configurations related to the volatility of POA and the scheme of secondary organic aerosol (SOA) formation. In addition, two types of emission inven-tories are used as model input in order to test the uncertainty related to the emissions. Predictions of basic meteorological parameters and primary and secondary pollutant
10
concentrations are evaluated and four pollution regimes according to the air mass origin are defined. Primary pollutants are generally overestimated, while ozone is consistent with observations. Sulfate is generally overestimated, while ammonium and nitrate lev-els are well simulated with the refined emission data set. As expected, the simulation with non-volatile POA and a single-step SOA formation mechanism largely
overes-15
timates POA and underestimates SOA. Simulation of organic aerosol with the VBS approach taking into account the aging of semi-volatile organic compounds (SVOC) shows the best correlation with measurements. All observed high concentration events are reproduced by the model mostly after long range transport, indicating that long range transport of SOA to Paris is well reproduced. Depending on the emission
in-20
ventory used, simulated POA levels are either reasonable or underestimated, while SOA levels tend to be overestimated. Several uncertainties related to the VBS scheme (POA volatility, SOA yields, the aging parameterization), to emission input data, and to simulated OH levels can be responsible for this behavior. Despite these uncertainties, the implementation of the VBS scheme into the CHIMERE model allowed for much
25
ACPD
12, 29475–29533, 2012Formation of organic aerosol in the Paris
region
Q. J. Zhang et al.
Title Page
Abstract Introduction
Conclusions References
Tables Figures
◭ ◮
◭ ◮
Back Close
Full Screen / Esc
Printer-friendly Version Interactive Discussion
Discussion
P
a
per
|
Dis
cussion
P
a
per
|
Discussion
P
a
per
|
Discussio
n
P
a
per
|
Europe), simulations indicate high levels of both anthropogenic and biogenic SOA frac-tions, while biogenic SOA dominates during days with advection from Southern France and Spain.
1 Introduction
Human activities in large urban agglomerations cause large amounts of pollutant
emis-5
sions, with negative effects on air quality and human health at a local and regional level (Gurjar et al., 2008; Sicard et al., 2011). Aerosol degrades visibility and may have negative impacts on ecosystems (Molina and Molina, 2004). It also affects climate by changing the radiative balance of the atmosphere (direct and indirect effects, IPCC 2007). Organic aerosol makes up for a large part of PM2.5 (Putaud et al., 2010), but
10
there are still large gaps in our understanding of its formation pathways and there is considerable uncertainty in their representation in 3-D models (Volkamer et al., 2006; Hallquist et al., 2009).
Models, based on partitioning theory and secondary organic aerosol (SOA) yields obtained from chamber studies performed especially in the 1990s, largely
underesti-15
mated ambient SOA (Volkamer et al., 2006). The experimental conditions during these chamber studies may have not represented the ambient conditions. The experiment time was often too short to take into account the ongoing oxidation of semi-volatile or-ganic compounds (SVOC), and important but unrecognized precursors were neglected (Kroll and Seinfeld, 2008; Hallquist et al., 2009). Semi-empirical formulas used for the
20
estimation of vapor pressure and enthalpy of surrogate products may also induce ad-ditional uncertainty (Hallquist et al., 2009; Valorso et al., 2011).
In the Paris region, a previous study (Sciare et al., 2010) compared SOA mod-eled with the regional chemistry transport model (CTM) CHIMERE using a surrogate species based single-step oxidation SOA scheme described in Sect. 3.4.1 (Pun et al.,
25
con-ACPD
12, 29475–29533, 2012Formation of organic aerosol in the Paris
region
Q. J. Zhang et al.
Title Page
Abstract Introduction
Conclusions References
Tables Figures
◭ ◮
◭ ◮
Back Close
Full Screen / Esc
Printer-friendly Version Interactive Discussion
Discussion
P
a
per
|
Dis
cussion
P
a
per
|
Discussion
P
a
per
|
Discussio
n
P
a
per
|
centrations simulated with this scheme were on average underestimated by a factor of three. Even larger errors were encountered when aged air mass with high SOA levels arrived in the observation site. This scheme was also evaluated by Bessagnet et al. (2009) for Europe and Hodzic et al. (2009) for the Mexico City. Bessagnet et al. (2009) concluded that simulated OA concentrations are systematically
underesti-5
mated with respect to rural background observations available from the CARBOSOL campaign and EMEP EC/OC campaign measurement data (for year 2003, Simpson et al., 2007). Hodzic et al. (2009) reported an underestimation of a factor of 2–10 for daytime SOA production in Mexico City during the MILAGRO field campaign in March, 2006. Very recently, a surrogate species based SOA formation scheme taking into
ac-10
count POA volatility and SVOC chemical aging was used within the POLYPHEMUS model and applied to the OA formation in the Paris agglomeration (Couvidat et al., 2012a).
Since the semi-volatile nature of primary organic aerosol (POA) has been recognized (e.g. Robinson et al., 2007), this feature started to be taken into account in 3-D models,
15
where POA is generally considered as non-volatile. According to the partitioning theory (Pankow, 1994), the fraction of SVOC present in the aerosol phase is much larger close to emission sources with high OA levels than under ambient conditions, when OA is diluted. Thus, POA emissions constructed from measurements performed at high OA loading (typically ranging from 1000 to 10000 µg m−3) will result in an overestimation of
20
POA concentrations at ambient OA levels (typically ranging from 1 to 10 µg m−3), if the POA volatility is not taken into account. In addition, emissions of organic compounds of intermediate-volatility (IVOC, with saturation concentration from 104 to 106µg m−3, Dohanue et al., 2006) are in many case not yet included in current air quality simula-tions (Robinson et al., 2007; Grieshop et al., 2009; Kukkonen et al., 2012). The gas
25
ACPD
12, 29475–29533, 2012Formation of organic aerosol in the Paris
region
Q. J. Zhang et al.
Title Page
Abstract Introduction
Conclusions References
Tables Figures
◭ ◮
◭ ◮
Back Close
Full Screen / Esc
Printer-friendly Version Interactive Discussion
Discussion
P
a
per
|
Dis
cussion
P
a
per
|
Discussion
P
a
per
|
Discussio
n
P
a
per
|
and Pandis. 2009; Presto et al., 2009, 2010). These features have been recently for-malized and parameterized in a framework named volatility-basis-set (VBS) approach (Donahue et al., 2006; Robinson et al., 2007), especially when the updated VBS treat-ment of Grieshop et al. (2009) is used (Dzepina et al., 2010; Hodzic et al., 2010). Multi-step oxidation of classic SOA precursors, such as aromatic compounds or
ter-5
penes, has also been included in this framework (Lane et al., 2008a; Tsimpidi et al., 2010).
The VBS approach has been applied in different models (WRF-Chem, PMCAMx, CHIMERE, EMEP) in order to simulate the primary and secondary organic aerosol over the USA (Shrivastava et al., 2008; Murphy and Pandis. 2009), over Mexico City
10
(Hodzic et al., 2010; Tsimpidi et al., 2010) and over Europe (Fountoukis et al., 2011, Bergstr ¨om et al., 2012). Comparisons between simulated OA components with this approach and those derived from aerosol mass spectrometer (AMS) measurements by applying positive matrix factorization (PMF, Lanz et al., 2007; Ulbrich et al., 2009) performed for Mexico City were encouraging (Tsimpidi et al., 2010; Hodzic et al., 2010).
15
In general, simulations using the VBS approach simulations in which evaporation of POA emissions, additional IVOC emissions, and chemical aging of gas phase IVOC and SVOC were taken into account gave better agreement in terms of SOA mass when compared to measurements. These studies suggest that OPOA produced from oxidation of gas phase IVOC and SVOC might be a non-negligible fraction of SOA.
20
In the framework of the European Seventh Framework Program (EU/FP7) project MEGAPOLI (Megacities: Emissions, urban, regional and Global Atmospheric POLlu-tion and climate effects, and Integrated tools for assessment and mitigation) (Baklanov et al., 2008), an intensive measurement campaign was launched in the Greater Paris Region in July, 2009. The major objective was to provide new experimental data in
or-25
ACPD
12, 29475–29533, 2012Formation of organic aerosol in the Paris
region
Q. J. Zhang et al.
Title Page
Abstract Introduction
Conclusions References
Tables Figures
◭ ◮
◭ ◮
Back Close
Full Screen / Esc
Printer-friendly Version Interactive Discussion
Discussion
P
a
per
|
Dis
cussion
P
a
per
|
Discussion
P
a
per
|
Discussio
n
P
a
per
|
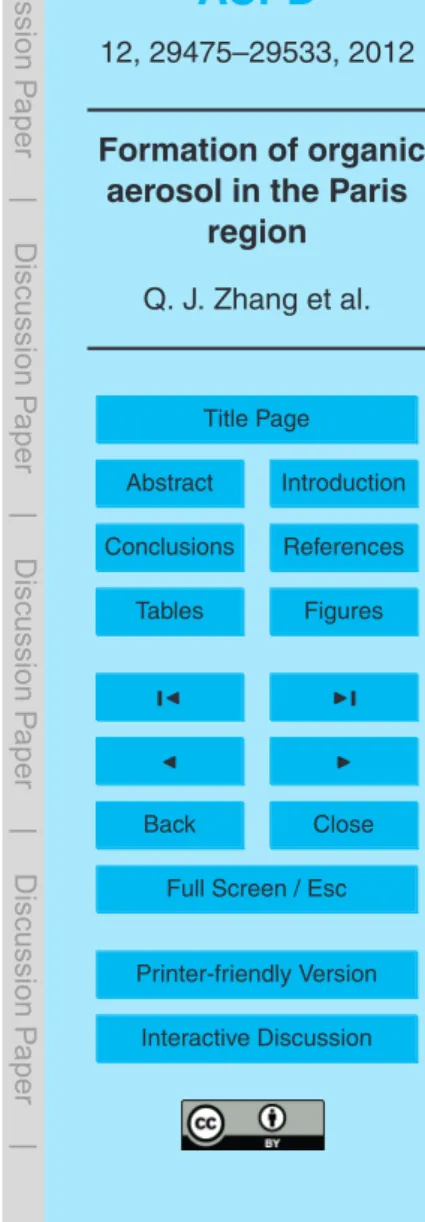
measurement sites across the Paris agglomeration along a SW-NE axis (Fig. 1): the LHVP (Laboratoire d’Hygi `ene de la Ville de Paris) site in Paris 13th arrondissement is an urban background site; the GOLF Poudri `ere site (denoted as GOLF in the following text) in Livry Gargan and the SIRTA (Site Instrumental de Recherche par T ´el ´ed ´etection Atmosph ´erique) atmospheric research observatory at Ecole Polytechnique, Palaiseau
5
(Haeffelin et al., 2005) are suburban sites on the north-eastern and south-western edge of the agglomeration, respectively. A short description of site characteristics is given in Table 1. The Paris agglomeration is often influenced either by polluted continental air masses advected from north-east or by clean oceanic air masses advected from west or south-west. For each situation, one site was located upwind, within, and downwind
10
of the Paris city.
In this study, we focus on the evaluation of the CHIMERE model performance against the observations during the summer campaign 2009, in particular for organic aerosol and for different aerosol schemes and the VBS framework. With respect to earlier stud-ies evaluating the VBS scheme within chemistry-transport models cited above, this
15
work focuses on a European megacity which is subject both to local emissions of primary organic aerosol and to advection of secondary organic aerosol during well-defined transport regimes. In Sect. 2.1, a short description of measurements during the MEGAPOLI summer campaign is given. Different meteorological and transport regimes are discussed in Sect. 2.2. In Sect. 3, the reference model configuration and simulation
20
set-up using the VBS approach to model POA and SOA are introduced; different alter-native model scenarios using different emission inventories and model configurations with different OA schemes are presented. A general evaluation of model performance is presented in Sect. 4, both for the ground-based meteorological observations and chemical measurements. A specific evaluation of primary and secondary OA
simula-25
ACPD
12, 29475–29533, 2012Formation of organic aerosol in the Paris
region
Q. J. Zhang et al.
Title Page
Abstract Introduction
Conclusions References
Tables Figures
◭ ◮
◭ ◮
Back Close
Full Screen / Esc
Printer-friendly Version Interactive Discussion
Discussion
P
a
per
|
Dis
cussion
P
a
per
|
Discussion
P
a
per
|
Discussio
n
P
a
per
|
2 Measurements and pollution regimes during the MEGAPOLI summer campaign
2.1 Measurements
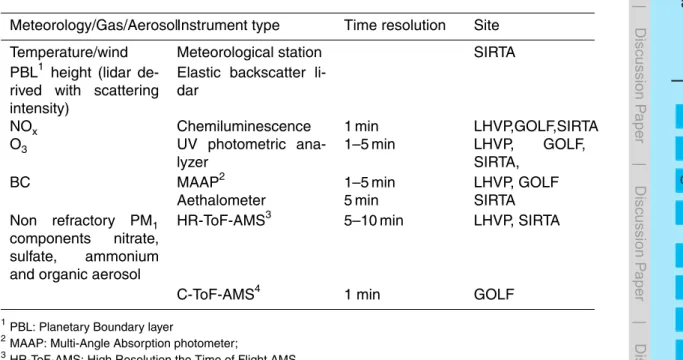
The meteorological parameters such as 2 m height temperature and relative humidity, wind speed and direction at 10 m height were provided by the SIRTA observatory.
Ta-5
ble 2 lists information about gas and aerosol measurements deployed at the three main measurement sites, which are used in this work for model evaluation. In the agglomer-ation, NOx and black carbon (BC) are considered as urban or more precisely, mainly traffic related emission tracers. Ozone is evaluated as a tracer of past photochemical activity in encountered air masses. Inorganic and organic aerosol measurements are
10
performed by several instruments. Here we only use the measurements with AMS (De-Carlo et al., 2006; Drewnick et al., 2005). Source apportionment from positive matrix factorisation (PMF) analysis (Freutel et al., 2012; Crippa et al., 2012b) was applied to study the origins and the potential sources of OA. In this paper, only the solution from Freutel et al., 2012 is used. Two factors were attributed to Hydrocarbon-like Organic
15
Aerosol (HOA) and Oxygenated Organic Aerosol (OOA). Their concentrations were previously found to be strongly linked to primary and secondary organic aerosol (POA and SOA, respectively) by analyzing their spectra with known sources and their time series to other tracers (Ulbrich et al., 2009). A third important factor identified was re-lated to cooking activities (about 36 % of total OA) only at LHVP (Freutel et al., 2012).
20
ACPD
12, 29475–29533, 2012Formation of organic aerosol in the Paris
region
Q. J. Zhang et al.
Title Page
Abstract Introduction
Conclusions References
Tables Figures
◭ ◮
◭ ◮
Back Close
Full Screen / Esc
Printer-friendly Version Interactive Discussion
Discussion
P
a
per
|
Dis
cussion
P
a
per
|
Discussion
P
a
per
|
Discussio
n
P
a
per
|
2.2 Pollution regimes
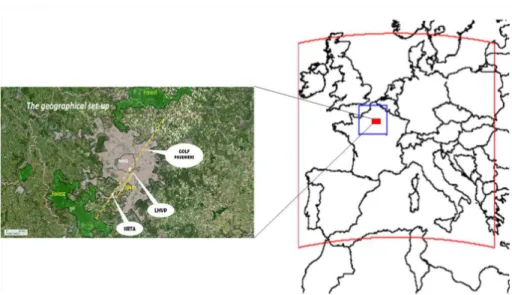
From a combined analysis of meteorology and pollution characteristics, the MEGAPOLI summer campaign can be divided into four periods (Fig. 2) with distinct chemical trans-port regimes:
– R1: North-easterly weak winds under anti-cyclonic conditions during two days
5
on 1 and 2 July which led to advection of pollution from the BENELUX (Belgium, the Netherlands, and Luxembourg) and Rhine-Ruhr region (Germany) to the Paris agglomeration; high temperature above 305 K (32◦
C).
– R2: Weak winds with variable direction and high temperature above 300 K on 4 July, favoring local accumulation of pollutants.
10
– R3: Mainly southerly winds, but sometimes weak and instable, rather high tem-peratures around 300 K (27◦C) on 16, 21, 26, 28–29 July.
– R4: Westerly to south-westerly wind advecting clean marine air masses, lower temperatures than days in other regimes,, mostly cloudy with rarely rainy condi-tions; weak rotating wind on 11 July, relatively higher wind speed from 2–6 m s−1
15
for the rest of the period.
3 Simulations
3.1 Model Configuration
In this work, we used the CHIMERE v2008b version (see http://www.lmd. polytechnique.fr/chimere/) (Bessagnet et al., 2009). It is widely used for operational
20
ACPD
12, 29475–29533, 2012Formation of organic aerosol in the Paris
region
Q. J. Zhang et al.
Title Page
Abstract Introduction
Conclusions References
Tables Figures
◭ ◮
◭ ◮
Back Close
Full Screen / Esc
Printer-friendly Version Interactive Discussion
Discussion
P
a
per
|
Dis
cussion
P
a
per
|
Discussion
P
a
per
|
Discussio
n
P
a
per
|
et al., 2010)). CHIMERE is used as the French national tool for air quality forecast (http://www.prevair.org/).
Two nested domains are simulated in this study: a continental domain which covers Europe with a resolution of 0.5°(35–57.5° N; 10.5°W–22.5°E) and a regional domain over Northern France with a resolution of 3 km (Fig. 1). 8 hybrid-sigma vertical
lay-5
ers are used, with the first layer extending from ground to about 40 m. The model top is at 500 hPa. Tropospheric gas phase chemistry is represented using the reduced MELCHIOR chemical mechanism (Lattuati, 1997; Derognat et al., 2003), including 120 reactions and 44 gaseous species. For the simulation of the particulate phase, 8 bins with diameters ranging from 0.04 to 10 micrometer are used. The thermodynamic
10
equilibrium of the inorganic species (sulfate, nitrate, ammonium and water) is interpo-lated from a table precalcuinterpo-lated with the ISORROPIA model (Nenes et al., 1998). The thermodynamic equilibrium of evaporation and condensation processes is kinetically controlled by absorption flux (Seinfeld and Pandis, 2006). SOA schemes such as the method in the standard CHIMERE version with single-step oxidation (denoted here as
15
CSS) and the VBS approach are both used here. They are respectively described in Sects. 3.3 and 3.4. POA is considered as non-volatile in a simulation with the standard version. It is also simulated with the VBS approach in which its volatility is taken into account (see details in Sect. 3.3).
Meteorological parameters are input for CHIMERE and are taken from simulations
20
with the PSU/NCAR MM5 model (Dudhia, 1993) for two nested domains with 45 km (European domain) and 15 km (North-West Europe) resolution. In the vertical, 23 sigma layers extend up to 100 hPa. MM5 is forced by the final analyses from the Global Fore-cast System (GFS/FNL) operated daily by the American National Centers for Envi-ronmental Prediction (NCEP), using the grid nudging (grid FDDA) option implemented
25
within MM5.
ACPD
12, 29475–29533, 2012Formation of organic aerosol in the Paris
region
Q. J. Zhang et al.
Title Page
Abstract Introduction
Conclusions References
Tables Figures
◭ ◮
◭ ◮
Back Close
Full Screen / Esc
Printer-friendly Version Interactive Discussion
Discussion
P
a
per
|
Dis
cussion
P
a
per
|
Discussion
P
a
per
|
Discussio
n
P
a
per
|
about 0.7 µg m−3according to long-time measurements and climatologic analyses (Se-infeld and Pandis, 2006).
3.2 Emissions
Two different anthropogenic emission inventories have been used in this study. For the reference simulations, anthropogenic gas phase emissions are calculated
5
from EMEP annual totals for year 2005 with a 50 km resolution (http://www.ceip. at/emission-data-webdab/), while BC and POA are prescribed from the Laboratoire d’A ´erologie (LA) emission inventory also for year 2005 (Junker and Louisse, 2008) with a 0.25° resolution. This corresponds to the emission data base used in the standard CHIMERE configuration also used for operational national air quality forecast within the
10
PREV’AIR system (Honor ´e et al., 2008). For the nested simulations, these emissions are downscaled using a landuse distribution as described in Bessagnet et al. (2009). In addition, an emission inventory (denoted as MPOLI in the following text) has been developed for both the gas and particulate phases by TNO and Airparif within the MEGAPOLI project, taking into account specific information for the Paris
agglomera-15
tion (Denier van der Gon et al., 2011). In this inventory, the refined Paris emissions are delivered by Airparif (Airparif, 2010) with a 1 km resolution and were integrated into a European inventory with 7 km resolution (Pouliot et al., 2012). Both of these emis-sions sets are scaled to hourly emisemis-sions applying temporal profiles provided by IER (Friedrich, 1997). Biogenic emissions are calculated online using the MEGAN (Model
20
of Emissions of Gases and Aerosols from Nature) model data and parameterizations (Guenther et al., 2006).
3.3 Volatility-basis-set approach for primary organic aerosol emissions
We apply the volatility profiles as presented by Robinson et al. (2007) for each simu-lated volatility and size of POA and IVOC species. They are classified into 9 bins
repre-25
ACPD
12, 29475–29533, 2012Formation of organic aerosol in the Paris
region
Q. J. Zhang et al.
Title Page
Abstract Introduction
Conclusions References
Tables Figures
◭ ◮
◭ ◮
Back Close
Full Screen / Esc
Printer-friendly Version Interactive Discussion
Discussion
P
a
per
|
Dis
cussion
P
a
per
|
Discussion
P
a
per
|
Discussio
n
P
a
per
|
bins being separated by a factor of 10 in C∗
. The total amount of IVOC emissions is set as 1.5 times that of POA emissions as in earlier modeling studies (Robinson et al., 2007; Shrivastava et al., 2008; Murphy and Pandis, 2009; Hodzic et al., 2010; Tsimpidi et al., 2010). This value of 1.5 is corresponding to the value obtained from previous chamber studies for emission of diesel exhaust (Robinson et al., 2007; Shrivastava et
5
al., 2008). The parameters used to simulate the partitioning of POA emissions, such as the reference saturation concentration C∗ at 298 K, the enthalpy and emission fac-tors with respect to the traditional non-volatile POA emissions for each class of com-pounds are presented in Table S1 in the Supplement. Introducing these SVOC and IVOC species with the VBS approach results in 136 new species and 17 chemical
10
reactions to be computed, which doubles the computational time of CHIMERE.
Assuming a maximum OA ambient concentration of 10 µg m−3in Paris during sum-mertime, IVOC species in the volatility bins between 104 and 106µg m−3 are almost totally in the gaseous phase. The particulate phase fraction in the bin for the least volatile IVOCi bin with C∗
=104µg m−3represents only 0.15 % of the total POA under
15
typical summer conditions (T =298 K, OA=10 µg m−3). Therefore, IVOC compounds are considered in the model to be present only in the gas phase in summer. The six less volatile SVOC bins are considered to be semi-volatile and partitioning between gas and particle phases. This reduction of semi-volatile bins and species to be treated results in about 30 % less computational cost.
20
Because the emission factors for calculating diesel exhaust related POA emissions for both the LA and MPOLI inventories are obtained from laboratory measurements under a low level of dilution with high OA loading (of the order of 1000 µg m−3 (PROP-CARB, 2010)), an important fraction (∼75 %) of semi-volatile compounds is emitted within the particle phase according to dilution experiments described in Robinson et
25
ACPD
12, 29475–29533, 2012Formation of organic aerosol in the Paris
region
Q. J. Zhang et al.
Title Page
Abstract Introduction
Conclusions References
Tables Figures
◭ ◮
◭ ◮
Back Close
Full Screen / Esc
Printer-friendly Version Interactive Discussion
Discussion
P
a
per
|
Dis
cussion
P
a
per
|
Discussion
P
a
per
|
Discussio
n
P
a
per
|
for POA at least during summer. Thus, POA emissions in the LA and MPOLI inventories are taken as input for the VBS approach and the emission factor profile from Robinson et al. (2007) for diesel exhaust is applied, like in Shrivastava et al. (2008) and Murphy and Pandis (2009) for USA. Note that for Mexico City (Hodzic et al., 2010; Tsimpidi et al., 2010) emission factors for organic aerosol were determined under ambient
pollu-5
tion conditions. In this case, emission factors have been multiplied by a value of three in order to take into account emitted SVOCs present in the gas phase and not captured in the POA measurements.
In the VBS scheme, the gas phase oxidation of semi-volatile POA is taken into ac-count by shifting SVOC and IVOC species successively to bins with lower volatility
10
(Robinson et al., 2007). The reaction rate constant of the SVOC and IVOC reaction with OH is estimated as 4×10⁻¹¹cm−3 molecules−1s−1 (Murphy and Pandis. 2009). Each oxidation reaction increases the species mass by 7.5 % to account for added oxygen (Robinson et al., 2007; Shrivastava et al., 2008). The formation of secondary compounds (OPOA) from oxidized SVOC is again governed by the gas-particle
parti-15
tioning theory as a function of the OA mass loading and ambient temperature.
3.4 SOA in CHIMERE
Two schemes for SOA formation are used here. One is the single-step oxidation scheme used in the CHIMERE standard version (Pun et al., 2006; Bessagnet et al., 2009; Hodzic et al., 2009); the other is the VBS approach (Lane et al., 2008a).
20
3.4.1 Single step oxidation
In the single-step oxidation mechanism the formation of SVOC species is parameter-ized by a single oxidation step, which nevertheless can represent several individual oxidation steps. SVOC species are then considered as chemically inert for the rest of the simulation. As a function of their volatility and preexisting OA, SVOC species
un-25
ACPD
12, 29475–29533, 2012Formation of organic aerosol in the Paris
region
Q. J. Zhang et al.
Title Page
Abstract Introduction
Conclusions References
Tables Figures
◭ ◮
◭ ◮
Back Close
Full Screen / Esc
Printer-friendly Version Interactive Discussion
Discussion
P
a
per
|
Dis
cussion
P
a
per
|
Discussion
P
a
per
|
Discussio
n
P
a
per
|
are derived from previous laboratory experiment data for several types of precursors (Pun et al., 2006).
Both anthropogenic and biogenic VOC species can act as SOA precursors. Anthro-pogenic VOC emissions are distributed into 266 individual VOC species following emis-sion sector specific emisemis-sion profiles given by Passant, (2002). These species are
5
aggregated into 9 lumped VOC classes according to the mass molar weight and the reactivity of individual species and VOC class representatives (Middleton et al., 1990). Three of these lumped anthropogenic VOC classes, a class of alkanes from C4 to C13, a class of benzene, toluene and other mono-substituted aromatics and a class of tri-methylbenzene and other poly-substituted aromatics represent SOA precursors. The
10
latter two classes are only used for SOA formation, and do not interfere with gas phase chemistry. All classes are oxidized by OH, ozone and NO3to produce semi-volatile or-ganic compounds. Oxidation of biogenic VOC species as SOA precursors (α-pinene, sabinene,β-pinene,δ3-carene, limonene, ocimene, myrcene and isoprene, Table S2 in the Supplement) is also taken into account. The SVOC products are presented as
15
surrogate hydrophobic and hydrophilic species, grouped according to their hydrophobic character, ie, water solubility, acid dissociation and saturation vapor pressure (Bessag-net et al., 2009).
3.4.2 VBS approach for SOA formation
SOA (or SVOC) produced from precursors of anthropogenic and biogenic VOC, named
20
ASOA (or anthropogenic SVOC) and BSOA (or biogenic SVOC), respectively, is simu-lated by using four different volatility bins (Lane et al., 2008a; Murphy and Pandis, 2009) in which the saturation concentration C∗ of SVOC at a temperature of 300K ranges from 1 to 103µg m−3 with a factor of ten between two classes. This scheme was ini-tially developed and used with the gas phase SAPRC99 mechanism (Carter, 2000). In
25
Accord-ACPD
12, 29475–29533, 2012Formation of organic aerosol in the Paris
region
Q. J. Zhang et al.
Title Page
Abstract Introduction
Conclusions References
Tables Figures
◭ ◮
◭ ◮
Back Close
Full Screen / Esc
Printer-friendly Version Interactive Discussion
Discussion
P
a
per
|
Dis
cussion
P
a
per
|
Discussion
P
a
per
|
Discussio
n
P
a
per
|
ing to SAPRC99, anthropogenic VOCs (AVOC) emissions used for simulation of SOA were regrouped into 6 lumped species including alkanes with 5 and 6 carbon atoms and more than 7 carbon atoms; a class of terminal alkenes, a class of all internal and cyclic alkenes; a class of toluene, benzene, and ethylbenzene, and a class of xylenes, trimethylbenzenes, ethyltoluene, and higher aromatics. Two types of biogenic VOCs,
5
monoterpene and isoprene are taken into account (Table S2 in the Supplement). Pa-rameters for sesquiterpene oxidation were also developed in Lane et al. (2008a), but this class of compounds is not accounted for this study as no emission estimates are available.
SOA yields for the different VOC groups listed in Table S3 in the Supplement and for
10
the four volatility bins have been obtained by fitting them to a large number of chamber measurements representative for urban (high NOx) and regional (low NOx) pollution (Lane et al., 2008a and references herein).
In this study, we choose to apply the yield parameterizations (Murphy and Pandis. 2009; Lane et al., 2008b) for SOA simulations under low NOx conditions (VOC/NOx
15
>10 ppbC ppb−1) with relatively high yields, though high NO
x conditions with lower yields probably might have been expected for SOA formation from anthropogenic VOC in the Paris agglomeration and in its plume. However, under conditions of long range transport of SOA to the agglomeration, which were prevailing during the campaign (Freutel et al., 2012), these yields are appropriated. Besides, the larger SOA yields
20
under low NOx conditions are still compatible with results of some of the chamber studies for high NOxconditions (Ng et al., 2006; Hildebrandt et al., 2009).
The chemical aging of gas phase anthropogenic and biogenic SVOCs is imple-mented in the model in a similar way as for OPOA (Shrivastava et al., 2011), because available experimental data suggest that secondary generation products may
con-25
ACPD
12, 29475–29533, 2012Formation of organic aerosol in the Paris
region
Q. J. Zhang et al.
Title Page
Abstract Introduction
Conclusions References
Tables Figures
◭ ◮
◭ ◮
Back Close
Full Screen / Esc
Printer-friendly Version Interactive Discussion
Discussion
P
a
per
|
Dis
cussion
P
a
per
|
Discussion
P
a
per
|
Discussio
n
P
a
per
|
2008; Murphy and Pandis. 2009). Laboratory (Ng et al., 2007b) and modeling exper-iments (Valorso et al., 2011; Cappa and Wilson, 2012) suggest aging processes also for biogenic SVOC species. Thus a similar chemical aging scheme (using the same parameters as for anthropogenic VOC) was included for biogenic VOC precursors (as also done by Tsimpidi et al., 2010). Other applications of the VBS (Murphy and Pandis,
5
2009; Fountoukis et al., 2011) have assumed that the aging of the biogenic VOCs does not lead to a net increase of the corresponding aerosol because of a balance between the functionalization and fragmentation processes.
3.5 Simulation configurations
In this study, four model configurations have been set up for evaluation with MEGAPOLI
10
campaign measurements.
1. One standard simulation denoted as CSS (classical single-step) in which POA is considered as non-volatile, and the single-step scheme for SOA formation as described in Sect. 3.3.
2. The volatility of semi-volatile POA and the chemical aging of the related SVOC
15
and IVOC are simulated in VBS-T1. The single-step oxidation SOA scheme is used for anthropogenic and biogenic VOC precursors. IVOC is added at 1.5 times of the POA emitted mass.
3. In contrast to VBS-T1, the 4 bins VBS approach for SOA formation is applied in theVBS-T2simulation. The chemical aging of anthropogenic and biogenic SVOC
20
is included.
4. As in (3), but the specific MEGAPOLI project emission inventory is used in a simulation with the VBS-T2 configuration on the regional domain while in configu-rations (1)–(3), EMEP/LA emissions are used. Simulation (4) is nested into a con-tinental simulation as in (3). So, only emissions over Northern France changed.
25
ACPD
12, 29475–29533, 2012Formation of organic aerosol in the Paris
region
Q. J. Zhang et al.
Title Page
Abstract Introduction
Conclusions References
Tables Figures
◭ ◮
◭ ◮
Back Close
Full Screen / Esc
Printer-friendly Version Interactive Discussion
Discussion
P
a
per
|
Dis
cussion
P
a
per
|
Discussion
P
a
per
|
Discussio
n
P
a
per
|
4 Model evaluation with ground based measurements
In this section, first a general evaluation of the model performance during the MEGAPOLI summer campaign is presented by comparing ground based observations of meteorological parameters, concentrations of the gas phase pollutants as well as primary and secondary PM species with simulations. Then the comparison focuses on
5
the evaluation of the different organic aerosol schemes presented above.
All measurements are averaged into hourly data in order to be comparable to model results. Time series are presented according to the above defined four periods of dif-ferent transport regimes (R1–4). Special features in time series (and the model ability to represent them) are highlighted. In addition, the daily variation of some species is
10
discussed.
Statistical metrics are calculated in order to give objective scores for the model performance. They are presented as absolute and relative bias, (relative) root mean square error (RMSE) and correlation coefficient (R). The detailed statistical results are presented in the Supplement.
15
As the modification of OA simulations in CSS, VBS-T1 and VBS-T2 with the same emission inventory only marginally or not at all affects simulations of other species, their concentrations are all taken from the VBS-T2 simulation and evaluated together with those from the VBS-MPOLI run.
4.1 Evaluation of meteorological parameters 20
Meteorological parameters such as 10 m wind and 2 m temperature from the MM5 simulation are compared to the measurement data obtained from the automatic mete-orological station located at the suburban SIRTA observatory within the Paris agglom-eration. The results are used to evaluate the simulation of meteorological parameters which are expected to represent the weather conditions in the Paris agglomeration.
25
ACPD
12, 29475–29533, 2012Formation of organic aerosol in the Paris
region
Q. J. Zhang et al.
Title Page
Abstract Introduction
Conclusions References
Tables Figures
◭ ◮
◭ ◮
Back Close
Full Screen / Esc
Printer-friendly Version Interactive Discussion
Discussion
P
a
per
|
Dis
cussion
P
a
per
|
Discussion
P
a
per
|
Discussio
n
P
a
per
|
MM5 results and measurements at SIRTA (R=0.73), a positive bias (relative bias) of+1.07 m s−1 (+35 %) and RMSE (relative RMSE) of 1.64 m s−1 (53 %) is found (Ta-ble S4 in the Supplement). A small forest is located at about 100 m north of the mea-surement site which may lead to lower local wind speed and partly explain the apparent model overestimation during period R1 on days with northerly wind, while wind speed
5
at 200 m is consistent with the observation (results not shown). The simulated wind direction from the MM5 model is also generally consistent with measurements. Diff er-ences in wind direction and speed often occurred when wind speed was lower than 1 m s−1, such as during R2. Under such conditions, meso-scale meteorological models cannot be expected anymore to give reliable wind speeds and directions. The simulated
10
and measured temperatures are well correlated (R=0.92), the average simulated tem-perature is underestimated by 0.86 K. The RMSE for simulated/observed temtem-perature is 1.93 K. The three observed periods with enhanced temperatures (R1, R2 and R3 as described in Sect. 2) over 300 K are well represented in the simulations.
The boundary layer height was derived from aerosol lidar measurements using an
15
algorithm detecting maximal vertical and temporal gradients in the backscatter signal (Haeffelin et al., 2012). The assumption is that the aerosol is mixing in the boundary layer, while the free troposphere above is near particle free. This is particularly true under daytime convective conditions where the strongest aerosol gradients are found at the top of the boundary layer. The PBL height diagnosed in the MM5 model with the
20
MRF (Medium Range Forecast ) scheme (Hong and Pan, 1996) underestimates this derived boundary layer height by about 300 m on a monthly average basis. This mainly results from the maximum late afternoon PBL peak height which is underestimated by 600 m (∼30 %) on average (Fig. S1 in the Supplement). For several occasions, the PBL height underestimation was more pronounced, up to 1000 m for an observed PBL
25
ACPD
12, 29475–29533, 2012Formation of organic aerosol in the Paris
region
Q. J. Zhang et al.
Title Page
Abstract Introduction
Conclusions References
Tables Figures
◭ ◮
◭ ◮
Back Close
Full Screen / Esc
Printer-friendly Version Interactive Discussion
Discussion
P
a
per
|
Dis
cussion
P
a
per
|
Discussion
P
a
per
|
Discussio
n
P
a
per
|
PBL height was also reported in previous studies in Mexico City with MM5 (Hodzic et al., 2009) and WRF models (Fast et al., 2009), even if this effect is more pronounced in the current study. In addition, it was reported that the lidar-derived PBL height could not unambiguously distinguish the shallow inversion layer that forms in the late after-noon, when the sensible heat flux gets lower, from the top of the residual layer. This
5
may induce a positive bias of 300–1000 m in the PBL height diagnosed from lidar ob-servations, as compared to the one deduced from radiosonde profiles (Hodzic et al., 2009). Thus, during late afternoon, both the simulated and observation-derived bound-ary layer heights are uncertain. The underestimation of the simulated PBL height in the late afternoon might conduct to an overestimation of the pollution level, which is
10
however difficult to quantify because of the uncertainty in the observed boundary layer height. In addition, MM5 often predicts low nighttime PBL height down to 70 m in urban regions. This is related to the fact that the urban canopy effect and urban heating effect are not taken into account in this model. Therefore, the minimum modeled PBL height is set to 200 m which is close to the measurements.
15
On the whole, simulations of meteorological parameters reasonably represent the general weather conditions for the Paris agglomeration during the summer MEGAPOLI campaign and can serve as an input to the CHIMERE CTM.
4.2 BC and NOxevaluation
The concentrations of primary pollutants mainly depend on their emissions, and on
20
meteorological conditions governing their dispersion. The model evaluation of NOxand BC at the three primary sites thus gives insight in the correctness of emissions and dispersion conditions over the urban area. Note, that for BC additional uncertainty can arise, if emission factors in the inventories have been determined by EC instruments and compared here to BC measurements, given sometimes large differences between
25
two methods (Oladoyin Salako et al., 2012).
ACPD
12, 29475–29533, 2012Formation of organic aerosol in the Paris
region
Q. J. Zhang et al.
Title Page
Abstract Introduction
Conclusions References
Tables Figures
◭ ◮
◭ ◮
Back Close
Full Screen / Esc
Printer-friendly Version Interactive Discussion
Discussion
P
a
per
|
Dis
cussion
P
a
per
|
Discussion
P
a
per
|
Discussio
n
P
a
per
|
the EMEP emission inventory) and VBS-MPOLI (the MEGAPOLI emission inventory) at the three principal sites are reasonably well correlated with the measurements with correlation coefficients around 0.55 at GOLF and LHVP and 0.65 at SIRTA, respectively (Fig. 3). These correlation coefficients are consistent with previous modeling studies in Europe (e.g. Beekmann et al., 2007). Simulated NOx levels are overestimated in
VBS-5
T2 with biases (relative biases) of+6.1 (+45 %), +2.7 (+15 %) and +1.7 ppb (+21 %) at GOLF, LHVP and SIRTA, respectively (Table S5 in the Supplement). Use of the MEGAPOLI emission inventory results in an even larger overestimation with (relative) biases of+10.0 (+95 %),+7.2 (+42 %) and+1.6 ppb (+22 %), respectively (Table S6 in the Supplement). The relative RMSEs from VBS-T2 (and VBS-MPOLI) are 85.9 %
10
(148 %), 80.2 % (104 %) and 69.3 % (84 %), respectively for these three sites. As diff er-ences between total French emissions in both emission inventories are small (because the same national emissions totals are used as input), these differences in the compar-ison to urban observations are probably related to the spatial downscaling procedure (see Sect. 3.2). The bias at SIRTA is relatively smaller than at GOLF and LHVP,
be-15
cause SIRTA is less influenced by Paris emissions during this summer campaign due to prevailing westerly to south-westerly winds. The average daily variation over the month of both of the simulations and observations shows peaks at these sites at about 7–8 a.m. local time (LT) (Fig. 3). Morning peaks are slightly overestimated by 20–30 % in the model at GOLF and SIRTA in VBS-T2 while they are overestimated up to about
20
75 % at GOLF in VBS-MPOLI. There are no clear evening modeled and measured peaks at these sites (more a continuous increase during evening and night) indicating that vertical mixing is still active at late afternoon. A particular case occurred during 28 and 29 July at LHVP when NOx concentrations in both VBS-T2 and VBS-MPOLI are largely, by about 60–100 ppb, underestimated, probably due to an overestimation
25
ACPD
12, 29475–29533, 2012Formation of organic aerosol in the Paris
region
Q. J. Zhang et al.
Title Page
Abstract Introduction
Conclusions References
Tables Figures
◭ ◮
◭ ◮
Back Close
Full Screen / Esc
Printer-friendly Version Interactive Discussion
Discussion
P
a
per
|
Dis
cussion
P
a
per
|
Discussion
P
a
per
|
Discussio
n
P
a
per
|
In conclusion, both VBS-T2 and VBS-MPOLI simulations overestimate the observed NOxlevels, which could either indicate underestimated dispersion related to the under-estimation of the boundary layer height at certain days, or an overunder-estimation of NOx emissions in the Greater Paris region, more pronounced for the MEGAPOLI inventory than for the EMEP one. Near source regions, sink processes (mainly reaction of NO2
5
with OH) are probably too slow to affect NOxlevels.
The correlation coefficients for simulated BC in VBS-T2 and VBS-MPOLI and mea-sured BC are in general around 0.5 at the three principal sites (Fig. 4). This result is co-herent with that obtained for NOx. The correlation coefficient is only 0.36 at SIRTA in the VBS-T2 simulation, probably due to the difficulty of correctly reproducing the very low
10
level of BC at this site mostly located upwind of Paris emissions during this campaign. The biases (relative biases) for comparison between simulated BC in VBS-T2 and mea-sured BC are +2.07 (+180 %), +2.08 (+167 %) and −0.24 µg m−3 (−38 %) at GOLF, LHVP and SIRTA, respectively (table S5 in the Supplement). They are much more im-portant than those for NOx though NOx and BC are both mostly traffic-related in the
15
city. The biases (relative biases) are+0.33 (+29 %),+0.52 (+41 %) and−0.05 µg m−3 (−7.3 %) for VBS-MPOLI (Table S6 in the Supplement).
The overestimation in VBS-T2 is most likely a result of an overestimation of BC emissions from the LA emissions inventory because the underestimation of the PBL height is too small to explain such large differences present during the whole day.
20
Such an overestimation is also suggested by the slope of BC with respect to NOx at LHVP, which is clearly higher in VBS-T2 (0.18 µg m−3ppb−1) than in the measurements (0.06 µg m−3ppb−1) while it is 0.07 µg m−3ppb−1from VBS-MPOLI with the MEGAPOLI inventory (Fig. S2 in the Supplement). Thus the latter inventory, into which refined urban BC emission data for the Paris agglomeration have been integrated (see above),
25
ACPD
12, 29475–29533, 2012Formation of organic aerosol in the Paris
region
Q. J. Zhang et al.
Title Page
Abstract Introduction
Conclusions References
Tables Figures
◭ ◮
◭ ◮
Back Close
Full Screen / Esc
Printer-friendly Version Interactive Discussion
Discussion
P
a
per
|
Dis
cussion
P
a
per
|
Discussion
P
a
per
|
Discussio
n
P
a
per
|
of both measured and modeled NOx and BC are correlated at these three sites with peaks around 8 a.m. LT.
4.3 Ozone evaluation
Similar to other secondary pollutants, lower-tropospheric ozone is generally photo-chemically produced in summer. Thus, the evaluation of ozone simulations against the
5
measurements may assess the simulated photochemical activity over the agglomera-tion and in advected air masses which also affects the formation of secondary organic aerosol. In addition, ozone is an important oxidant to react with biogenic VOC pre-cursors to form secondary organic aerosol. Therefore, it is important to evaluate the performance of ozone simulations in the model.
10
Modeled ozone concentrations both from VBS-T2 and VBS-MPOLI at the three pri-mary sites correlate well with the measured concentrations (R∼0.75) with small rela-tive biases below 13 % (Fig. 5, Tables S5 and S6 in the Supplement). Elevated ozone levels are linked both in the model and in observations to relatively high temperatures, often low winds and sunny conditions during periods R1, R2 and R3. These conditions
15
are favorable for photochemical ozone build-up. Modeled concentrations at GOLF and LHVP are lower in VBS-MPOLI due to higher NOxlevels in VBS-MPOLI than in VBS-T2 and thus enhanced ozone titration with NO. In the diurnal cycle, predicted and observed maximum values occur at about 16:00–17:00 LT. as a result of lower NOx values and more intense photochemical activity around noon.
20
4.4 Evaluation of inorganic aerosol species
The modeled secondary inorganic salt (sulfate, nitrate and ammonium) concentrations from both VBS-T2 and VBS-MPOLI simulations are generally overestimated with re-spect to the AMS measurements during the campaign. The modeled monthly average concentrations of the inorganic aerosol (here sum of sulfate, nitrate and ammonium) in
25
ACPD
12, 29475–29533, 2012Formation of organic aerosol in the Paris
region
Q. J. Zhang et al.
Title Page
Abstract Introduction
Conclusions References
Tables Figures
◭ ◮
◭ ◮
Back Close
Full Screen / Esc
Printer-friendly Version Interactive Discussion
Discussion
P
a
per
|
Dis
cussion
P
a
per
|
Discussion
P
a
per
|
Discussio
n
P
a
per
|
respectively (Table S5 and S6 in the Supplement). The correlation coefficients of these inorganic species are almost all above about 0.7 at GOLF and LHVP. Those of sulfate and ammonium are slightly lower at SIRTA.
The measured nitrate concentrations were very low (close to zero) except for the first two days of continental influence. This can lead to very large relative biases
(Ta-5
ble S5 in the Supplement), therefore here only the absolute differences are presented. There are often overestimations of nitrate peaks in the morning due to local formation in VBS-T2. On the contrary, the peaks in VBS-MPOLI are largely reduced to a simi-lar level as observed ones; the average bias is reduced to around+0.1 µg m−3. NO
x levels are lower in VBS-T2 than in VBS-MPOLI, thus the overestimation of nitrate
con-10
centrations in VBS-T2 is probably related to higher NH3 emissions in VBS-T2 in the urban region, due to errors in the spatial redistribution of agricultural NH3 emissions from the EMEP grid (50 km resolution) to the CHIMERE grid (3 km resolution). In the MEGAPOLI inventory, a more realistic spatial distribution of NH3emissions is achieved through a geographical location of agricultural surfaces. Unfortunately, no specific NH3
15
observations were available to evaluate the urban NH3concentrations.
Modeled sulfate concentrations in both VBS-T2 and VBS-MPOLI have similar time series at all three sites, since sulfate is mainly formed on a regional scale where the emissions in VBS-T2 and VBS-MPOLI are similar or equal. Sulfate levels are higher during R1 when continental air masses are advected to Paris. Background
concen-20
trations and several peaks are all overestimated in simulations. This could be due to overestimated OH and RO2 levels in the simulations (not shown here) with respect to the measurement at SIRTA (Michoud et al, 2012), which could increase sulfate forma-tion. However, we cannot conclude whether this is representative of the larger domain. About 10 % of overestimation may be related to the financial crisis in 2009 which
re-25
ACPD
12, 29475–29533, 2012Formation of organic aerosol in the Paris
region
Q. J. Zhang et al.
Title Page
Abstract Introduction
Conclusions References
Tables Figures
◭ ◮
◭ ◮
Back Close
Full Screen / Esc
Printer-friendly Version Interactive Discussion
Discussion
P
a
per
|
Dis
cussion
P
a
per
|
Discussion
P
a
per
|
Discussio
n
P
a
per
|
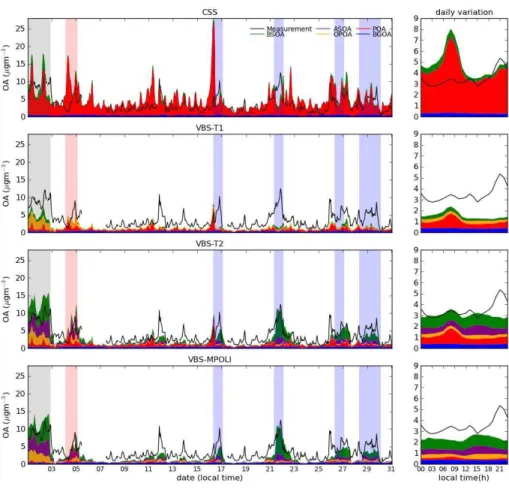
4.5 OA evaluation
Modeled OA concentrations, represented by the sum of background OA (long-range transported OA from the boundary limit of the simulation), POA, OPOA, ASOA and BSOA from the four model configurations described above are compared to the AMS measurements at the three sites (Figs. 7, 8, 9). At GOLF and LHVP and on the monthly
5
average, OA simulated in CSS overestimated the morning peaks by about a factor of two, while for the rest of the day the levels are consistent with the observations. POA is predicted to contribute about 90 % of the simulated OA. On the contrary, OA is underestimated at SIRTA, especially the peaks during R3 with southerly wind. This is because SIRTA is often situated upwind to Paris emissions during R3 and R4, in
10
contrast to GOLF and LHVP, so it is less influenced by primary emissions than these sites. The biases (relative biases) are+1.17 (+33 %),+1.53 (+46 %) and−1.11 µg m−3 (−49 %) at GOLF, LHVP and SIRTA, respectively (Table S5 in the Supplement). The modeled and measured OA concentrations are not well correlated,Rvalues only reach 0.22, 0.43 and 0.66, respectively, at the three sites.
15
The modeled OA from the VBS-T1 simulation is much lower than for the CSS simu-lation, both for the morning peaks and the rest of the day. This is due to the fact that an important fraction of emitted POA is evaporated in this scheme, which diminishes sim-ulated POA levels by a factor of about 6.5 at GOLF, LHVP and SIRTA. The secondary fraction is increased by introducing OPOA especially during R1 when continental
pollu-20
tion is advected to Paris (Figs. 11, 12, 13), but this does not compensate for the lower POA levels. As a result, the VBS-T1 simulation underestimates OA by more than 70 % at the three sites (Table S5 in the Supplement). However, this simulation is better corre-lated with the measurement than CSS. The correlation coefficients are 0.58, 0.59 and 0.78 at GOLF, LHVP and SIRTA, respectively (Table S5 in the Supplement).
25
Sup-ACPD
12, 29475–29533, 2012Formation of organic aerosol in the Paris
region
Q. J. Zhang et al.
Title Page
Abstract Introduction
Conclusions References
Tables Figures
◭ ◮
◭ ◮
Back Close
Full Screen / Esc
Printer-friendly Version Interactive Discussion
Discussion
P
a
per
|
Dis
cussion
P
a
per
|
Discussion
P
a
per
|
Discussio
n
P
a
per
|
plement). This simulation captures almost all peaks during the summer campaign, es-pecially several missing peaks in the CSS and VBS-T1 simulations during periods R1 and R3. Consequently, the correlation coefficients are improved to 0.79, 0.76 and 0.84, respectively.
During R1, observations and simulations show similar OA levels at all three sites,
5
which again indicate long range transport of continental pollution as a major OA source. The VBS-T2 configuration predicts that the secondary fraction contribution to OA ex-ceeds 90 % (Figs. 11, 12, 13). About half of this can be attributed to biogenic species. During this period starting on 30 June (R1), polluted air masses from BENELUX are transported to Paris, as indicated by retro-plume calculations (see for example
Freu-10
tel et al., 2012). The OA of anthropogenic origin (ASOA and OPOA) is also important (Fig. 10). In addition, the time evolution of the simulated OA fields seems also to in-dicate biogenic SOA formation from BVOC’s emitted in the forest zone on the east of France and on the southwest of Germany, and its transport to Paris (Fig. 10). Paris is influenced by this polluted air mass during two days until 2 July.
15
During R3, the peaks related to advection of biogenic SOA (>60 % of OA) to the Greater Paris region are also reproduced (Figs. 11, 12, 13). This is illustrated for the SOA peak observed on 21 July. Biogenic SOA is produced from BVOC emissions in the north of Spain on 20 July and is transported towards northeast (Fig. 11). During its transport, the air mass mixes with additional BVOC emissions over SW France. During
20
further transport to Paris, chemical aging of SVOC emissions takes place, transforming additional SVOC to SOA and reducing its volatility. Within the Ile-de-France region, additional VOC and OA emissions further increase the OA burden.
The modeled and measured average OA diurnal variations at SIRTA are very well correlated. The modeled morning peaks at GOLF and LHVP are close to the
mea-25
ACPD
12, 29475–29533, 2012Formation of organic aerosol in the Paris
region
Q. J. Zhang et al.
Title Page
Abstract Introduction
Conclusions References
Tables Figures
◭ ◮
◭ ◮
Back Close
Full Screen / Esc
Printer-friendly Version Interactive Discussion
Discussion
P
a
per
|
Dis
cussion
P
a
per
|
Discussion
P
a
per
|
Discussio
n
P
a
per
|
When using the MEGAPOLI emission inventory in the VBS-MPOLI simulation, the biases are−1.15 (−32 %), −0.95 (−29 %) and+0.14 µg m−3(+7.9 %) at GOLF, LHVP and SIRTA, respectively (Table S6 in the Supplement). The correlations are similar to those for VBS-T2, but the origin of OA is different. The contribution of POA is low, due to lower emissions in the inventory (Fig 11, 12, 13). OPOA is increased with respect to
5
VBS-T2, especially during R4. This is because the POA emissions in the Greater Paris region are reduced in the MEGAPOLI inventory with respect to the LA inventory by about a factor of 3, but they are increased on average by a factor of 3 in the surrounding areas in the southeast, allowing for POA evaporation and gas phase oxidation.
4.6 Evaluation of POA and SOA with PMF analysis at LHVP 10
In this part, modeled POA and SOA from all four simulations are compared to a 3-factor PMF analysis (Freutel et al., 2012) on OA measured by AMS at LHVP (Table 3). The three factors are traffic-related HOA, aged OA which is thought to be secondary origin (OOA) and related to cooking activities (see Sect. 2.1). This analysis is restricted to LHVP because at GOLF and SIRTA, only a 2-factor PMF analysis is available in
15
this PMF solution, in which possible OA from cooking activities is included in the HOA and OOA factors. In the simulations, background OA (BGOA) is considered as highly aged non-volatile OA, thus contributing to the predicted SOA. OPOA is considered as OOA, as done in previous papers comparing simulations with the VBS approach to AMS observations (Robinson et al., 2007; Shrivastava et al., 2008; Murphy and Pandis,
20
2009; Hodzic et al., 2010, etc.). However, note that Aumont et al. (2012) and Cappa and Wilson, (2012) argue that OPOA may be not enough oxidized to appear in the OOA fraction.
The modeled POA is correlated with HOA derived from the 3-factor PMF analysis with correlation coefficients of around 0.5 from all the simulations (Table S7 in the
25
ACPD
12, 29475–29533, 2012Formation of organic aerosol in the Paris
region
Q. J. Zhang et al.
Title Page
Abstract Introduction
Conclusions References
Tables Figures
◭ ◮
◭ ◮
Back Close
Full Screen / Esc
Printer-friendly Version Interactive Discussion
Discussion
P
a
per
|
Dis
cussion
P
a
per
|
Discussion
P
a
per
|
Discussio
n
P
a
per
|
by+3.42 µg m−3(
+55 %) in the CSS simulation. The morning peak is overestimated by about 0.4 µg m−3 in the VBS-T1 and VBS-T2 simulations and the peak in the evening is underestimated by about 0.1 µg m−3. On the contrary, POA simulated in VBS-MPOLI underestimates HOA on average by−0.65 µg m−3(−70 %), corresponding to lower OA emissions.
5
The observed POA/BC ratio at LHVP is 0.34 while it is 1.21, and thus largely overes-timated, in the CSS simulation. It is reduced to about 0.27 in VBS-T1 and VBS-T2. This indicates that it is important to take into account the POA volatility. However, the ratio is only 0.10 in VBS-MPOLI, thus nearly 3 times lower than observed. This indicates that large uncertainties still exist either in the quantity of OA emissions, and/or on their
10
volatility distribution.
For instance, Cappa and Jimenez, (2010) suggested that POA in Mexico City might be less volatile than indicated by the volatility profile of Robinson et al. (2007). When implementing their revised volatility profile into the VBS-T2 configuration, POA levels increased by 29 % for a test period of several days during July 2009, which cannot
15
explain the differences with observations. Couvidat et al. (2012b) propose using in-creased POA emissions in order to take into account SVOC emissions, which might not be included in the emission inventory. However, at least for traffic emissions, which are obtained under low dilution conditions, we think that the error due to unaccounted SVOC emissions should not exceed more than about 30 % (see Sect. 3.3). Another
20
hypothesis recently put forward is that OPOA might not be oxidized enough to be mea-sured as part of the OOA fraction, but would appear as HOA (Aumont et al., 2012; Cappa and Wilson, 2012). In this case, the monthly average POA concentration from VBS-MPOLI would be close to the measured one with a negative bias of−24 %, but the morning peak would still be missing (Fig. S5 in the Supplement).
25
overes-ACPD
12, 29475–29533, 2012Formation of organic aerosol in the Paris
region
Q. J. Zhang et al.
Title Page
Abstract Introduction
Conclusions References
Tables Figures
◭ ◮
◭ ◮
Back Close
Full Screen / Esc
Printer-friendly Version Interactive Discussion
Discussion
P
a
per
|
Dis
cussion
P
a
per
|
Discussion
P
a
per
|
Discussio
n
P
a
per
|
timated on the average by +0.79 (52 %) and +0.61 µg m−3 (
+37 %) in VBS-T2 and VBS-MPOLI, respectively. The simulated SOA levels in VBS-T2 and VBS-MPOLI are similar as the observed OOA ones during R4. Contrary to the CSS and VBS-T1 sim-ulations, all major peaks related to biogenic SOA during R3 are found in VBS-T2 and VBS-MPOLI. Modeled SOA is correlated with the OOA concentrations from 3-factor
5
analysis with correlation coefficients of 0.66, 0.76, 0.87, and 0.91 for CSS, VBS-T1, VBS-T2 and VBS-MPOLI simulations, respectively. The better correlation for VBS-T2 and VBS-MPOLI indicates that it is important to take into account the chemical aging of secondary semi-volatile VOC products. Indeed, VBS-T2 and VBS-MPOLI, having a common simulation at the continental domain which gives the boundary condition of
10
SOA to the nested regional domain, show similar time series. This highlights the im-portant process of the chemical aging of secondary semi-volatile VOC products which forms SOA on a regional scale, affecting the Paris agglomeration especially during regimes of long range transported pollution.
The observed average daily SOA variation is rather flat with a small afternoon peak.
15
This flat diurnal variation indicates that advection of SOA from outside the agglomera-tion is responsible for the major part of SOA in the agglomeraagglomera-tion (see also Freutel et al., 2012). The additional afternoon peak indicates additional locally formed SOA. This peak is more pronounced in VBS-T2 and VBS-MPOLI simulations. On the contrary, in the CSS and VBS-T1 simulations, afternoon SOA values are even lower than the daily
20
average.
Despite this encouraging comparison of VBS-T2 and VBS-MPOLI SOA simulations to OOA, SOA peak values are often overestimated by up to a factor of two during R1, R2 and R3 on 21st and 26th (Fig. 12). This is in contradiction with simulation results reported for Mexico City which show a slight underestimation of the OOA levels
25