www.epjournal.net – 2008. 6(4): 652-666
¯ ¯ ¯ ¯ ¯ ¯ ¯ ¯ ¯ ¯ ¯ ¯ ¯ ¯ ¯ ¯ ¯ ¯ ¯ ¯ ¯ ¯ ¯ ¯ ¯ ¯ ¯ ¯
Original Article
Humor as a Mental Fitness Indicator
Daniel P. Howrigan, Psychology Department, University of Colorado at Boulder, Boulder, CO, USA. Email:
[email protected] (Corresponding author)
Kevin B. MacDonald, Psychology Department, California State University at Long Beach, Long Beach, CA USA.
Abstract: To explain the pervasive role of humor in human social interaction and among mating partner preferences, Miller (2000a) proposed that intentional humor evolved as an indicator of intelligence. To test this, we looked at the relationships among rater-judged humor, general intelligence, and the Big Five personality traits in a sample of 185 college-age students (115 women, 70 men). General intelligence positively predicted rater-judged humor, independent of the Big Five personality traits. Extraversion also predicted rater-judged humor, although to a lesser extent than general intelligence. General intelligence did not interact with the sex of the participant in predicting rating scores on the humor production tasks. The current study lends support to the prediction that effective humor production acts as an honest indicator of intelligence in humans. In addition, extraversion, and to a lesser extent, openness, may reflect motivational traits that encourage humor production.
Keywords: Humor, intelligence, sexual selection, individual differences.
¯ ¯ ¯ ¯ ¯ ¯ ¯ ¯ ¯ ¯ ¯ ¯ ¯ ¯ ¯ ¯ ¯ ¯ ¯ ¯ ¯ ¯ ¯ ¯ ¯ ¯ ¯ ¯ ¯ ¯ ¯ ¯ ¯ ¯ ¯ ¯ ¯ ¯ ¯ ¯ ¯ ¯ ¯ ¯ ¯ ¯ ¯ ¯ ¯ ¯ ¯ ¯ ¯ ¯ ¯ ¯ ¯ ¯ ¯ ¯ ¯ ¯ ¯ ¯ ¯ ¯ ¯ ¯ ¯ ¯ ¯ ¯ ¯ ¯ ¯ ¯ ¯ ¯ ¯ ¯ ¯ ¯ Introduction
required in producing effective humor. More importantly, Miller sees effective humor production as a strategy to communicate underlying genetic quality with respect to psychological traits. Of these traits, general intelligence emerges as one of the most comprehensive and heritable psychological constructs (Jensen, 1998). General intelligence has also been found to show strong correlations to other indicators of genetic quality, such as long-term health (Deary, 2005; Gottfredson and Deary, 2004; Kanazawa, 2006), physiological symmetry (Bates, 2007; Luxen and Buunk, 2006; Prokosch, Yeo, and Miller, 2004), and developmental stability (Thoma et al., 2005). Thus, Miller’s model posits that some of the individual differences in humor production will reflect differences in general intelligence and its underlying genetic fitness. As a result, a preference for humor in potential mates, and a motivation to produce displays of effective humor in courtship and social settings, serves an adaptive purpose because effective humor is an honest and reliable indicator of mental ability and biological fitness (see Miller, 2000a, 2000b, 2000c).
The importance of humor in mate preference is supported in a number of self-report (Buss and Barnes, 1986; Feingold, 1992; Goodwin, 1990; Grammer and Eibl-Eibesfelt, 1990; Hansen, 1977;Regan and Joshi, 2003; Sprecher and Regan, 2002) and experimental (Bressler and Balshine, 2006; Bressler et al., 2006) studies of mating preferences. In addition, mate preferences for intelligence are also well established (Buss, 1989, 1994; Regan and Joshi, 2003). If humor is an honest signal of intelligence and Miller’s model of humor is correct, then intelligence and humor should be positively correlated. However, only two studies have explicitly looked at the relationship between humor and intelligence. Feingold and Mazzella (1991) found a positive correlation between measured verbal intelligence and rater-judged humor production in a college age sample (r = .40). Masten (1986) reported substantial positive correlations among IQ, academic achievement, and rater-judged humor production in 10 to 14-year-old children (r =.50 - .53).
Materials and Methods Participants and procedures
One hundred and eighty-five undergraduate students (115 women, 70 men; Mean age = 22 years, SD = 4.11 years, Range = 18 – 45; 45% Caucasian, 55% Hispanic) from California State University, Long Beach (CSULB), and Saddleback Community College (SCC) voluntarily completed a paper and pencil questionnaire. All students participated in partial fulfillment of course credit. Participants completed the questionnaires under conditions of complete confidentiality and anonymity. The CSULB Institutional Review Board approved all materials and procedures in the study.
Individual difference measures
All participants provided general demographic information such as age, sex, ethnicity, sexual orientation, height, weight, and basic academic history. General intelligence was measured using an 18-item version of the Raven’s Advanced Progressive Matrices (Miller and Tal, 2007; Raven et al., 1998). The Raven’s Progressive Matrices test has been shown to have a high factor loading (.60) with general intelligence (Marshalek, Lohman, and Snow, 1983), and published test reliability scores on the 12-item short form of the Raven’s Advanced Progressive Matrices range from α = .66 to .73, compared to α = .84 for the original 36-item version (Arthur and Day, 1994; Arthur et al., 1999; Raven, Raven, and Court, 1998). Score distributions of the 18-item Raven’s Advanced Progressive Matrices from the samples studied are as follows: CSULB participants (n = 139; Mean score = 10.61, SD = 3.08 years, range = 3 - 18) and SCC participants (n = 46; Mean score = 11.67, SD = 2.86 years, range = 6 - 17). These distributions are very similar to those reported in the normative sample of Arthur, Tubre, Paul, and Sanchez-Ku (1999).
Personality was measured using a 50-item version taken from the International Personality Item Pool (IPIP; Goldberg et al., 2006). Drawing from constructs similar to those in the Revised NEO Personality Inventory (NEO-PI-R; Costa and McCrae, 1982), the IPIP scale assessed the Big-Five personality traits (with corresponding internal consistencies in the current sample): openness (α = .69), conscientiousness (α = .85), extraversion (α = .89), agreeableness (α = .75), and neuroticism (α = .85). All IPIP items used can be found at http://ipip.ori.org/newNEODomainsKey.htm.
Humor production tasks
To measure humor, we used an open-ended response format designed to give the participant the opportunity to display humorous content in a loosely-restricted template. Before engaging in the tasks, participants were instructed to produce humorous content with the knowledge that it would be read and judged by anonymous raters. Participants were asked to complete three different tasks, each designed to measure different aspects of humor production. The latter two tasks were adopted and revised from creativity measures used in Miller and Tal (2007).
occupation, typical day) to help create a mock description of the individual in the photograph. All six individuals portrayed in the character profile task were friends of the author, and gave written consent to use their photograph. None of the individuals portrayed had any knowledge of or relationship to any potential participant currently attending CSULB or SCC.
Figure 1. Sample character profile humor task
_________________________________________________________________________
Portrait inserted here
Name: _______________________________
Occupation: _______________________________
About Me: ________________________________________________________ ________________________________________________________ ________________________________________________________
Hobbies/Activities: __________________________________________________ __________________________________________________ My Typical Day: __________________________________________________ __________________________________________________ __________________________________________________ Philosophy on Life: __________________________________________________
Figure 2. E-mail response humor task
_________________________________________________________________________
For this task, I want you to imagine that you’ve just received an e-mail by a fellow student asking if you could write some responses to the questions posed below. Your fellow student mentions that this is for a school project on the diversity of humorous
responses, and asks that you try to write something funny for each question.
Question 1: “If you could experience what it’s like to be a different kind of animal for a day, what kind would of animal would you not want to be, and why?” Question 2: “How would you make a marriage exciting after the first couple of years?” Question 3: “What do you think the world will be like in a hundred years?”
The third task measured non-verbal humor. Participant’s created a total of eight humorous drawings of different types of animals and people (Figure 3).
Figure 3. Drawing humor task
_________________________________________________________________________
Page 1 (Animal drawings, ¼ page each):
In each of the four spaces below, draw the funniest, most amusing-looking depiction of each animal that you can
Picture 1: Monkey Picture 2: Penguin Picture 3: Octopus Picture 4: Giraffe
Page 2 (Human drawings, ¼ page each):
In each of the four spaces below, draw the funniest, most amusing-looking depiction of each person that you can
Picture 1: Politician Picture 2: Professor Picture 3: Body-builder Picture 4: Artist
Humor judges
Humor ratings
Each participant’s six character profiles, three e-mail response answers, and two pages of humorous drawings (four drawings per page) were rated independently by four judges (two women and two men) on a 1-7 humor scale (e.g., 1 = “not funny at all,” 4 = “Moderately Funny,” and 7 = “Hilarious”). To keep the number of ratings done per judge manageable, ratings were done in blocks, such that each judge provided humor scores for blocks of 22 – 35 participants. All judges were randomly assigned to fill the requisite slots in each rating block. In all, seven rating blocks were used to provide humor scores for the total amount of participants. Humor was not formally defined for the judges.
Results Humor ratings
Looking at the distribution of raw rating scores, the majority of aggregated ratings per participant were quite low (Mean score = 2.31, SD = .625 years, range = 1.27 – 4.25). Distributional properties of the humor ratings showed a slight positive skew and no clear kurtosis. Our first concern was to see if judges were interpreting the 1-7 humor scale in a consistent manner. We first compared the seven rating blocks using a one-way ANOVA, finding a significant difference in raw mean humor scores between rating blocks, F(6, 178) = 19.03 (p = .000). We subsequently looked at raw mean humor scores of the four judges within each rating block, finding significant differences in all seven rating blocks (all ps < .01). In order to correct for differences in scale usage, we standardized all of the ratings given by each judge.
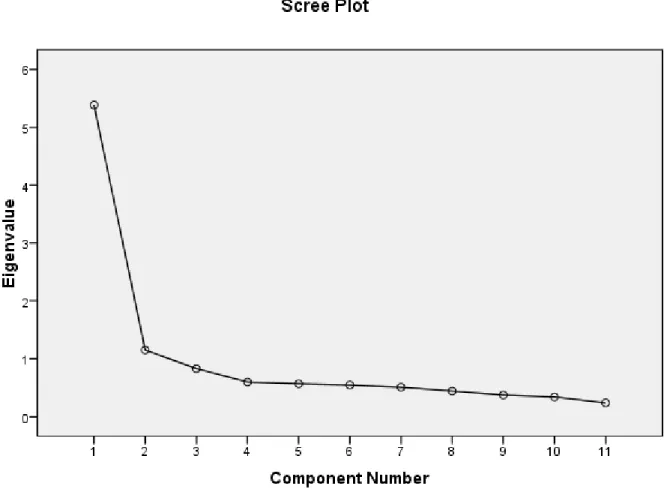
Inter-rater reliabilities were then computed for the four judges within each rating block. We first computed the inter-rater reliability for each of the eleven humor task items individually, finding an average Cronbachs Alpha (α) = .58 and average inter-rater correlation (ri) = .28 across all seven rating blocks. Although these reliabilities are below the commonly accepted reliability criterion for psychological measurements, they are consistent with past humor production measures (Feingold and Mazzella, 1991; Köhler and Ruch, 1996; Masten, 1986), and possibly reflect the varied nature of humor preferences. Next, we looked at inter-rater reliabilities among mean scores of each humor subtask across all seven rating blocks, with α = .72 and ri = .39 for the six character profiles, α = .63 and ri = .32 for the three e-mail responses, and α = .71 and ri = .40 for the two pages of humorous drawings. Finally, we looked at entire humor task including all 11 items, with α = .74 and ri = .42.
Figure 4. Scree Plot on humor item factor loadings (Using Principal Components and Promax rotation)
Table 1. Humor task item loadings from Principal Components factor analysis pattern matrix
n = 185 First factor
(Verbal humor)
Second factor (Drawing humor)
Correlation with Intelligence
Character profile #1 + .85 - .16 .12
Character profile #2 + .88 - .20 .20**
Character profile #3 + .68 + .12 .22**
Character profile #4 + .73 + .14 .20**
Character profile #5 + .69 + .18 .08
Character profile #6 + .63 + .24 .19*
Email response #1 + .24 + .54 .19*
Email response #2 + .18 + .61 .08
Email response #3 + .18 + .51 .16*
Drawing page #1 - .21 + .96 .18**
Drawing page #2 - .12 + .88 .23**
* = significant at p < .05 ** = significant at p < .01
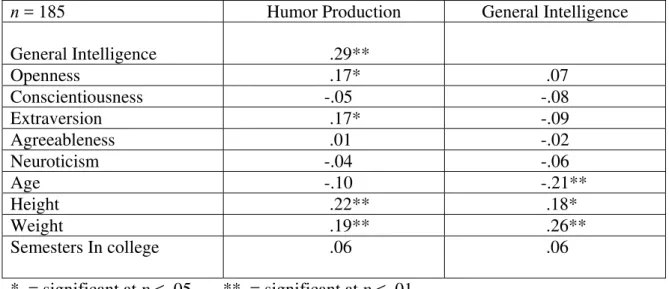
Table 2. Bivariate correlations with humor production and general intelligence
n = 185 Humor Production General Intelligence
General Intelligence .29**
Openness .17* .07
Conscientiousness -.05 -.08
Extraversion .17* -.09
Agreeableness .01 -.02
Neuroticism -.04 -.06
Age -.10 -.21**
Height .22** .18*
Weight .19** .26**
Semesters In college
.06 .06
* = significant at p < .05 ** = significant at p < .01
Bivariate correlations among key variables
significantly and positively correlated with general intelligence, openness, extraversion, height, and weight. None of the variables in Table 2 showed any significant non-linear relationships.
We were interested in the significant correlations of weight and height to humor production, and decided to calculate a body mass index (BMI) variable. Despite the significant correlations in height and weight, BMI did not correlate with humor production,
r(183) = .10, p = .21.
Humor production multiple regression
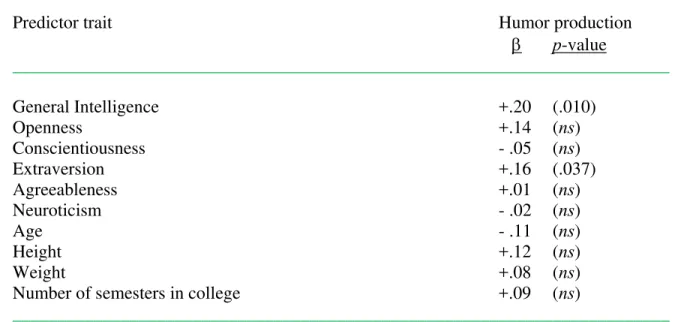
To analyze key predictors of humor production, we entered ten variables into multiple regression: general intelligence, openness, conscientiousness, extraversion, agreeableness, neuroticism, age, height, weight, and number of semesters in college. Standardized beta weights and significance levels are shown in Table 3, with both general intelligence and extraversion being significant and unique predictors of humor production.
Table 3. Predictors of humor production in multiple regression reported with standardized beta weights (and significance levels)
_________________________________________________________________________
Predictor trait Humor production
β p-value
_________________________________________________________________________
General Intelligence +.20 (.010)
Openness +.14 (ns)
Conscientiousness - .05 (ns)
Extraversion +.16 (.037)
Agreeableness +.01 (ns)
Neuroticism - .02 (ns)
Age - .11 (ns)
Height +.12 (ns)
Weight +.08 (ns)
Number of semesters in college +.09 (ns)
_________________________________________________________________________
Sex differences in humor production
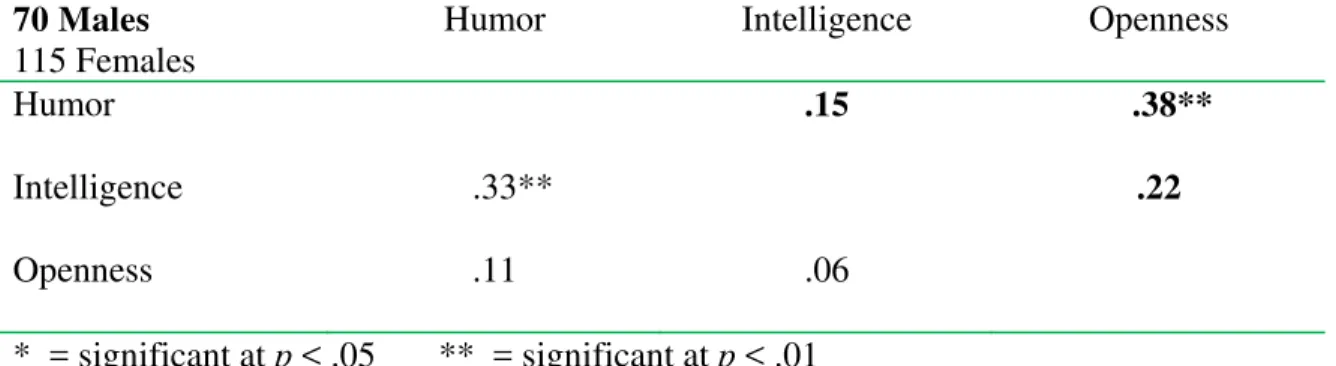
Table 4. Sex differences in bivariate correlations (All male correlations are shown in bold)
70 Males
115 Females
Humor Intelligence Openness
Humor .15 .38**
Intelligence .33** .22
Openness .11 .06
* = significant at p < .05 ** = significant at p < .01
We ran a moderated regression to understand if the relationship of general intelligence to humor production depended on sex. Counter to Miller’s prediction that male displays of humor, being more effective, will have a stronger relationship with general intelligence (Prediction 5 in Miller, 2000c), female intelligence (β = .33, t(113) = 3.70, p = .000) was a stronger predictor of humor than male intelligence (β = .15, t(68) = 1.23, p = .22), although this interaction was not statistically significant (β = -.11, t(181) = -.70, p = .49). We also ran a moderated regression on openness, as it also showed sex differences in the bivariate correlations. Male openness (β = .38, t(68) = 3.33, p = .001) was a stronger predictor of humor than female openness (β = .11, t(113) = 1.13, p = .26), and this interaction was statistically significant (β = .18, t(181) = 2.36, p = .02). This result is more consistent with Miller’s prediction, although openness can only be considered an indirect assessment of intelligence. We should also note that there were no significant interactions with respect to the sex of the judges on any of the relationships to humor production.
Discussion
Consistent with the previous research on humor and intelligence (Feingold and Mazzella, 1991; Masten, 1986), we found that humorous pictures and stories created by individuals higher on general intelligence are rated as being funnier. This result holds after controlling for Big Five personality factors. Although females showed a stronger relationship of humor production to general intelligence than males, which ran counter to our expectations, this difference was not significant.
correlations of humor production to both extraversion and openness may be indicative of tendencies for exploratory behaviors, cognitive flexibility, and desire for novelty found in the higher-order “plasticity” dimension (see DeYoung, Peterson, and Higgins, 2002). This suggests that humor production has a social component distinct from its cognitive relationship, and we speculate that this social component is tied to the motivation to produce humor displays in social contexts.
Our preliminary findings support Miller’s contention that humor evolved as an honest display of general intelligence in humans. In turn, individual differences in humor production taps into the large portion of heritable mental abilities that make up general intelligence, with humor appreciation (as rated by the humor judges in this study) reflecting this association (Miller, 2000a, 2000b, 2000c). However, the low reliability of agreement in rating humor production has been an issue here and in other studies (see Feingold and Mazzella, 1991; Köhler and Ruch, 1996; Masten, 1986). This presents a challenge to Miller’s model that humor appreciation is consistent enough between individuals to reliably indicate any other individual differences in humor producers.
Limitations and future directions
The current study only assessed one particular facet of humor production–written and drawn forms of creative stereotypes and descriptive statements. To preserve participant confidentiality and anonymity, as well as methodological feasibility, ecologically valid aspects of humor production, such as social setting, interpersonal relations, shared knowledge, and spontaneity had to be sacrificed. As a result, participants and judges may have been less motivated to produce and appreciate humor, respectively, leading to decreased power to detect actual individual differences in humor production. Thus, the construct of humor investigated here may give only a partial glimpse into the phenomenon of humor and how it relates to other patterns of individual differences. Future studies investigating more ecologically valid measures of humor (e.g., observational studies) and self-report measures of humor production (see Thorson and Powell, 1993a) would broaden the scope of the current study. In addition, our study did not investigate heritable biological fitness in terms of genetic quality or overall health, and further research on the relationship of humor production to other fitness-related constructs will be necessary to understand the full breadth of humor production as a fitness indicator.
Another limitation came from partitioning humor ratings into blocks instead of having each rater judge the entire sample of humor tasks, which may have weakened the consistency and reliability of the rating process. However, the alternative method of having fewer raters judge the entire sample of humor tasks also has a potential cost of not representing the varied nature of humor preferences, making this issue difficult to resolve without extensive resources. Furthermore, due to the pencil and paper format of the humor tasks, there is a possibility that raters may have inferred the sex of the participant by their penmanship, which may have biased their subsequent rating for the humor task.
may be strategically manipulated to serve different adaptive functions (see Griskevicius et al., 2007).
Summary
The current study serves as an exploratory glimpse into the evolutionary basis of humor. Our findings are consistent with the idea that humor is a signal—an honest advertisement of underlying cognitive ability and fitness—and that it continues to serve this function today. However, much more research will be needed to understand its evolutionary origins and why it is so pervasive in human social interactions.
Acknowledgements: The authors would like to thank Anthony Huntley, Farnaz
Kaighobadi, Matthew Keller, Geoffrey Miller, William Pedersen, and one anonymous reviewer for their valuable insights and suggestions on earlier drafts of this paper. Also, the authors would like to thank Nuria Giralt and Steven Teh for their help with data collection.
Received 18 August 2008; Revision submitted 23 September 2008; Accepted 7 October 2008
References
Alexander, R. E. (1986). Ostracism and indirect reciprocity: The reproductive significance of humor. Ethology and Sociobiology, 7, 253-270.
Arthur, W., and Day, D. V. (1994). Development of a short form for the Raven Advanced Progressive Matrices test. Educational and Psychological Measurement, 54, 394-403.
Arthur, W., Tubre, T. C., Paul, D. S., and Sanchez-Ku, M. L. (1999). College-sample psychometric and normative data on a short form of the Raven Advanced Progressive Matrices test. Journal of Psychoeducational Assessment, 17, 361.
Ashton, M. C., Lee, K., Vernon, P. A., and Jang, K. L. (2000). Fluid intelligence, crystallized intelligence, and the openness/intellect factor. Journal of Research in Personality, 34, 198-207.
Bates, T. C. (2007). Fluctuating asymmetry and intelligence. Intelligence, 35, 41-46.
Bressler, E. R., and Balshine, S. (2006). The influence of humor on desirability. Evolution and Human Behavior, 27, 29-39.
Bressler, E. R., Martin, R. A., and Balshine, S. (2006). Production and appreciation of humor as sexually selected traits. Evolution and Human Behavior, 27, 121-130. Buss, D. M. (1989). Sex differences in human mate preferences: Evolutionary hypotheses
tested in 37 cultures. Behavioral and Brain Sciences, 12, 1-49.
Buss, D. M. (1994). The evolution of desire: Human mating strategies. New York: Basic Books.
Buss, D. M., and Barnes, M. (1986). Preferences in human mate selection. Journal of Personality and Social Psychology, 50, 559-570.
Journal of Humor Research, 15, 245-281.
Costa, P. T., and McCrae, R. R. (1982). Revised NEO Personality Inventory (NEO-PI-R) and NEO Five Factor Inventory (NEO-FFI) professional manual. Odessa, FL: Psychological Assessment Resources.
Deary, I. J. (2005). Intelligence, health and death. The Psychologist, 18, 610-613.
DeYoung, C. G., Peterson, J. B., and Higgins, D. M. (2002). Higher-order factors of the Big Five predict conformity: Are there neuroses of health? Personality and Individual Differences, 33, 533-552.
Feingold, A. (1992). Gender differences in mate selection preferences: A test of the parental investment model. Psychological Bulletin, 112, 125-139.
Feingold, A., and Mazzella, R. (1991). Psychometric intelligence and verbal humor ability.
Personality and Individual Differences, 12, 427-435.
Gervais, M., and Wilson, D. S. (2005). The evolution and functions of laughter and humor: A synthetic approach. Quarterly Review of Biology, 80, 395-430.
Goldberg, L. R., Johnson, J. A., Eber, H. W., Hogan, R., Ashton, M. C., Cloninger, C. R., et al. (2006). The International Personality Item Pool and the future of public-domain personality measures. Journal of Research in Personality, 40, 84-96.
Goodwin, R. (1990). Sex differences among partner preferences: Are the sexes really very similar? Sex Roles, 23, 501-513.
Gottfredson, L. S., and Deary, I. J. (2004). Intelligence predicts health and longevity, but why? Current Directions in Psychological Science, 13, 1-4.
Grammer, K., and Eibl-Eibesfeldt, I. (1990). The ritualization of laughter. In W. A. Koch (Ed.), Naturlichtkeit der Sprake und der Kulture: Bochumer Beitrage zur Semiotic
(pp. 192-214). Bochum, Germany: Brockmeyer.
Greengross, G., and Miller, G. F. (2008). Dissing oneself versus dissing rivals: Effects of status, personality, and sex on the short-term and long-term attractiveness of deprecating and other-deprecating humor. Evolutionary Psychology, 6, 393-408. Griskevicius, V., Tybur, J. M., Sundie, J. M., Cialdini, R. B., Miller, G. F., and Kenrick, D.
T. (2007). Blatant benevolence and conspicuous consumption: When romantic motives elicit costly displays. Journal of Personality and Social Psychology,
93, 85-102.
Hansen, S. L. (1977). Dating choices of high school students. The Family Coordinator,
26, 133-138.
Harris, J. A. (2004). Measured intelligence, achievement, openness to experience, and creativity. Personality and Individual Differences, 36, 913-929.
Jensen, A. R. (1998). The g factor. Westport, CT: Praeger.
Kanazawa, S. (2006). Mind the gap . . . in intelligence: Re-examining the relationship between inequality and health. British Journal of Health Psychology, 11, 623-642. Kaufman, S. B., Kozbelt, A., Bromley, M. L., and Miller, G. F. (2007). The role of
creativity and humor in mate selection. In G. Geher and G. Miller (Eds.), Mating intelligence: Sex, relationships, and the mind’s reproductive system (pp. 227-262). Mahwah, NJ: Erlbaum.
Köhler, G., and Ruch, W. (1996). Sources of variance in current sense of humor inventories: How much substance, how much method variance? Humor: International Journal of Humor Research, 9, 363-397.
the peacock's tail: General intelligence (g) as an honest signal of fitness. Personality and Individual Differences, 41, 897-902.
Marshalek, B., Lohman, D. F., and Snow, R. E. (1983). The complexity continuum in radix and hierarchical models of intelligence. Intelligence, 7, 107 – 127.
Masten, A. S. (1986). Humor and competence in school-aged children. Child Development, 57, 461-473.
Miller, G. F. (2000a). The mating mind: How sexual choice shaped the evolution of human nature. New York: Doubleday.
Miller, G. F. (2000b). Mental traits as fitness indicators: Expanding evolutionary psychology’s adaptationism. In D. LeCroy and P. Moller (Eds.), Evolutionary Perspectives on Human Reproductive Behavior(Annals of the New York
Academy of Sciences, Volume 907) (pp. 62-74). Baltimore, MD: Johns Hopkins
University Press.
Miller, G. F. (2000c). Sexual selection for indicators of intelligence. In G. R. Bock, J. A. Goode, and K. Webb (Eds.), The nature of intelligence (Novartis Foundation Symposium 233) (pp. 260-275). New York: Wiley.
Miller, G. F., and Tal, I. R. (2007). Schizotypy versus intelligence and openness as predictors of creativity. Schizophrenia Research, 93, 317-324.
Prokosch, M., Yeo, R., and Miller, G. F. (2005). Intelligence tests with higher g-loadings show higher correlations with body symmetry: Evidence for a general fitness factor mediated by developmental stability. Intelligence, 33, 203-213.
Provine, R. R. (2000). Laughter: A scientific investigation. New York: Viking.
Provine, R. R. (2004). Laughing, tickling, and the evolution of speech and self. Current Directions in Psychological Science, 13, 215-218.
Raven, J., Raven, J. C., and Court, J. H. (1998). Advanced progressive matrices. Oxford: Oxford Psychologist’s Press.
Regan, P., and Joshi, A. (2003). Ideal partner preferences among adolescences. Social Behavior and Personality, 31, 13-20.
Schmitt, D. P., and Shackelford, T. K. (2008). Big five traits related to short-term mating: From personality to promiscuity across 46 nations. Evolutionary Psychology, 6, 246-282.
Shafer, A. B. (1999). Relation of the Big Five and factor V: Subcomponents to social intelligence. European Journal of Personality, 13, 225-240.
Sprecher, S., and Regan, P. (2002). Liking some things (in some people) more than others: Partner preferences in romantic relationships and friendships. Journal of Social and Personal Relationships, 19, 463-481.
Sroufe, L. A., and Waters, E. (1976). The ontogenesis of smiling and laughter: A perspective on the organization of development in infancy. Psychological Review,
83, 173-189.
Thorson, J. A., and Powell, F. C. (1993a). Development and validation of a Multidimensional Sense of Humor Scale. Journal of Clinical Psychology, 48, 23.
Thoma, R. J., Yeo, R. A., Gangestad, S. W., Halgren, E., Sanchez, N. M., and Lewine, J. D. (2005). Cortical volume and developmental instability are independent predictors of general intellectual ability. Intelligence,33, 27-38.
Journal of Clinical Psychology, 49, 799-809.
Weisfeld, G. E. (1993). The adaptive value of humor and laughter. Ethology and Sociobiology, 14, 141-169.