www.epjournal.net – 2015. 13(1): 167-181
¯ ¯ ¯ ¯ ¯ ¯ ¯ ¯ ¯ ¯ ¯ ¯ ¯ ¯ ¯ ¯ ¯ ¯ ¯ ¯ ¯ ¯ ¯ ¯ ¯ ¯ ¯ ¯
Original Article
Sex Differences in Preferences for Humor: A Replication, Modification, and
Extension
Liana S. E. Hone, Department of Psychology, University of Miami, Coral Gables, FL, USA. Email: [email protected] (Corresponding author).
William Hurwitz, Department of Psychology, University of Miami, Coral Gables, FL, USA. Debra Lieberman, Department of Psychology, University of Miami, Coral Gables, FL, USA.
Abstract: Evolutionary-minded scientists have proposed that humor is a sexually selected
trait in men that signals mate quality. Indeed, women tend to prefer men who make them laugh and men tend to prefer women who laugh at their jokes. However, it is unclear how robust this pattern is. Here we report a replication of one of the first studies (Bressler, Martin, and Balshine, 2006) to examine the sex differences in preferences for humor receptivity versus humor production. We replicate Bressler et al.’s (2006) findings that men prefer women who are receptive to their humor whereas women prefer men who produce humor. These findings held even after we modified Bressler et al.’s questionnaire for better conceptual validity. Furthermore, using a separate measure designed to assess trade-offs, we found that men viewed humor receptivity as a necessity and humor production as a luxury when they were asked to create an ideal long-term partner. For women, it was just the opposite. These results bolster the claim that sexual selection has shaped sex differences regarding preferences for a prospective mate’s sense of humor and that what one means by “sense of humor” can vary.
Keywords: humor production, humor appreciation, sex differences, replication
¯ ¯ ¯ ¯ ¯ ¯ ¯ ¯ ¯ ¯ ¯ ¯ ¯ ¯ ¯ ¯ ¯ ¯ ¯ ¯ ¯ ¯ ¯ ¯ ¯ ¯ ¯ ¯ ¯ ¯ ¯ ¯ ¯ ¯ ¯ ¯ ¯ ¯ ¯ ¯ ¯ ¯ ¯ ¯ ¯ ¯ ¯ ¯ ¯ ¯ ¯ ¯ ¯ ¯ ¯ ¯ ¯ ¯ ¯ ¯ ¯ ¯ ¯ ¯ ¯ ¯ ¯ ¯ ¯ ¯ ¯ ¯ ¯ ¯ ¯ ¯ ¯ ¯ ¯ ¯ ¯ ¯ ¯ ¯ ¯ ¯ ¯ ¯ Introduction
Evolutionary Psychology – ISSN 1474-7049 – Volume 13(1). 2015. -168- stem from a desire for an intelligent long-term mate. Bressler, Martin, and Balshine (2006) predict an asymmetry in the degree to which men and women value signals of intelligence and, thus, humor. Because females invest more in parenting than do males, females tend to be choosier when selecting a mate, particularly for traits indicative of “good genes” (Geary, Vigil, and Byrd-Craven, 2004; Trivers, 1972). Consequently, males have been under intense selection to display traits that females categorize as high quality (Geary et al., 2004; Trivers, 1972). Given that humor requires high-level mental (e.g., linguistic; Feingold and Mazzella, 1991) capacities, women are thought to use humor production as a signal that a man is a mentally capable suitor (Kaufman et al., 2008). The notion that humor production is a sexually selected trait in men suggests there is a corresponding trait in women for detecting and being receptive to humor displays. This leads to the prediction that men and women prefer different aspects of a “sense of humor” in a mate (Bressler and Balshine, 2006; Kaufman et al., 2008). Whereas women might favor men’s ability to produce humor, men might favor women who are sensitive to their humorous displays.
Based on this prediction, Bressler et al. (2006) investigated sex differences in preferences for a mate’s sense of humor. They found that women valued a partner’s general sense of humor and ability to produce humor more than did men. By contrast, men valued a potential partner’s receptivity to humor more than did women. Ultimately, men valued a partner who was receptive to their own humor more than they valued a partner’s ability to produce humor. Bressler et al. (2006) further explored the sex differences in preferences for production versus appreciation of humor across different relationship types: a long-term relationship, a date, a one-night stand, a short-term relationship, and a friendship. They reported a trend such that across relationship types, men preferred humor appreciators whereas women preferred humor producers. More recent research supports these initial findings. For instance, according to studies examining online dating, when searching through profiles, women were more likely than men to look for a humorous mate whereas men more frequently advertised their humor (Whitty, 2008). Furthermore, Wilbur and Campbell (2011) found that compared to men, women reported producing less humor and appreciating humor production more.
In light of previous research and the need to determine the robustness of past findings, we developed a study with three goals. First, we conduct a replication of Bressler et al. (2006), one of the initial studies to report a sex difference in humor preferences. Second, we report on modifications to the original methods of Bressler et al. (2006) to enhance the conceptual validity of the scale used to measure sex differences—an update we hope will be useful for future replications in this area. Lastly, we utilize the methods introduced by Li et al. (2002) to assess the extent to which men and women view humor production and appreciation as luxuries versus necessities when selecting a long-term romantic partner.
Materials and Methods
Participants
Evolutionary Psychology – ISSN 1474-7049 – Volume 13(1). 2015. -169- white, 33.7% Hispanic, 8.4% Asian, 7.2% Black-African American, and 3.6% other). The study was approved by the University of Miami’s Institutional Review Board.
Procedure
After obtaining informed consent, we asked participants to complete a battery of questionnaires. The battery included a set of demographic questions (age, sex, preferred sex of partner, and ethnicity) and the Categorization Questionnaire from Bressler et al. (2006; see Appendix A). The Categorization Questionnaire comprised 14 statements pertaining to the importance of a relationship partner’s sense of humor, receptivity to the participant’s own humor, and production of humor. Participants reported their likeliness to agree or disagree with each statement on a 7-point Likert-type scale ranging from 1 (strongly disagree) to 7 (strongly agree).
The battery also included a forced-choice Preferences Questionnaire adapted from Bressler et al. (2006; see Appendix B), which we used to examine men’s and women’s preferences for humor production or receptivity in an opposite-sex individual across five relationship types: (1) a long-term relationship, (2) a date, (3) a one-night stand, (4) a short-term relationship, or (5) a friendship. The Preferences Questionnaire contained two different vignettes. For each relationship type, participants were asked to select whether they would prefer the vignette describing (1) an opposite-sex individual who makes the participant laugh or (2) an opposite-sex individual who laughs at all the participant’s jokes.
Finally, we included a modified version of Li et al.’s (2002) Trait Purchasing Task (see Appendix C). Participants were instructed to imagine a world in which they could purchase traits to design an ideal long-term romantic partner. We provided participants with only two traits: (1) makes me laugh and (2) finds me humorous. Subjects were given the following information: For each dollar spent on a trait, the mate’s overall percentile or ranking increases by 10% within that category. For example, $6.00 spent on “makes me laugh” would bring the mate up to the 60th percentile within this dimension and $10.00 spent on “makes me laugh” would bring the mate to the 100th percentile—the funniest mate a
person could find. By the same logic, spending nothing on “makes me laugh” would lead to the least funny of all possible mates. Participants were given three different budgets in sequential order to purchase these two traits: $5.00, $10.00, or $15.00.
Statistical analysis
We report on separate analyses for (1) the replication of Bressler et al. (2006), (2) the modification of Bressler et al.’s Categorization Questionnaire, and (3) the methodological extension using the Trait Purchasing Task developed by Li et al. (2002). We provide Cohen’s d as well as 95% confidence intervals. We used IBM SPSS (v21.0) to conduct all analyses. All p-values are two-tailed.
Evolutionary Psychology – ISSN 1474-7049 – Volume 13(1). 2015. -170- that is, whether ratings for each domain were significantly different from neutral (neutral = 4) using one-sample t-tests. We then conducted a 2 x 3 repeated-measures analysis of variance (ANOVA) with one between-group factor (sex: men or women) and one within-group factor (humor type: humor production, humor receptivity, or sense of humor). We followed up the ANOVA with independent samples t-tests with sex as the grouping variable and paired samples t-tests for within-sex comparisons (see also Bressler et al., 2006).
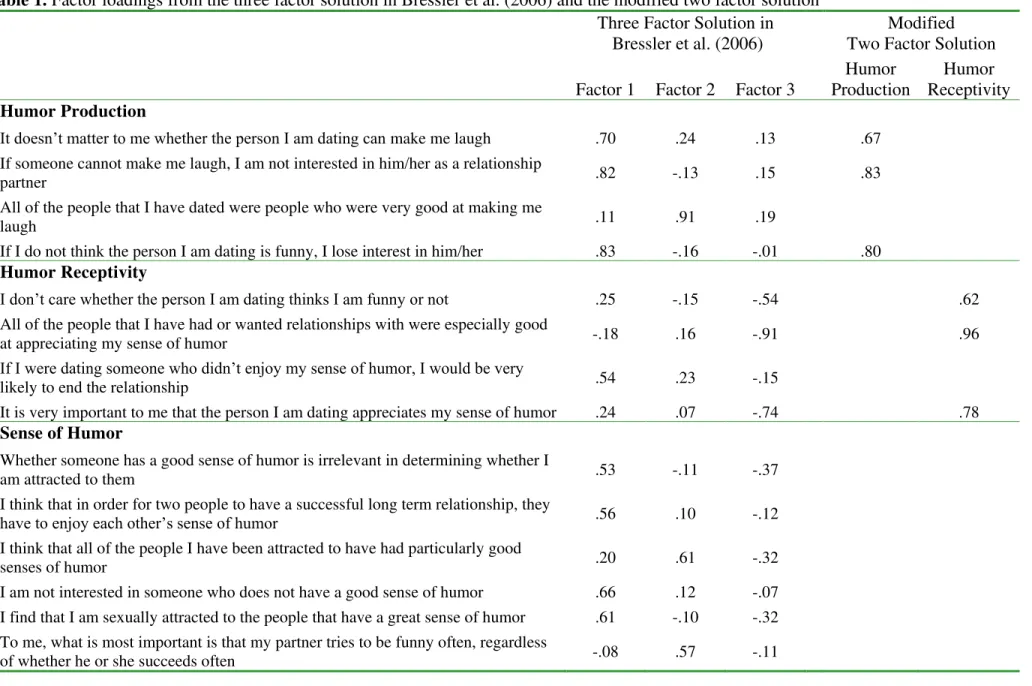
Modification. In addition to the above analyses, we sought to determine the actual factor structure of our data. However, we first removed the six questions relating to a partner’s “sense of humor.” We did this because our hypothesis is that men and women interpret what is meant by “a sense of humor” differently, thus these items add statistical noise. Specifically, we were concerned about the noise introduced by the correlation between these “sense of humor” items and different factors for men and women, not necessarily the magnitude of sex differences in preferences for a sense of humor. We entered the remaining eight items into a factor analysis using principal components and a direct oblimin rotation with Kaiser normalization. We used a conservative criterion of .60 to determine which items loaded on each factor. The pattern matrix is presented in Table 1. Although three factors were found, we retained only two, each with three items (the third factor had only one item loading on it): Importance of a mate’s humor production (three items; α = .76) and importance of a mate’s receptivity to one’s own humor (three items; α = .70; see Table 1). We replicated the analyses listed in the above paragraph using these new factors to assess whether our new factor structure yielded more robust sex differences than the original factor structure.
Evolutionary Psychology – ISSN 1474-7049 – Volume 13(1). 2015. -171-
Table 1. Factor loadings from the three factor solution in Bressler et al. (2006) and the modified two factor solution
Three Factor Solution in Bressler et al. (2006)
Modified Two Factor Solution
Factor 1 Factor 2 Factor 3
Humor Production
Humor Receptivity
Humor Production
It doesn’t matter to me whether the person I am dating can make me laugh .70 .24 .13 .67
If someone cannot make me laugh, I am not interested in him/her as a relationship
partner .82 -.13 .15 .83
All of the people that I have dated were people who were very good at making me
laugh .11 .91 .19
If I do not think the person I am dating is funny, I lose interest in him/her .83 -.16 -.01 .80
Humor Receptivity
I don’t care whether the person I am dating thinks I am funny or not .25 -.15 -.54 .62
All of the people that I have had or wanted relationships with were especially good
at appreciating my sense of humor -.18 .16 -.91 .96
If I were dating someone who didn’t enjoy my sense of humor, I would be very
likely to end the relationship .54 .23 -.15
It is very important to me that the person I am dating appreciates my sense of humor .24 .07 -.74 .78
Sense of Humor
Whether someone has a good sense of humor is irrelevant in determining whether I
am attracted to them .53 -.11 -.37
I think that in order for two people to have a successful long term relationship, they
have to enjoy each other’s sense of humor .56 .10 -.12
I think that all of the people I have been attracted to have had particularly good
senses of humor .20 .61 -.32
I am not interested in someone who does not have a good sense of humor .66 .12 -.07
I find that I am sexually attracted to the people that have a great sense of humor .61 -.10 -.32
To me, what is most important is that my partner tries to be funny often, regardless
Evolutionary Psychology – ISSN 1474-7049 – Volume 13(1). 2015. -172- Extension. For the Trait Purchasing Task we calculated the proportion of dollars within each budget ($5.00, $10.00, and $15.00) participants spent on humor receptivity versus humor production. We conducted a repeated-measures ANOVA to determine whether men’s and women’s expenditures differed across the different budget sizes. We followed up any significant interactions with independent samples t-tests to assess whether men and women significantly differed in the amount they spent on a mate’s humor receptivity across each budget size. We also tested whether the slope of change in mate purchasing dollars that men and women spent on humor receptivity significantly differed from zero. This provides insight into whether a particular trait is considered a necessity (consuming a larger proportion at lower budgets, but smaller proportions as budgets grow) versus a luxury (consuming a smaller proportion at lower budgets, but larger proportions as budgets grow). Finally, we tested whether the slopes of change in mate purchasing dollars spent on humor receptivity across the three budget sizes significantly differed between the sexes.
Results
Replication
Using Bressler et al.’s (2006) factor structure to test whether men and women showed a preference for humor production, humor receptivity, and sense of humor, we conducted six single-sample t-tests. All responses were significantly greater than neutral (see Figure 1, panel A). Men showed a significant preference for: (1) their partner’s receptivity to their own humor (M ± SD = 5.32 ± .86; t[37] = 9.48, p < .001, d = 1.53, 95% CI [1.04, 1.61]); (2) their partner’s ability to produce humor (4.50 ± .85; t[37]= 3.63, p = .001, d = .59, 95% CI [.22, .78]); and, (3) their partner’s general sense of humor (4.98 ± .80; t[37] = 7.56, p < .001, d = 1.23, 95% CI [.72, 1.25]). Similarly, women showed a significant preference for: (1) their partner’s receptivity to their own humor (M ± SD = 5.26 ± .97; t[44] = 8.75, p < .001, d = 1.30, 95% CI [.97, 1.55]); (2) their partner’s ability to produce humor (5.32 ± .86; t[44] = 10.33, p < .001, d = 1.53, 95% CI [.22, .78]); and (3) their partner’s general sense of humor (5.31 ± .89; t[44] = 9.80, p < .001, d = 1.47, 95% CI [1.04, 1.58]).
To test for sex differences in preference for a mate’s humor production, humor receptivity, and sense of humor, we conducted a repeated-measures ANOVA with sex as the between-subjects factor and humor type preference as the within-subjects factor. We found a significant interaction between humor-type and sex, F(1, 81) = 12.18, p = .001. We followed this significant interaction up with three independent samples t-tests with sex as the grouping variable for each humor domain separately. We found that women (M ± SD = 5.32 ± .86) reported a greater preference for partners who produced humor than did men (4.50 ± .85), t(81) = 4.37, p < .001, d = .96, 95% CI [.45, 1.20]. However, the sexes did not differ significantly in their preferences for mates who are receptive to their own humor or in preferences for mates with a general sense of humor.
Evolutionary Psychology – ISSN 1474-7049 – Volume 13(1). 2015. -173-
Figure 1. Men’s and women’s preference for humor production, humor receptivity, and
sense of humor, using Bressler et al.’s (2006) factor structure (A) and the new factor structure reported herein (B)
Modification
We repeated the above analyses using our updated factor structure. We conducted four single-sample t-tests to test whether men and women showed a preference for humor production and humor receptivity (indicated by ratings significantly greater than neutral, which equaled 4). We found that all responses were significantly greater than neutral (see Figure 1, panel B). Men showed a significant preference for: (1) Their partner’s receptivity to their own humor (M ± SD = 5.58 ± .74; t[37] = 13.12, p < .001, d = 2.14, 95% CI [1.34, 1.82]); and (2) their partner’s ability to produce humor (4.63 ± 1.05; t[37] = 3.68, p = .001, d = .60, 95% CI [.28, .97]). Similarly, women showed a significant preference for: (1) Their partner’s receptivity to their own humor (M ± SD = 5.41 ± .96; t[44] = 9.90, p < .001, d = .43, 95% CI [1.13, 1.70]); and (2) their partner’s ability to produce humor (5.39 ± 1.01; t[44]= 9.22, p < .001, d = 1.38, 95% CI [1.08, 1.69]).
Evolutionary Psychology – ISSN 1474-7049 – Volume 13(1). 2015. -174- To test whether men’s and women’s preferences for humor production or receptivity in an opposite-sex partner varies across different types of relationships, we analyzed the proportion of men and women who chose a humor appreciator versus a humor producer. We conducted five 2 x 2 Chi Square tests (corrected for multiple comparisons using Holm’s method; Holms, 1979) examining men’s and women’s preferences for humor producers versus appreciators across each relationship type (long-term relationship, date, one-night stand, short-term relationship, and friendship).
As Figure 2 shows, there were between-sex differences regarding the proportion of men and women who preferred a humor producer when asked to think about a long-term relationship partner (χ2[1] = 7.22, p < .01) and a date (χ2[1] = 14.94, p < .001). Men and women did not significantly differ in their preferences for a humor producer when asked to think about a one-night stand, short-term relationship, or friend. Within-sex analyses revealed that men preferred a date who appreciated humor more so than a date who produced humor, χ2(1) = 8.53, p < .005. Women, on the other hand, preferred a date (χ2[1] = 6.42, p < .05) and a long-term mate (χ2[1] = 6.42, p < .05) who produced humor more so than a date
or long-term mate who was receptive to her humor.
Figure 2. Between-sex differences regarding the proportion of men and women who
preferred a humor producer across various relationship types.
Extension
Evolutionary Psychology – ISSN 1474-7049 – Volume 13(1). 2015. -175- the medium budget expenditures indicate that the proportion spent on receptivity decreased for men, t(37) = 2.20, p = .03, d = .31, 95% CI [.32. 7.75], but not for women.
Another way to analyze these data is to examine the slopes of change in mate purchasing dollars spent on humor receptivity across the three budget sizes. For men, there was a negative slope (M ± SD = –.51 ± 1.51) that significantly differed from zero, t(37)= 2.07, p < .05, d = .34, 95% CI [.01, 1.01]. For women, there was a significant positive slope (M ± SD = .90 ± 1.59), t(42) = 3.72, p = .001, d = .57, 95% CI [.41, 1.39]. Furthermore, the male and female slopes significantly differed from one another, t(79) = 4.07, p < .001, d = 1.57, 95% CI [.72, 2.10] (see Figure 3).
Figure 3. Proportion of budget spent to have a mate who is receptive to one’s own humor.
Discussion
Evolutionary Psychology – ISSN 1474-7049 – Volume 13(1). 2015. -176- appreciate her own humor. Men, by contrast, appear to care more about finding a mate who thinks he’s funny.
More robust sex differences emerge once subjects are asked to make trade-offs. When asked to select either a humor producer or humor appreciator across different types of relationships, women showed a clear preference for wanting someone who produced humor. In Bressler et al. (2006), a significantly larger proportion of women selected a humor producer over a humor appreciator for all relationship types. Here, we only replicate this finding for potential long-term partners. When it comes to short-term relationships and friendships, women don’t show a clear preference for humor producers versus appreciators.
Using the Trait Purchasing Task, we found evidence that men and women make different trade-offs between a long-term romantic partner’s humor receptivity and humor production. Women found humor production more of a necessity and humor receptivity more of a luxury, whereas men found humor receptivity more of a necessity and humor production more of a luxury. This particular task, first used in the domain of mate choice by Li et al. (2002), complements the forced choice task used by Bressler et al. (2006) and replicated here. The benefit of the trait-purchasing task is that it is possible to quantify the extent to which one trait is valued over another. When participants rate desirable traits in a mate one after the other in an unconstrained fashion, they are not forced to make real-world tradeoffs, and this is perhaps why we did not see evidence that women prefer humor production. By contrast, when these traits are bundled, as is the case during the Trait Purchasing Task, participants are forced to assess levels of two traits in a constrained, real-world fashion. This yields less paradoxical results and might indicate that the Trait Purchasing Task, relative to the Categorization Questionnaire, is even more sensitive to assessing preferences for humor production and receptivity.
Limitations
Because our sample comprised relatively young college students with limited dating or relationship experience, it would be interesting to see whether sex differences in preferences for humor production versus appreciation hold in an older sample with longer significant romantic relationships. It would also be interesting to examine sex differences in preferences for humor production versus humor receptivity in actual long-term relationships versus short-term relationships. Those in long-term relationships may, over time, place greater importance upon a mate whose mental traits (i.e., intelligence, creativity, and humor) mirror their own (Regan, Levin, Sprecher, Christopher, and Gate, 2000) as these traits are indicators of strong genetic quality (Gangestad, Garver-Apgar, Simpson, and Cousins, 2007). Moreover, an important control variable might be female fertility status because women who are near ovulation are more attracted to features of men that are desirable in a short-term versus a long-term mate (Gangestad, Simpson, Cousins, Garver-Apgar, and Christensen, 2004; Gangestad et al., 2007).
Conclusion
Evolutionary Psychology – ISSN 1474-7049 – Volume 13(1). 2015. -177-
Received 02 July 2014; Revision submitted 21 November 2014; Accepted 22 November 2014
References
Bressler, E. R., and Balshine, S. (2006). The influence of humor on desirability. Evolution and Human Behavior, 27, 29–39.
Bressler, E. R., Martin, R. A., and Balshine, S. (2006). Production and appreciation of humor as sexually selected traits. Evolution and Human Behavior, 27, 121–130.
Feingold, A., and Mazzella, R. (1991). Psychometric intelligence and verbal humor ability. Personality and Individual Differences, 12, 427–435.
Gangestad, S. W., Garver-Apgar, C. E., Simpson, J. A., and Cousins, A. J. (2007). Changes in women’s mate preferences across the ovulatory cycle. Journal of Personality and Social Psychology, 92, 151–163.
Gangestad, S. W., Simpson, J. A., Cousins, A. J., Garver-Apgar, C. E., and Christensen, P. N. (2004). Women’s preferences for male behavioral displays change across the menstrual cycle. Psychological Science, 15, 203–207.
Geary, D. C., Vigil, J., and Byrd-Craven, J. (2004). Evolution of human mate choice. Journal of Sex Research, 41, 27–42.
Herzog, T. R. (1999). Gender differences in humor appreciation revisited. Humor, 12, 411– 424.
Holm, S. (1979). A simple sequentially rejective multiple test procedure. Scandinavian Journal of Statistics, 6, 65–70.
Howrigan, D. P., and MacDonald, K. B. (2008). Humor as a mental fitness indicator. Evolutionary Psychology, 6, 625–666.
Kaufman, S. B., Kozbelt, A., Bromley, M. L., and Miller, G. F. (2008). The role of creativity and humor in human mate selection. In G. Geher and G. Miller (Eds.), Mating intelligence: Sex, relationships, and the mind's reproductive system, (pp. 227–262). New York, NY: Lawrence Erlbaum Associates.
Li, N. P., Bailey, J. M., Kenrick, D. T., and Linsenmeier, J. A. (2002). The necessities and luxuries of mate preferences: Testing the tradeoffs. Journal of Personality and Social Psychology, 82, 947–955.
Lundy, D. E., Tan, J., and Cunningham, M. R. (1998). Heterosexual romantic preferences: The importance of humor and physical attractiveness for different types of relationships. Personal Relationships, 5, 311–325.
McGee, E., and Shevlin, M. (2009). Effect of humor on interpersonal attraction and mate selection. Journal of Psychology, 143, 67–77.
Miller, G. F. (1998). How mate choice shaped human nature: A review of sexual selection and human evolution. In C. B. Crawford and D. L. Krebs (Eds.), Handbook of evolutionary psychology: Ideas, issues, and applications (pp. 87–129). Mahwah, NJ: Lawrence Erlbaum Associates.
Miller, G. (2000a). The mating mind: How sexual choice shaped the evolution of human nature. New York: Doubleday.
Evolutionary Psychology – ISSN 1474-7049 – Volume 13(1). 2015. -178- Miller, G. (2000c). Mental traits as fitness indicators: Expanding evolutionary psychology’s adaptationism. In D. LeCroy and P. Moller (Eds.), Evolutionary approaches to human reproductive behavior (pp. 62–74). New York Academy of Sciences.
Regan, P. C., Levin, L., Sprecher, S., Christopher, F. S., and Gate, R. (2000). Partner preferences: What characteristics do men and women desire in their short-term sexual and long-term romantic partners? Journal of Psychology and Human Sexuality, 12, 1–21.
Rosen, L. D., Cheever, N. A., Cummings, C., and Felt, J. (2008). The impact of emotionality and self-disclosure on online dating versus traditional dating. Computers in Human Behavior, 24, 2124–2157.
Seltman, H. J. (2012). Experimental design and analysis. Pittsburgh, PA: Carnegie Mellon University.
Sprecher, S., and Regan, P. C. (2002). Liking some things (in some people) more than others: Partner preferences in romantic relationships and friendships. Journal of Social and Personal Relationships, 19, 463–481.
Trivers, R. L. (1972). Parental investment and sexual selection. In B. Campbell (Ed.), Sexual Selection and the Descent of Man (pp. 136–179). Chicago, IL: Aldine Publishing Company.
Whitty, M. T. (2008). Revealing the “real” me, searching for the “actual” you: Presentations of self on an internet dating site. Computers in Human Behavior, 24, 1707–1723. Wilbur, C. J., and Campbell, L. (2011). Humor in romantic contexts: Do men participate and
women evaluate? Personality and Social Psychology Bulletin, 37, 918–929.
Appendix A: Categorization Questionnaire
Humor Production.
1. It doesn’t matter to me whether the person I am dating can make me laugh.
2. If someone cannot make me laugh, I am not interested in him/her as a relationship partner.
3. All of the people that I have dated were people who were very good at making me laugh.
4. If I do not think the person I am dating is funny, I lose interest in him/her. Humor Receptivity.
5. I don’t care whether the person I am dating thinks I am funny or not.
6. All of the people that I have had or wanted relationships with were especially good at appreciating my sense of humor.
7. If I were dating someone who didn’t enjoy my sense of humor, I would be very likely to end the relationship.
8. It is very important to me that the person I am dating appreciates my sense of humor. Sense of Humor.
9. Whether someone has a good sense of humor is irrelevant in determining whether I am attracted to them.
10.I think that in order for two people to have a successful long term relationship, they have to enjoy each other’s sense of humor.
Evolutionary Psychology – ISSN 1474-7049 – Volume 13(1). 2015. -179- 12.I am not interested in someone who does not have a good sense of humor.
13.I find that I am sexually attracted to the people that have a great sense of humor. 14.To me, what is most important is that my partner tries to be funny often, regardless
of whether he or she succeeds often.
Appendix B: Preferences Questionnaire
Female Version. Please read each of the following scenarios, trying to picture the situation described as best you can. After you have finished reading each scenario, please answer the questions below. If you have any questions, please feel free to ask the experimenter.
Imagine that you are in a situation in which you are choosing between two potential dating partners. In all respects they are equal; they are equally physically attractive, intelligent, interesting, friendly, compassionate, caring, and so on. There are only two differences between them: in how much they make you laugh when they joke around, and in how much they laugh at you when you joke around.
MAN A: The first man is great at making you laugh. He is witty, and his humor reveals that he obviously looks at things in much the same way as you. However, he doesn’t laugh all that much when you joke around. He listens attentively to you, but when you joke around, you rarely get more than a smile from him.
MAN B: The second man laughs at all your jokes. He obviously enjoys listening to you, and thinks that you are a very funny person. However, you don’t find his jokes all that funny. It’s not that you find him offensive or that you don’t get his jokes, it’s simply that he rarely makes you laugh.
Please circle which of these individuals you would prefer to be with for the following types of relationships:
1. Circle if you would rather be in a short-term relationship with: MAN A MAN B
2. Would you rather be in a long-term relationship with: MAN A MAN B
3. Would you rather be a friend with: MAN A MAN B
4. Would you rather have a one-night stand with: MAN A MAN B
5. Would you rather go on a date with: MAN A MAN B
Male Version. Please read each of the following scenarios, trying to picture the situation described as best you can. After you have finished reading each scenario, please answer the questions below. If you have any questions, please feel free to ask the experimenter.
Evolutionary Psychology – ISSN 1474-7049 – Volume 13(1). 2015. -180- WOMAN A: The first woman is great at making you laugh. She is witty, and her humor reveals that she obviously looks at things in much the same way as you. However, she doesn’t laugh all that much when you joke around. She listens attentively to you, but when you joke around, you rarely get more than a smile from her.
WOMAN B: The second woman laughs at all your jokes. She obviously enjoys listening to you, and thinks that you are a very funny person. However, you don’t find her jokes all that funny. It’s not that you find her offensive or that you don’t get her jokes, it’s simply that she rarely makes you laugh.
Please circle which of these individuals you would prefer to be with for the following types of relationships:
1. Circle if you would rather be in a short-term relationship with:
WOMAN A WOMAN B
2. Would you rather be in a long-term relationship with:
WOMAN A WOMAN B
3. Would you rather be a friend with:
WOMAN A WOMAN B
4. Would you rather have a one-night stand with:
WOMAN A WOMAN B
5. Would you rather go on a date with:
WOMAN A WOMAN B
Appendix C: Trait Purchasing Task
You are asked to enter an imaginary world where you will be asked to create an ideal long-term romantic partner. You will be given only two traits and asked to spend money to create your ideal long-term romantic partner. For each dollar you spend on a trait, you increase your mate’s ranking by 10% within that category. So, for instance, if you spend $5 on the trait “Makes me laugh,” you would get a mate that was in the 50th percentile for this trait. If you spend $10 on the trait “Makes me laugh” your mate would be in the 100% percentile for this trait--the funniest mate a person could find. By the same logic, if you did not spend any money on the trait “Makes me laugh,” your mate would be the least funny of all possible mates.
It is up to you how you spend your money. For this first task, you only have two traits to consider (and purchase). They are “Makes me laugh” and “Finds mehumorous.” “Makes me laugh” refers to your mate’s ability to make you laugh. “Finds me humorous” refers to your ability to make your mate laugh.
Think about each trait, how important each trait is to you and then spend your money to create your ideal long-term romantic partner. You will be asked to perform this exercise across three different budgets, $5.00, $10.00, and $15.00. For each budget, start from scratch and spend your money how you see fit. As your budget increases, so too does your ability to “purchase” traits.
MATE DOLLARS = $5 MUST SPEND ALL $5 PERCENTILE Makes me laugh Finds me humorous
0% $0 $0
10% $1 $1
Evolutionary Psychology – ISSN 1474-7049 – Volume 13(1). 2015. -181-
30% $3 $3
40% $4 $4
50% $5 $5
60% $6 $6
70% $7 $7
80% $8 $8
90% $9 $9
100% $10 $10
MATE DOLLARS = $10 MUST SPEND ALL $10
PERCENTILE Makes me laugh Finds me humorous
0% $0 $0
10% $1 $1
20% $2 $2
30% $3 $3
40% $4 $4
50% $5 $5
60% $6 $6
70% $7 $7
80% $8 $8
90% $9 $9
100% $10 $10
MATE DOLLARS = $15 MUST SPEND ALL $15
PERCENTILE Makes me laugh Finds me humorous
0% $0 $0
10% $1 $1
20% $2 $2
30% $3 $3
40% $4 $4
50% $5 $5
60% $6 $6
70% $7 $7
80% $8 $8
90% $9 $9