REVALIDATION OF THE ACADEMIC QUALITY OF LIFE
QUESTIONNAIRE FOR STUDENTS ATTENDING PORTUGUESE
POLYTECHNIC HIGHER EDUCATION INSTITUTIONS
M. Ferreira
1, S. Campos
1, R. Guiné
2, J. Duarte
1, J.L. Abrantes
3, L. Cabral
11Escola Superior de Saúde, Instituto Politécnico de Viseu (PORTUGAL) 2Escola Superior Agrária, Instituto Politécnico de Viseu (PORTUGAL)
3Escola Superior de Tecnologia e Gestão, Instituto Politécnico de Viseu (PORTUGAL)
Abstract
Introduction: School dropout is a problem that affects higher education and the schools that are part of this educational system. School dropout has increased over time and is closely connected with students’ Quality of Academic Life.
Objectives: To test the factorial structure of the Questionnaire of Academic Experience for Portuguese higher education students.
Methodology: Quantitative, cross-sectional, descriptive and correlational study. A student socio-demographic background questionnaire and Almeida Soares and Ferreira’s Academic Experiences Questionnaire (QAE) (2002) were used as data collection instruments. The sample consists of 891 students aged between 17 and 40 years, with a mean age of 19.68 years (± 2.34 years).
Results: The QAE designed by Almeida, et al. (2002), after validation, was composed of 35 items. Confirmatory factorial analysis demonstrates the validity of its structure in five dimensions: personal, study, interpersonal, career and institutional. Statistics on Quality of Academic Life have an average index of 60.46%; ± 10.02 sd. Female students show higher rates in dimensions such as: personal quality of life, profession/career, study, institutional, and overall quality of life. Male students show higher mean values in the quality of life, interpersonal and career dimensions
Conclusions: The results of the present study support the psychometric adequacy of the QAE Almeida, et al. (2002) designed for the Portuguese population, indicating that it can be used in tests conducted in this field of knowledge.
Keywords: Academic Quality of Life; Higher Education.
1 INTRODUCTION
Transition from secondary education to higher education is a complex phase that students have to face. This is mainly caused by external factors and changes in lifestyles which can often lead to mental health issues, like emotional problems, depression and distress, among others [1].
Many students entering higher education have positive expectations in regard to academic experiences. However, the confrontation between images and expectations created and built over the last years of secondary education do not always coincide with reality and this discovery can interfere with the quality of the academic life they experience in this new stage of their lives. It is during the attendance of their first year that students tend to experience the deepest disappointment: expectations previously formed about higher education are frequently broken, students have difficulties adjusting to this new reality and their school performance drops. In many cases this set of circumstances leads to school dropout [2]. The same authors stress that academic and social demands, associated with personal requirements, support the construction of strategies that will help solve problems and tasks related to personal, interpersonal and academic management. Thus, entering higher education represents the chance to focus on personal projects, even though this goal will always require the resolution of personal and contextual discontinuities.
The relationship between higher education institutions and students has been widely and continuously studied to meet students’ needs, to make their integration easier and to ensure their well-being and quality of life. That way, academic achievement should value not only scientific knowledge, but also other contexts of life, namely, leisure, training, work, sport, and culture, because students’ quality of
academic life depends especially on the quality of the pedagogical and institutional experiences and on the conditions provided by any higher education institution[3].
Previous research reveals that students' satisfaction has a positive impact on their motivation, their loyalty and recruitment, making it a critical need for universities to satisfy [4].
Hence, the quality of academic life can be assessed in terms of feelings of global satisfaction with the student's life experience in his school environment. Students’ satisfaction with academic management, social action, services and facilities has a significant influence on their quality of academic life [5], [6]. Harvey [7] claims that it is important to collect feedback from students about how satisfied they are with different aspects of their university related to academic management, learning support facilities (e.g. libraries and computer centers), physical facilities (e.g. classrooms, laboratories, social spaces), social facilities (e.g. cafeterias, student accommodation, healthcare centers, sports centers and student services) and also external aspects related to the student (i.e. finance and transports). All these parameters are of crucial importance to assess the quality of academic life [8].
Pedro [9] states that "the increasing importance attached to the quality of academic life should not strictly focus on the students’ schooling path and their subsequent graduation, but must, above all, be directed towards an evolutionary process of learning based on the totality of the experiences deriving from all the dynamics and from all the extracurricular associative, civic, cultural, sports, social, laboral, technical, scientific and research initiatives carried out both inside and outside their higher education institution”. The quality of academic life must be an integral part of the strategy, mission, vision and values of the institution that welcomes the student.
Thus, this study aims to test the factorial structure of the quality of academic life scale for Portuguese higher education students.
2 METHODOLOGY
In order to assess and refine the measuring instruments, statistical procedures are commonly used. Researchers conduct reliability studies (studies on the internal consistency of the items, for instance) and validity studies, particularly exploratory factor analysis (EFA) and confirmatory factor analysis. The objective is to determine the number and the nature of the latent variables (factors) that best represent a set of observed variables (manifest variables).
2.1 Participants
For this study, a descriptive, correlational and analytical research was outlined, based on a non-probability convenience sampling consisting of 891 students who were attending the 1st year of higher education. They were between 17 and 40 years (mean = 19,68 years ± 2.34 years). Male students represent 31.8% of the sample and female students represent 68.2%.
2.2 Instrument
We tried to confirm the validity of the factor structure of the Quality of Academic Life Scale for Portuguese higher education students.
To understand and operationalize the personal, interpersonal and institutional processes experienced by the students as they enter higher education, we used a shortened version of the Academic Experience Questionnaire (AEQ), built and validated by Almeida, Ferreira and Soares [10] that allowed us to assess Portuguese students’ adjustment to higher education.
This shortened version of the AEQ offers a set of fields to assess and of items sorted by dimensions based on the students ' own answers. The definitive questionnaire consists of 60 items, in a five-point Likert format (1-Strongly disagree, never; 2- Disagree, seldom; 3- Sometimes agree and sometimes disagree, sometimes; 4- Agree, very often; 5- Strongly agree, always), grouped in five dimensions (personal, interpersonal, career, study and institutional).
The Personal dimension includes 13 items associated with personal perceptions of well-being and self-esteem and with other facets of the student’s self and identity [11]. The second dimension, the
Interpersonal dimension, includes items related to the student’s ability to establish friendly and
intimate relationships and his involvement in social or/and associative extracurricular activities. These aspects are systematized in a set of interpersonal factor depicting the student’s academic adaptation
and will integrate 13 items [11]. Taking into account the content of its items, the third dimension, the
Career dimension, mainly assesses the student’s adaptation to the course and his career projects.
Consisting of 13 items, this factor focuses on the students’ satisfaction with the course they attend, the perceptions of socio-professional achievement provided by their course and the existence of a vocational project related to the course. The fourth dimension comprises items associated with the
study and time management. In other words, the behaviors that are assessed refer to curricular and
learning situations. This QAE dimension includes 13 items that describe the competences and study procedures, the use of the library and other learning resources. The last dimension integrates a set of items related to the student’s adaptation to the institution. This dimension, the Institutional dimension, contains 8 items associated with the student's interest in the institution he attends, his willingness to continue his education in this institution or his perception of the quality of the services and facilities provided by the institution to its students [11].
2.3 Procedures for data analysis
A socio-demographic background questionnaire and the Quality of Academic Life Scale for Portuguese higher education students were applied. The purpose of the study was to test the factorial structure of the Quality of Academic Life Scale for Portuguese higher education students.
That way, the study of the homogeneity of the test items, i.e. internal consistency, was performed with determination of the Cronbach's alpha coefficient for each item and for the total scale. The validity studies included the exploratory factor analysis that was performed using principal component analysis and a VariMAX orthogonal rotation.
The confirmatory factor analysis was performed using AMOS 24 (Analysis of Moment Structures) software. For factorial validity, the quality of overall fit for the factorial model and for the quality of local fit was considered.
The quality of overall fit was assessed through the following global goodness of fit indexes with the following reference values: x ² statistic ratio and degrees of freedom (x ²/DF), Values < 5 good fit; Comparative Fit Index (CFI) and Goodness of Fit Index (GFI): values > = 0.90 are considered good fit values; As for Root Mean Square Error of Approximation (RMSEA), Residual Root Mean square (RMR) and Standardized Root Mean Squared Residuals (SRMR), the lower the values, the better. Values below 0.08 are considered adequate [12].
The quality of the local fit was assessed by the factorial weights of each item (λ) and the individual reliability of the items (δ). A factor saturation above 0.50 and individual reliability above 0.25, respectively are accepted as reference values.
The fitness of the model was achieved using the modification indexes (higher than 11; p ˂ 0.001) produced by AMOS and based on theoretical considerations.
Composite reliability (CR) was assessed using standardized Cronbach's α for each factor. Consistency will be adequate when α is above 0.7. Convergent validity was assessed through Average Variance Extracted (AVE) and values above 50 are indicative of good convergent validity [12].
Discriminant validity of the factors was assessed by comparing the AVE for each factor with the square of Pearson’s correlation. Discriminant validity exists when the squared correlation between the factors is below the AVE for each factor.
2.4 Ethical procedures
The ethics committee of the institution where the data were collected gave favorable opinion on the study.
All participants in the study were provided with the necessary information and they were also asked to sign the informed consent form. The anonymity and confidentiality of the data were ensured and its autonomy was respected.
They were also informed that their participation was totally free, that they could leave the study at any time and that their participation would not imply any kind of payment or would not cause them any potential ham.
3 RESULTS
The psychometric study on the quality of academic life scale began with the determination of the statistics for each item. The analysis of their internal consistency was the next step.
The results in Table 1 show the statistics (means and standard deviations) and the correlations obtained between each item and the total scale. The mean indexes and their standard deviations are centered, since they are all above the class midpoint, which represents a good quality of academic life.
Table1. Internal consistency of the QAL Scale- Quality of Academic Life
Items Mean Standard Deviation Correlation Item/ total R2 a 1 I make friends easily at school. 3.56 0.909 0.315 0.411 0.869 2 I believe the career I chose will allow me to accomplish my
personal values (reputation, stability, solidarity…). 3.85 0.795 0.434 0.404 0.868 3 I wouldn’t leave this Polytechnic Institute even if I could. 3.54 1.149 0.303 0.442 0.869 4 I experience sudden mood swings. 2.98 1.463 0.113 0.174 0.874 5 Looking back, I am able to identify the reasons that made
me choose this course. 3.93 0.925 0.405 0.520 0.868
6 I realize I don’t go out much with my school mates. 2.92 1.061 0.274 0.306 0.870 7 The course I attend was a good choice. 3.91 0.951 0.444 0.628 0.867 8 I have the right skills to succeed in the field I chose. 3.73 0.855 0.439 0.492 0.868
9 I feel sad or down. 2.74 1.202 0.317 0.570 0.869
10 I can effectively manage my time. 3.08 0.882 0.249 0.357 0.870 11 Lately, I have felt disoriented and confused. 2.77 1.141 0.328 0.576 0.869
12 I like my school. 3.81 0.906 0.384 0.483 0.868
13 There are situations in which I feel I am losing control. 2.94 1.083 0.272 0.437 0.870 14 I feel I am part of the course I attend. 3.73 0.830 0.500 0.538 0.867 15 I am familiar with the services provided by my Polytechnic
Institute. 3.28 0.880 0.252 0.245 0.870
16 I would like to graduate from the institution I am currently
attending. 4.03 1.004 0.376 0.456 0.868
17 Lately I have become a much more pessimistic person. 2.87 1.206 0.309 0.484 0.869 18 The choice of my course was influenced by the grades
required. 2.97 1.236 0.164 0.178 0.872
19 My schoolmates have been important to my personal
growth. 3.52 0.972 0.275 0.408 0.870
20 My academic option is clearly meeting my expectations. 3.54 0.842 0.489 0.527 0.867 21 I feel tired and sleepy during the day. 3.08 1.105 0.031 0.295 0.873 22 I believe my course will bring me professional fulfillment. 3.83 0.885 0.470 0.528 0.867
23 I feel self-confident. . 3.50 0.916 0.324 0.380 0.869
24 I feel I have a great group of friends at school. 3.82 0.996 0.309 0.545 0.869 25 I feel in good shape and I feel I have a good work rhythm. 3.32 0.830 0.336 0.452 0.869 26 I feel that lately I have been drifting apart from my
schoolmates. 2.83 1.240 0.362 0.537 0.868
27 I have made good friends among my coursemates. 3.79 0.960 0.338 0.532 0.869 28 I feel distressed from time to time. 2.89 1.105 0.377 0.526 0.868 29 I often go to the school library. 2.93 1.193 0.155 0.205 0.872 30 It’s hard to find a schoolmate who is willing to help me with
a personal problem. 2.78 1.187 0.279 0.405 0.870
Items Mean Standard Deviation Correlation Item/ total R2 a 32 I make a plan of the things I have to do every day. 2.77 1.151 0.153 0.294 0.872 33 I have developed close friendly relationships with both
boys and girls. 3.67 0.977 0.358 0.421 0.869
34 My school assignments are always completed on due
time. 3.10 0.889 0.326 0.372 0.869
35 My inability to effectively manage my priorities is the main
cause of my poor grades. 2.86 1.070 0.230 0.371 0.870
36 When I meet new schoolmates, I don’t feel it hard to
engage in a conversation. 3.22 0.976 0.257 0.294 0.870
37 I chose the course that best fits my skills and abilities. 3.73 0.942 0.462 0.561 0.867 38 People say I am a nice and friendly person. 3.80 0.910 0.322 0.340 0.869 39 I think about a lot of things that make me sad. 2.93 1.139 0.276 0.410 0.870 40 I try to hang out with my schoolmates even beyond our
regular school hours. 3.68 0.931 0.246 0.495 0.870
41 I know how to set priorities when it comes to manage my
time. 3.42 0.874 0.365 0.403 0.869
42 I often take the initiative to ask my friends out. 3.41 1.031 0.199 0.463 0.871 43 My friendships are more and more stable, lasting and
independent. 3.58 0.931 0.340 0.483 0.869
44 I am able to take decent notes during classes. 3.43 0.911 0.370 0.406 0.869
45 I feel weak physically. 2.82 1.208 0.344 0.496 0.869
46 I have no interest whatsoever in the school I attend. 2.80 1.252 0.261 0.567 0.870 47 I can effectively prepare to take my exams. 3.18 0.816 0.294 0.371 0.870 48 My school library is well-equipped. 3.38 0.925 0.210 0.247 0.871 49 I focus on systematizing and organizing the information I
get during my classes. 3.48 0.832 0.386 0.439 0.868
50 I like the city where my school is located. 4.00 0.955 0.375 0.392 0.868 51 I feel disappointed with my course. 2.69 1.398 0.222 0.621 0.871 52 It is hard for me to make decisions. 2.83 1.026 0.206 0.329 0.871
53 I have good study skills. 3.31 0.799 0.338 0.423 0.869
54 My personal tastes were decisive when I chose the course
I wanted to attend. 3.77 0.999 0.367 0.475 0.868
55 I have been anxious lately. 2.95 1.102 0.173 0.358 0.871
56 This is the course I always dreamed of 3.30 1.147 0.346 0.424 0.869
57 I am always punctual. 3.51 1.100 0.250 0.308 0.870
58 My Polytechnic Institute offers good facilities. 3.68 0.850 0.327 0.338 0.869 59 I have trouble establishing intimate relationships with my
schoolmates. 2.79 1.215 0.239 0.407 0.870
60 I wouldn’t attend a different course, even if I could. 3.66 1.191 0.393 0.469 0.868
Split-half Coefficients First half = 0.788
Second half = 0.764
Global Cronbach’s Alpha Coefficient 0.871
The study of the internal consistency for the 60 items showed a global Cronbach's Alpha of 0.871. Evidence showed that several items (4, 18, 21, 29, 32, 42 and 55) had a correlation value below 0.20. Those items should therefore be discarded. However, we decided to keep them and submitted the 60 items to exploratory factor analysis using the main component method, with orthogonal VariMAX rotation with latent roots above 1. The items saturation criteria used values equal to or greater than 0.40. Twelve factors, that explained 55.89% of the total, were kept.
Forced to 5 of the factors, the percentage of variance explained changed to 41.84%, but the structure differed from that designed by the author who had adapted the scale to the Portuguese population. Hence, confirmatory factor analysis was carried out, but based on the structure offered by that author. We tested the pentafactorial solution of this scale. The details related to multicollinearity and to univariate and multivariate values that could influence factor analysis were analyzed. We determined the sensitivity of the items using skewness and kurtosis. The results revealed that they were within the reference parameters with skewness absolute values ranging between 0.422 and 1.052 and kurtosis values ranging from 0.060 to 0646 and with a Mardia multivariate coefficient of 1.521.
Evidence showed that the trajectories of the items with their corresponding factors are statistically significant. Items 23, 6 and 46 were an exception and were therefore discarded. Items 4, 21, 23 and 55 included in factor 1, items 6, 30, 36 and 59 in factor 2, items 18 and 51 in factor 3, items 29, 31, 32, 35 and 57 from factor 4 and items 15, 46 , 48, 50 and 58 were discarded because they showed factor weights below 0.50.
All items with saturation values below 0.50 and reliability values below 0.25 were discarded in subsequent analysis. The overall goodness of fit indexes of the confirmatory factor analysis for the first model presented an appropriate fit for χ2/gl. = 2.992 and RMSEA = 0.067 and a poor fit for GFI = 0.682, CFI = 0.654; RMR = 0.129 and SRMR = 0.101.
The model was refined based on the modification indexes proposed by AMOS, correlating some errors, and the items that presented saturation values below 0.50 were discarded. With this procedure, it became clear that all overall fit indexes were now very appropriate, with the exception of GFI, which had an acceptable fit at best: χ2/G.L. = 1.905; GFI = 0.886; CFI = 0.912; RMSEA = 0.045; RMR = 0.049; SRMR = 0.052.
As a consequence, in factor 1, items 4, 21, 23 and 55 were discarded; in factor 2, the same happened to items 6, 30, 36, 42 and 59; in factor 3, to items 14, 46, 48, 50 and 58; in factor 4, to items 10, 29, 31 , 32, 35 and 57 and in factor 5, to 5 items 7, 18, 51, 54 and 56.
Figure1. Model with modification index
Since correlational values between factors were quite high, they suggested the existence of a second-order factor. So, a hierarchical structure was proposed with a second-second-order factor we called Quality of Academic Life. Figure 1 represents the final model obtained. It became clear that the Personal factor shows a 2.0% variability which expresses a negative correlation; the Interpersonal factor shows a 43.0% correlation, the Career factor a 85.0% correlation, the Study factor a 38% correlation and the last factor (Institutional) reveals a 62.0% correlation. In this model, the overall goodness of fit values
are slightly different from those recorded in the second model, but they still continue to demonstrate a high factor validity of the quality of academic life scale.
Figure 2. Second-order model
Table 2 shows the overall goodness of fit indexes. As we can observe, values were inadequate in the initial model, however in the final and refined model, GFI is the only factor that exhibits a moderate fit index.
Table 2. Overall goodness of fit indexes
Model x2/gl GFI CFI RMSEA RMR SRMR
Initial Model 2.992 0.682 0.654 0.067 0.129 0.101
Model with modification Index 1.905 0.886 0.912 0.045 0.049 0.052
Second-order Model 1.902 0.885 0.911 0.045 0.050 0.053
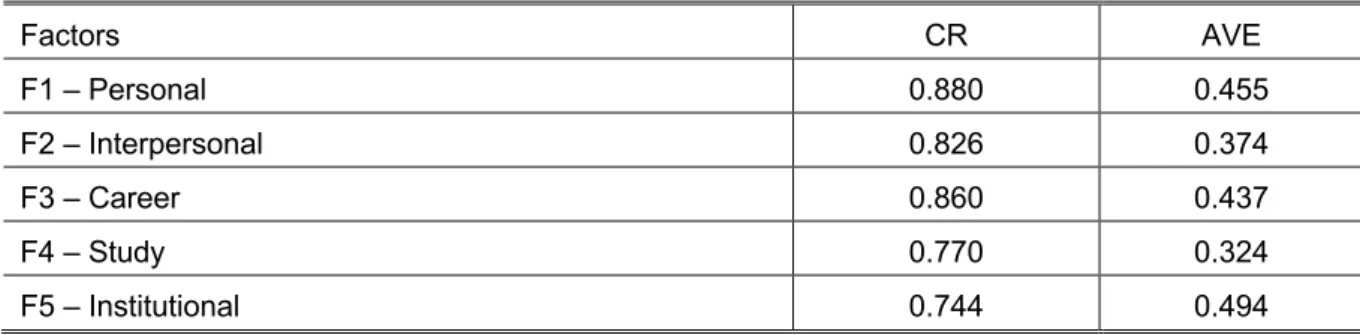
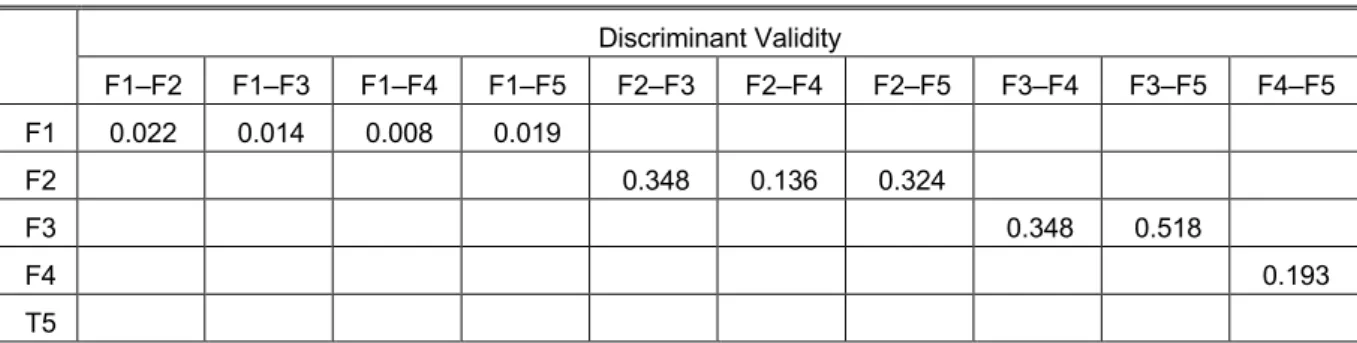
Table 3 shows the results of composite reliability (CR) and the Average Variance Extracted (AVE), and table 4 presents the discriminant validity (DV). The composite reliability of the factors is higher than the reference value (0.70). The average variance extracted, in turn, indicates the existence of divergent validity in all the factors. It should also be noted that the stratified coefficient is high (0.959) with AVE slightly below the recommended (AVE = 0.409).
Table 3. Composite Reliability and Average Variance Extracted of the QAL scale- Quality of Academic Life
Factors CR AVE F1 – Personal 0.880 0.455 F2 – Interpersonal 0.826 0.374 F3 – Career 0.860 0.437 F4 – Study 0.770 0.324 F5 – Institutional 0.744 0.494
As far as discriminant validity is concerned, one might say that the least expressive results are those that describe the correlation between factor 3 and factor 5.
The instrument seems to be appropriate in this sample, so it may represent another valuable resource for the present study.
Table4. Discriminant Validity of the QAL Scale- Quality of Life Discriminant Validity F1–F2 F1–F3 F1–F4 F1–F5 F2–F3 F2–F4 F2–F5 F3–F4 F3–F5 F4–F5 F1 0.022 0.014 0.008 0.019 F2 0.348 0.136 0.324 F3 0.348 0.518 F4 0.193 T5
After completing the study of the scale, we present the study of internal consistency for each subscale of items.
In factor 1 (Personal), mean values reveal the homogeneity of the answers given to the different items, since scores range between 2.74 ± 1.202 in item 9 and 2.94 ± 1.083 in item 13. Cronbach's alpha coefficients show a good internal consistency: item 9 represents the lowest value with α = 0,846 and the highest value α = 0,861 is found in Item 39.
In factor 2 (Interpersonal), mean values show the homogeneity of the answers given to the different items, since the scores obtained range between 3.52 ± 0.972 in item 19 and 3.82 ± 0.996 in item 24. Cronbach's alpha coefficients reveal a good internal consistency, with the lowest value α = 0,803 found in item 24 and the highest value α = 0,830, in item 38.
The analysis of the results obtained for factor 3 (Career) proves that the mean indices range between 3.54 ± 0.842 in item 20 and 3.93 ± 0.925 in item 5. Cronbach's alpha coefficients indicate good internal consistency, with the lowest value α = 0,832 found in Item 22 and the highest α = 0,859 in Item 60.
In factor 4 (Study), mean indices range between 3.10 ± 0.889 in item 34 and 3.48 ± 0.832 in item 49. Cronbach's alpha coefficients show reasonable internal consistency, with the lowest value α = 0,766 found in item 44 and the highest value α = 0,780, in item 25.
In factor 5 (Institutional), mean indices range between 3.54 ± 1.149 in item 3 and 4.03 ± 1.004 in item 16. Cronbach's alpha coefficients show questionable internal consistency, with the slowest value α = 0,571, found in item 12 and the highest value α = 0,679, in item 3.
Table 5. Internal Consistency for each subscale of the QAL Scale- Quality of Academic Life
Items Mean SD r/total- item r2 α with no
item Personal
9 I feel sad or down. 2.74 1.202 0.683 0.507 0.846
11 Lately, I have felt lost and confused. 2.77 1.141 0.687 0.512 0.846 13 There are situations in which I feel I am losing control. 2.94 1.083 0.532 0.344 0.860 17 Lately, I have become a much more pessimistic person. 2.87 1.206 0.649 0.426 0.849 26 I feel that lately I have been drifting apart from my
coursemates. 2.83 1.240 0.633 0.441 0.851
28 I feel distressed from time to time. 2.89 1.105 0.665 0.465 0.848 39 I think about a lot of things that make me sad. 2.93 1.139 0.523 0.306 0.861
45 I feel weak physically. 2.82 1.208 0.577 0.361 0.856
Items Mean SD r/total- item r2 α with no item Interpersonal
1 I make friends easily at school. 3.56 0.909 0.490 0.253 0.825 19 My schoolmates have been important to my personal
growth. 3.52 0.972 0.520 0.311 0.822
24 I feel I have a great group of friends at school. 3.82 0.996 0.658 0.488 0.803 27 I have made good friends among coursemates. 3.79 0.960 0.647 0.473 0.805 33 I have developed close friendly relationships with both
boys and girls. 3.67 0.977 0.564 0.328 0.816
38 People say I am a nice and friendly person. 3.80 0.910 0.454 0.253 0.830 40 I try to hang out with my schoolmates even beyond our
regular school hours. 3.68 0.931 0.570 0.339 0.816
43 My friendships are more and more stable, lasting and
independent. 3.58 0.931 0.603 0.372 0.811
Career
2 I believe the career I chose will allow me to accomplish my
personal values (reputation, stability, solidarity…) 3.85 0.795 0.513 0.293 0.850 5 Looking back, I am able to identify the reasons that made
me choose this course. 3.93 0.925 0.632 0.416 0.836
8 I have the right skills to succeed in the field I chose. 3.73 0.855 0.621 0.414 0.838 14 I feel I am part of the course I attend. 3.73 0.830 0.648 0.433 0.836 20 My academic option is clearly meeting my expectations. 3.54 0.842 0.622 0.414 0.838 22 I believe my course will help me reach professional
fulfillment. 3.83 0.885 0.669 0.457 0.832
37 I chose the course that best fits my skills and abilities. 3.73 0.942 0.670 0.460 0.832 60 I wouldn’t attend a different course, even if I could. 3.66 1.191 0.501 0.271 0.859 Study
25 I feel in good shape and I feel I have a good work rhythm. 3.32 0.830 0.492 0.256 0.780 34 My school assignments are always completed in due
time. 3.10 0.889 0.524 0.280 0.775
41 I know how to set priorities when it comes to manage my
time 3.42 0.874 0.521 0.276 0.775
44 I am able to take decent notes during classes. 3.43 0.911 0.568 0.338 0.766 47 I can effectively prepare to take my exams 3.18 0.816 0.507 0.272 0.778 49 I focus on systematizing and organizing the information I
get during my classes. 3.48 0.832 0.558 0.333 0.769
53 I have good study skills. 3.31 0.799 0.543 0.304 0.772
Institutional
3 I wouldn’t leave this Polytechnic Institute even if I could. 3.54 1.149 0.504 0.262 0.679
12 I like my school 3.81 0.906 0.592 0.354 0.571
16 I would like to graduate from the institution I am currently
attending. 4.03 1.004 0.526 0.298 0.636
Factor analysis of the scale ends with the presentation of Pearson’s correlation matrix. Correlations between the different subscales show moderate to high correlation values with the scale total factor, with the percentages of explained variance above 0.28% between factors and with the scale total factor when set above 17.0%.
The correlation matrix between the four factors and the overall scale indicate that the correlations are positive and significant (cf. table 6). This confirms that the increase or decrease in the indices of a given variable correspond to the increase or decrease in the variable with which it correlates. We found out that among the subscales the lowest correlational value occurs between factor 4 and factor
1 (r =-0.053) with a percentage of explained variance of 0.28% and the highest correlation value is found between factor 5 and factor 3 (R = 0579) with a variability of 33.52%. Correlation values are higher (above 17.0%) between the different subscales and the scale total factor.
Table6. Pearson’s Correlation Matrix between the factors of the Quality of Academic Life Scale
Factors F1- Personal F2- Interpersonal F3-Career F4-Study F5-Institutional
Interpersonal– F2 -0.126 *** --- Career – F3 -0.063 * 0.448*** --- Study- F4 -0.053 0.319*** 0.510*** --- Institutional- F5 -0.100 ** 0.417*** 0.579*** 0.305*** --- Total Factor 0.413*** 0.633*** 0.749*** 0.617*** 0.578*** *** p>0.001
4 CONCLUSIONS
The main objective of this study was to test the factorial structure of the quality of academic life scale for Portuguese higher education students.
The results obtained allowed us to outline a socio-demographic profile of a sample composed of 891 higher education students in which most of the respondents were female students (68.2%) aged between 17 and 40 years, with a mean age of 19.68 years (± 2.34 years) for the total sample. An important part of the sample is composed of older students (≥ 20 years) (38.3%) whose parents left school after completing primary education (father 43.5% vs. Mother 36.8%).
We consider that the analysis of the reliability and validity of the Quality of Academic Life Scale for Portuguese higher education students is a fundamental aspect. This instrument was used to operationalize the central and dependent variable for the study, so the value of the results obtained, as well as the conclusions they provided, depend naturally on its conceptual and psychometric qualities.
The results of the study support the psychometric adequacy of the Academic Experience Questionnaire (AEQ) designed by Almeida [13] for the Portuguese population. This adequacy indicates that it can be used in further tests. The exploratory and confirmatory factor analysis demonstrates the validity of its structure in 5 factors: personal, interpersonal, career, study and institutional.
ACKNOWLEDGEMENTS
This work is financed by national funds through FCT - Fundação para a Ciência e Tecnologia, I.P., under the project UID/Multi/04016/2019. Furthermore we would like to thank the Instituto Politécnico de Viseu and CI&DETS for their support. The authors gratefully acknowledge the support of Health Sciences Research Unit: Nursing (UICISA: E), hosted by the Nursing School of Coimbra (ESEnfC).
REFERENCES
[1] J.B.B. Ferreira, G.M. Seco, F. Canastra, M.I.S. Dias, and M.O. Abreu, “(In)sucesso académico no Ensino Superior: Conceitos, fatores e estratégias de intervenção,” in Revista Iberoamericana
de Educación Superior (RIES), vol. 2, pp. 152-159, 2011. Retrieved from http://hdl.handle.net/
10400.8/198
[2] S.M. Nunes and A.R. Garcia, “Estudantes do ensino superior: As relações pessoais e interpessoais nas vivências académicas,” in Gestin, vol. 8, pp.195-203, 2010. Retrieved from http://hdl.handle.net/10400.11/514
[3] M. Barros, “A relevância e a qualidade da vivência académica: Um percurso de formação ativa,” in Contextos e dinâmicas da vida académica (A.S. Pouzada, L.S. Almeida, and R. Vasconcelos eds.), pp. 99-106, Universida, 2002.
[4] K. Elliott and D. Shin, “Student satisfaction: An alternative approach to assessing this important concept,” in Journal of Higher Education Policy and Management, vol. 24, no. 2, pp. 197-209, 2002.
[5] M.J. Sirgy, S. Grzeskowiak, and D. Rahtz, “Quality of College Life (QCL) of students: Developing and validating a measure of well-being,” in Social Indicators Research, vol. 80, no. 2, pp. 343-360, 2007.
[6] M.J. Sirgy, D.-J. Lee, S. Grzeskowiak, G.B. Yu, D. Webb, K. El-Hasan, J. Jesus Garcia Vega, et al., “Quality of College Life (QCL) of students: Further validation of a measure of well-being,” in
Social Indicators Research, vol. 99, no. 3, pp.375-390, 2010.
[7] L. Harvey, “Student feedback,” in Quality in Higher Education, vol. 9, no. 1, pp. 3-20, 2003. [8] J. Leckey and N. Neill, “Quantifying quality: The importance of student feedback,” in Quality in
Higher Education, vol. 7, no. 1, pp. 19-32, 2001.
[9] E.M.G.M. Pedro, “Fatores determinantes da qualidade de vida académica e suas implicações no desempenho, recomendação e fidelização de estudantes nas universidades públicas portuguesas,” Dissertação de Mestrado, Universidade da Beira Interior, 2013. Retrieved from http://hdl.handle.net/10400.6/3171
[10] L.S. Almeida, J.A.G. Ferreira, and A.P.C. Soares, “Questionário de Vivências Académicas: Construção e validação de uma versão reduzida (QVA-r),” in Revista Portuguesa de
Pedagogia, vol. 33, no. 3, pp. 181-207, 1999.
[11] V.M.P. Fernandes, “Adaptação académica e auto-eficácia em estudantes universitários do 1ºciclo de estudos,” Dissertação de Mestrado, Faculdade de Ciências Humanas e Sociais da Universidade Fernando Pessoa, 2011. Retrieved from http://hdl.handle.net/10284/2253
[12] J.P. Marôco, Análise de equações estruturais: Fundamentos teóricos, software & aplicações. Pêro Pinheiro: ReportNumber, ed. 2, 2014.
[13] L.S. Almeida, A.P. Soares, and J.A. Ferreira, “Questionário de Vivências Académicas (QVA-r): Avaliação do ajustamento dos estudantes universitários,” in Avaliação Psicológica, vol. 2, pp. 81-93, 2002.