Rhythms of
Microcystis aeruginosa
Haifeng Qian1., Baolan Hu2., Shuqiong Yu1
, Xiangjie Pan1, Tao Wu1, Zhengwei Fu1*
1College of Biological and Environmental Engineering, Zhejiang University of Technology, Hangzhou, People’s Republic of China,2College of Environmental and Resource Sciences, Zhejiang University, Hangzhou, People’s Republic of China
Abstract
Background:The cyanobacteriumMicrocystis aeruginosais one of the principal bloom-forming cyanobacteria present in a wide range of freshwater ecosystems.M. aeruginosa produces cyanotoxins, which can harm human and animal health. Many metabolic pathways in M. aeruginosa, including photosynthesis and microcystin synthesis, are controlled by its circadian rhythms. However, whether xenobiotics affect the cyanobacterial circadian system and change its growth, physiology and biochemistry is unknown. We used real-time PCR to study the effect of hydrogen peroxide (H2O2) on the
expression of clock genes and some circadian genes inM. aeruginosaduring the light/dark (LD) cycle.
Results:The results revealed that H2O2 changes the expression patterns of clock genes (kaiA,kaiB,kaiC andsasA) and
significantly decreases the transcript levels of kaiB, kaiCand sasA. H2O2 treatment also decreased the transcription of
circadian genes, such as photosynthesis-related genes (psaB,psbD1andrbcL) and microcystin-related genes (mcyA,mcyD
and mcyH), and changed their circadian expression patterns. Moreover, the physiological functions of M. aeruginosa, including its growth and microcystin synthesis, were greatly influenced by H2O2treatment during LD. These results indicate
that changes in the cyanobacterial circadian system can affect its physiological and metabolic pathways.
Conclusion: Our findings show that a xenobiotic can change the circadian expression patterns of its clock genes to influence clock-controlled gene regulation, and these influences are evident at the level of cellular physiology.
Citation:Qian H, Hu B, Yu S, Pan X, Wu T, et al. (2012) The Effects of Hydrogen Peroxide on the Circadian Rhythms ofMicrocystis aeruginosa. PLoS ONE 7(3): e33347. doi:10.1371/journal.pone.0033347
Editor:Brett Neilan, University of New South Wales, Australia
ReceivedOctober 26, 2011;AcceptedFebruary 14, 2012;PublishedMarch 7, 2012
Copyright:ß2012 Qian et al. This is an open-access article distributed under the terms of the Creative Commons Attribution License, which permits unrestricted use, distribution, and reproduction in any medium, provided the original author and source are credited.
Funding:This work was financially supported by the National Basic Research Program of China (No. 2010CB126100), the Natural Science Foundation of China (21077093), Qianjiang talents project of the technology office in Zhejiang province (2010R10033), and the Science Foundation of Chinese University. The funders had no role in study design, data collection and analysis, decision to publish, or preparation of the manuscript.
Competing Interests:The authors have declared that no competing interests exist.
* E-mail: [email protected]
.These authors contributed equally to this work.
Introduction
With the exacerbation of eutrophication and chemical pollu-tion, water blooms are increasingly frequent in lakes around the world, which has resulted in severe environmental problems. These include the release of repugnant odors and bottom-layer anoxia, which have significant adverse impacts on aquatic environments. Cyanobacterial blooms also pose a serious health hazard to humans (via water consumption) because they release cyanotoxins, which are toxic or carcinogenic [1]. Cyanotoxins have appeared in many freshwater lakes, such as Lake Erie (North America), Lake Winnipeg (Canada), Lake Victoria (the largest of the African rift lakes), Lakes Biwa and Kasimagaura (one of Japan’s largest lakes) and Lake Taihu (the third-largest freshwater lake in China) [2]. More than 60,000 incidents of intoxication per year have been reported worldwide [3], and millions of dollars have been lost [4]. Furthermore, the development of urban and industrial agriculture is rapidly accelerating the input of nutrient sources into water systems. Thus, it is difficult to control the formation of water blooms only via the input of nutrients, such as nitrogen (N) and phosphorus (P) [5]. Some studies have researched chemical algaecides that inhibit the growth of cyanobacteria.
Copper Sulfate (CuSO4) is an effective and cheap algaecide, which
was used in reservoirs, lakes and ponds. However, copper compound is difficult to biodegrade, and it is easy to accumulate in organisms’ bodies or sediments. The worry is that the broad application of CuSO4 may cause metal compound secondary
pollution. Hydrogen peroxide (H2O2) is a simple oxidizing agent
by quickly releasing a single oxygen atom. H2O2exists in natural
freshwater and is photochemically generated from organic constituents present in the water under the sunlight [6]. It is reported that the natural levels of H2O2can reach up to102
5
M (0.34 mg L21) [6,7]. Recently, H2O2 was demonstrated as an
effective chemical algaecide to limit cyanobacterial and green algal growth [8,9]. Our previous report also demonstrated that H2O2
inhibitsMicrocystis aeruginosagrowth, and changes physiological and biochemistry process [10]. Given that H2O2 is considered to be
benign to the environment, only forming water upon degradation, we selected H2O2 as a potential algaecide to research its toxic
mechanism.
[11]. The members of this genus are able to synthesize microcystins (MCs), a group of monocyclic heptapeptides. MCs can cause hepatotoxic diseases and liver cancer by inhibiting the activity of protein phosphatases 1 and 2A, which are key proteins in the regulation of many eukaryotic cell cycles [12,13]. Many physiological activities of cyanobacteria are controlled by its biological clock, which allows these activities to adapt to daily fluctuations in the environment [14]. Agrawal et al. [15] demonstrated that photosynthetic gene transcripts are regulated by a biological clock to achieve efficiency inM. aeruginosa. There are three clock genes,kaiA, kaiBandkaiC, in cyanobacteria, and
kaiB and kaiC operate as a unit with a single promoter (independent from the kaiAtranscript) [16]. Transcription from either the kaiA or kaiBC operon is under circadian feedback regulation, and circadian rhythms of expression are necessary to maintain normal circadian sustainability [16]. In addition, SasA, a histidine kinase that interacts with the KaiC protein, was found to be required for sustaining robust circadian rhythms [17]. Cell division, amino acid uptake, nitrogen fixation, respiration, and carbohydrate synthesis are also under circadian control in cyanobacteria [18–20]. More recently, Straub et al. [21] demonstrated that many metabolites are controlled by a circadian clock inM. aeruginosa.
However, little is known regarding whether xenobiotics affect cell growth, photosynthesis or other metabolic pathways by changing the circadian rhythms of the clock genes or circadian genes. In this study, we comprehensively analyzed the relationship between exogenous H2O2treatment and the circadian rhythms of
the clock genes and circadian genes inM. aeruginosato determine the effect of H2O2on its growth and the transport of these stress
signals to a related metabolite.
Results
The effect of H2O2on the expression patterns of the clock genes in LD-grown cultures
The abundances ofkaiA,kaiBand kaiCexhibit daily rhythmic patterns in the LD cycle, with peaks after 4 h of light (L4) and troughs after 4–8 h of darkness (Figure 1). A similar oscillation pattern was also observed in the daily expression ofsasAmRNA, which reached its peak or trough at the similar time as the kai
genes. The diurnal rhythm amplitudes (the ratios of the peak to the trough) ofkaiA, kaiB, kaiC and sasA were 3.1, 4.3, 3.5 and 3.5, respectively. To determine whether H2O2 affects the circadian
system, we examined the transcripts of the clock genes (kaiA,kaiB,
kaiC and sasA) after H2O2 exposure at L0 and D0. In the L0
treatment, H2O2altered the daily transcript patterns of these clock
genes, and the mRNA expression ofkaiAdisplayed a 16-h phase-forward and a peak time shift from L4 to D8; however, the peak mRNA transcript levels ofkaiAdid not change significantly. The daily rhythms ofkaiB,kaiCandsasAdisappeared when subjected to cosine wave analysis, as described by Wuet al.[22], although there was a significant daily variation in the mRNA transcript levels of
kaiCandsasA(one-way ANOVA,p,0.05). Furthermore, the peak mRNA transcript levels ofkaiB,kaiCandsasAdecreased to 48.8%, 57.1% and 71.4% of the control (p,0.05), respectively. However, the amplitudes of these three genes were only 2.1, 1.5 and 1.9, respectively, which are less than those of the control.
In the D0 treatment, H2O2altered the daily expression patterns
of these clock genes by a 4-h phase delay and a peak time shift from L4 to L8. Interestingly, the abundance and amplitude of these genes also decreased, but their daily rhythms were maintained in an apparently circadian pattern in this treatment, as determined by cosine wave analysis and one-way ANOVA. The
peak transcript levels ofkaiB,kaiCandsasAdecreased significantly (p,0.05), resulting in levels that were 46.5%, 54.3% and 65.7% of the control, respectively. The daily amplitudes of these genes were 2.5, 2.7 and 2.3, respectively.
The effect of H2O2on the expression of photosynthesis-related genes in LD-grown cultures
In cyanobacteria, oxygenic photosynthesis is a central metabolic process. To determine whether H2O2affects the circadian system
in the photosynthetic pathway, we investigated the expression of photosynthesis-related genes (psaB, psbD1 and rbcL) after H2O2
treatment. The transcript levels of the photosynthesis-related genes were light-dependent and produced circadian expression patterns (Figure 2). The peak levels of psaB, psbD1 and rbcL mRNA occurred at D0 (the end of light exposure), L4 and L8, respectively. The peak-to-trough ratios forpsaB,psbD1 andrbcLwere 3.7, 4.0 and 4.0, respectively. H2O2treatment at L0 significantly decreased
the mRNA abundances of three photosynthesis-related genes (p,0.05) and changed their circadian expression patterns. H2O2
treatment reduced the peak abundances ofpsaB,psbD1andrbcLto 29.7%, 57.5 and 48.1% of the control, respectively. Their amplitudes were reduced to 33.0%, 57.5 and 47.5% of the control, respectively. The cosine wave analysis showed that H2O2
treatment caused the daily rhythms ofpsaBandrbcLto disappear, but H2O2treatment did not alter psbD1rhythm.
H2O2treatment at D0 also significantly decreased the transcript
levels and changed the circadian patterns of the photosynthesis-related genes. The peak abundance ofpsaBdecreased to 27.2% of the control treatment, and the circadian rhythm disappeared, as determined by the cosine wave analysis. The amplitude ofpsbD1
mRNA expression decreased to 75% of the control, but the daily rhythm was maintained (as in the control). The amplitude ofrbcL
decreased to 62.5% of the control, and its circadian patterns exhibited a 4-h phase afterward from L8 to D0.
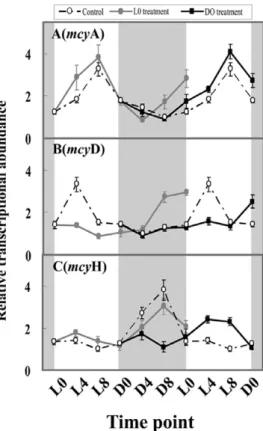
The effect of H2O2on the expression of microcystin-related genes in LD-grown cultures
The transcript levels of microcystin-related genes (mcyA, mcyD
andmcyH) also showed circadian patterns, with peak values at L8, L4, and D8, respectively (Figure 3). H2O2treatment at L0 did not
significantly alter the peak abundances and amplitudes of these three genes with respect to the control; however, H2O2treatment
differentially affected their phases. Although H2O2 treatment at
L0 did not change the daily expression patterns ofmcyAandmcyH, it immediately suppressed the increase inmcyDmRNA levels and, thus, greatly delayed the peak phase by 20 h (from L4 to L0). H2O2treatment at D0 also did not affect the peak abundance and
phase ofmcyA, but it greatly influenced the expression levels of
mcyD andmcyH. H2O2treatment at D0 significantly delayed the
peak phases ofmcyDandmcyHmRNA expression by 8 h and 12 h, respectively, with respect to the control.
The effect of H2O2on physiological function in LD-grown cultures
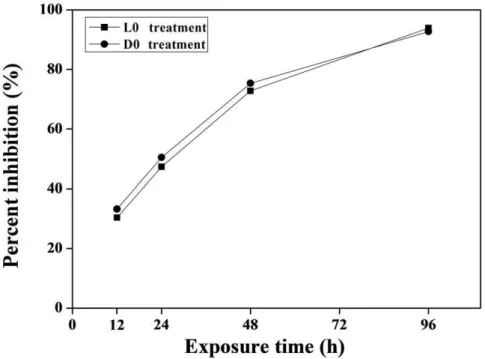
The growth of M. aeruginosa was significantly inhibited after H2O2 treatment at L0 or D0 point (Figure 4). The percent
inhibition was exhibited in a time-dependent manner, which reached 33.2%, 50.5%, 75.3% and 92.7% after 12, 24, 48 and 96 h of H2O2 exposure at L0 point, respectively. Similar
inhibitory effects of H2O2 exposure on M. aeruginosa growth at
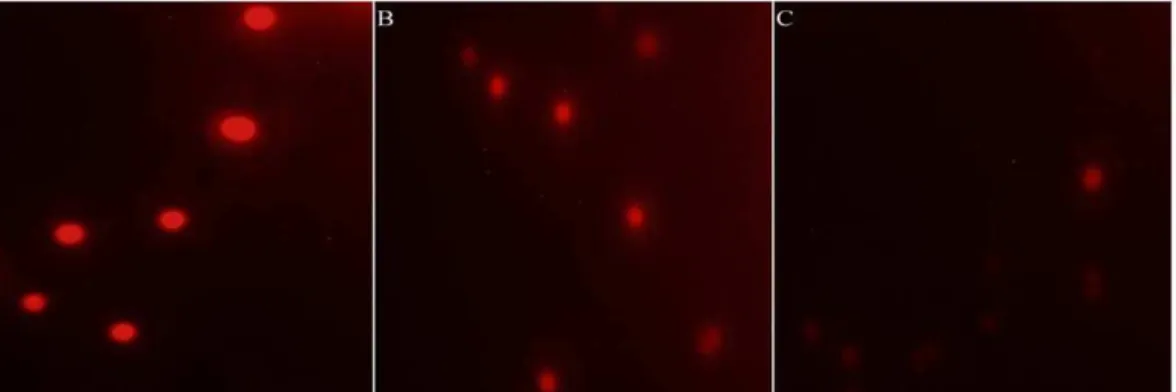
D0 point were also displayed. By observing cellular morphology, cyanobacterial cells were blue in normal cultural condition, but this color became weaker after H2O2 treatment, suggesting that
the cells were bleached (Figure 5). Chlorophyll a (Chl a) excites optimally at 460 nm (blue light) and emits at 685 nm (red light), this fluorescence is directly proportional to the concentration of Chl a. Therefore, we analyzed the fluorescence intensity of Chl a and found that it was stronger in the control than that in the L0 or D0 treatment (Figure 6), indicating that the content of Chl a decreased after H2O2 exposure. We also quantified several
pigments content, and found that the content of Chl a, phycocyanobilin (PC), allophycocyanin (APC) and phycoerythrin (PE) decreased after H2O2exposure at L0 point. The lowest levels
of them were 13.9%, 10%, 15.1% and 17.4% of the control, respectively. Similar phenomenon was also displayed after H2O2
exposure at D0 point (Figure 7).
We recorded the change of cell numbers in the first 24 h exposure time, and found thatM. aeruginosagrowth was very rapid under normal conditions, cell numbers increased from 3.76105/ mL to 5.26105/mL; but it slowed or decreased after H2O2
treatment at L0 and D0, cell number was from 3.86105/mL to 3.46105/mL at L0 point, and 3.66105/mL to 3.06105/mL at D0
point (Figure 8). The intracellular microcystin (MC) content fluctuated in the control group, remaining stable (approximately 11.4 pg/102cells) during the light period, declining shortly after the lights were turned off. The lowest MC content appeared at D4 point, and then returned afterwards (Figure 9). H2O2treatment at
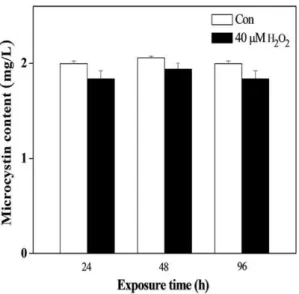
L0 significantly reduced the MC content at D0 and caused the daily rhythm of the MC content to disappear, as determined by the cosine wave analysis. In the D0 treatment, the MC content showed a little increase during the dark period, followed by a decrease in the subsequent light period, and the lowest level was approximately 5.0 pg/102cells, which is only half of the control. The results of the cosine wave analysis showed that the daily rhythm of the MC content had also disappeared. We had suspected that H2O2 may directly oxidize MC and cause a
decrease in MC content. To test this proposal, we added 50mM H2O2to a 2 mg/L MC solution and found that the level of MC
did not significantly decrease after 24 to 96 h of exposure (Figure 10). Thus, MC is not oxidized by H2O2.
Discussion
Water blooms are one of the top environmental issues in the world.M. aeruginosais a common bloom-forming cyanobacteria in freshwater ecosystems and is of primary concern because of its wide distribution and secretion of toxic secondary metabolites, such as microcystins. Cyanobacteria are the only known bacterial species that display circadian rhythms [14], exhibiting self-sustaining oscillations with an approximately 24-h day-night cycle. These expressions are thought to be indicators of a pacemaker that controls various aspects of physiology and metabolism to adapt to daily environmental fluctuations. In cyanobacteria, approximately 30% to 80% genes exhibit robust oscillating expression profiles, and most of these genes are involved in physiological and metabolic processes [23,24]. Using DNA microarrays, Straubet al.[21] demonstrated that more than 25% of the genes involved in many metabolic pathways in M. aeruginosa exhibit significant rhythmic changes in their transcript abundances. Their results revealed that many of the physiological and metabolic activities that occur in cyanobacteria, such as cell division, nitrogen fixation, photosynthesis, carbon uptake and the biosynthesis of secondary metabolites, are controlled by circadian rhythms.
Hydrogen peroxide treatment is considered to be more environmentally friendly than the traditional methods for cyanobacterial removal [8,9]. Hydrogen peroxide can inhibit the growth of M. aeruginosa by blocking the transcription of photosynthesis-related genes or destroying photosynthetic pig-ments [10]. However, a clear mechanistic link among the clock genes, cellular physiological and metabolic rhythms and H2O2(or
other xenobiotics) has not been elucidated. Understanding their circadian is essential for determining the relationship between the circadian clock and the observed physiology inM. aeruginosa. Here, Figure 1. The clock gene transcripts in M. aeruginosa under light and dark conditions after H2O2 treatment. The shaded areas
correspond to the dark period. Symbols represent mean6SEM of triplicate cultures. The mRNA amount of all examined genes is normalized to 16S rDNA. The open circle corresponds to the control treatment; the filled circle corresponds to the L0 treatment; the filled square corresponds to the D0 treatment. A, The effect of H2O2on thekaiAcircadian transcript; B, the effect of H2O2on thekaiBcircadian transcript; C: the effect of H2O2on thekaiC
circadian transcript; D: the effect of H2O2on thesasAcircadian transcript.
we first used real-time PCR to analyze the effect of H2O2
treatment on the circadian expression of the clock genes, circadian genes (three photosynthesis-related genes and three microcystin-related genes) within a light-dark cycle.
Since Liuet al. [25] introduced bacterial luciferase structural genes (luxAB) as a reporter of circadian gene expression in cyanobacteria, many researchers have used this method to investigate the circadian rhythms of circadian genes. Ishiura et al.[16] demonstrated that the transcript levels ofkaiAandkaiBCin
Synechococcusexhibit circadian rhythms, and both bioluminescence peaks occur after 9 to 12 h under LL conditions. However, bioluminescence reporters may exhibit a time lag due to transcription, translation and post-translation processes [26]. Straub et al.[21] used DNA microarrays and demonstrated that the transcription patterns of the kaiB, kaiC and sasA genes are similar, with a peak within 3 h after light exposure. In this study, the expression peaks of these clock genes appeared after 4 h of light exposure in the LD cycle. These results are similar to those found in previous studies of circadian rhythms in cyanobacteria [27,28]. This study also observed that H2O2treatment affected the
rhythms of the clock genes. It is known that the circadian rhythm generated by the clock genes is output to downstream target genes via an unknown molecular mechanism [14]. Therefore, we
analyzed the circadian rhythms of target genes (physiological-related genes, including three photosynthesis-(physiological-related genes and microcystin-related genes) after H2O2treatment.
Photosynthesis-related genes are demonstrated to transcript mRNA rhythmically for the highest efficient photosynthesis. For example, thepsbA2gene, which encodes the D1 protein homolog of photosystem II, reaches its maximum transcript levels after 6 h of light exposure [15]. Sto¨ckelet al.[23] demonstrated that most of the genes encoding the subunits of photosystem I and II are maximally expressed during light exposure and minimally expressed in the dark. In this study, we selected three photosynthesis-related genes, psaB, psbD1 and rbcL, and found that the transcripts of these three photosynthesis-related genes displayed maximum transcript abundances in the light cycle and minimum transcript abundances in the dark cycle under normal conditions. These results also demonstrated the opinion that the circadian clock could precisely regulate photosynthetic genes to be active during day and promote organism growth in unicellular cyanobacteria [29]. This consideration was also confirmed by the growth curve ofM. aeruginosa, whichM. aeruginosagrows quickly in the light time, but retards in the dark time (Figure 8). The change of the rhythms of the photosynthesis-related genes after H2O2
treatment could decline solar energy utilization, and affect the synthesis of carbohydrate and high energy molecules (ATP and NADPH), which are the necessary substances for cyanobacterial growth. Therefore, this rhythmical disturbance of the photosyn-Figure 2. Photosynthesis-related gene transcripts inM.
aerugi-nosaunder light and dark conditions after H2O2treatment.The
shaded areas correspond to the dark period. Symbols represent mean
6SEM of triplicate cultures. The mRNA amount of all examined genes is normalized to 16S rDNA. The open circle corresponds to the control treatment; the filled circle corresponds to the L0 treatment; the filled square corresponds to the D0 treatment. A: The effect of H2O2onpsaB
circadian transcript; B: the effect of H2O2 on the psbD1 circadian
transcript; C: the effect of H2O2on therbcLcircadian transcript.
doi:10.1371/journal.pone.0033347.g002
Figure 3. Microcystin-related gene transcripts inM. aeruginosa
under light and dark condition after H2O2 treatment. The
shaded areas correspond to the dark period. Symbols represent mean
6SEM of triplicate cultures. The mRNA amount of all examined genes is normalized to 16S rDNA. The open circle corresponds to the control treatment; the filled circle corresponds to the L0 treatment; the filled square corresponds to the D0 treatment. A: The effect of H2O2onmcyA
circadian transcript; B: the effect of H2O2 on the mcyD circadian
transcript; C: the effect of H2O2onmcyHcircadian transcript.
doi:10.1371/journal.pone.0033347.g003
thesis-related genes responded in the physiological level, such as the retardation of cyanobacterial growth (Figure 8), supporting the opinion again that circadian rhythm might be important for optimal growth [30,31].
The study also analyzed the transcripts of the microcystin-related genes, and demonstrated their circadian patterns under LD conditions. Transcript levels of microcystin biosynthesis genes (mcyA and mcyD) reached their maxima after 4–8 hours of light exposure, while the peak levels ofmcyH, the microcystin transport gene, appeared in the dark. These results are similar to those reported by Straub et al. [21], who demonstrated that the biosynthesis of the microcystin genes exhibit circadian rhythms and display their maximum transcript abundance after switching to light exposure. It displayed that microcystin synthesis could be kept in step with photosynthesis, because this process need some substrates related to photosynthesis, while microcystin transport might be taken place in the dark by utilizing ATP produced at degradation of carbohydrate. To verify the rhythm of microcystin at a physiological level, we measured the microcystin content per
cell under LD conditions and found that MC content was high during the light cycle and low during the dark cycle, in agreement with the rhythms of the microcystin synthesis-related gene transcripts. These results are similar to the results found by Wiedneret al.[32] inMicrocystisstrain PCC 7806 and Bittencourt-Oliveiraet al. [33] inMicrocystis spp. After H2O2 treatment, the
circadian of microcystin-related genes transcripts were affected differentially, and MC content and fluctuations were changed, which shows that some physiologies are subjected to the circadian control of circadian genes.
It is very common phenomenon that organisms from bacteria to mammals use circadian clock system to adapt to daily environ-mental changes. The signals from the environment affect oscillator circadian rhythm by changing clock genes transcript, which in turn regulates various cellular activities, such as transcription [34,35]. In eukaryotic species, diurnal circadian rhythm has been studied in more detail than in prokaryotic species. Reports have demonstrated that exo-factors (such as food, light) affect circadian rhythms in animals [36,37]. This same phenomenon has also been Figure 4. Effects of H2O2on the inhibition ofM. aeruginosagrowth.
doi:10.1371/journal.pone.0033347.g004
Figure 5. Morphology ofM. aeruginosacell after H2O2exposure observed under an optical microscope (61000).A: Control; B: L0 treatment; C: D0 treatment.
observed in plants. Kotchoniet al.[38] reported that exogenous ascorbic acid affects the flowering time ofArabidopsisby changing the transcript levels of the clock input genes (PHYA, PHYB, CRY1, CRY2), the oscillator gene (LHY) and the output genes (GI, CO, LFY). The prokaryotic-clock research community has still focused on the composition of the timing system and discerned how it might function. Models based on empirical observations and testable hypotheses are emerging for the mechanism that underlies cyanobacterial timekeeping [39]. The knowledge about how the circadian clock controls cellular metabolism, and how extra- and intracellular environments impact the clock, is still very limited. This study showed a kind of possibility that exogenous H2O2inhibitsM. aeruginosagrowth by affecting the transcript levels
and phases of the clock genes and circadian genes, because researchers did not find the direct relationship among the clock
genes and circadian genes and the physiological response up to now. Of course, this result did not exclude the possibility that H2O2damaged cyanobacterial cell directly and caused cell death,
but it may suggest a new pathway or regulatory mechanism in cyanobacteria that mediated by the circadian clock. This study can significantly broaden our understanding of temporal regulation in a unicellular oxygenic organism.
Materials and Methods
M. aeruginosagrowth conditions and harvesting protocol
M. aeruginosawas purchased from the Institute of Hydrobiology of the Chinese Academy of Sciences (code: 905) and cultivated in BG-11 medium. The cultures were grown at 24uC in flasks (250 mL) containing 50 mL of medium and illuminated with Figure 6. The observation of Chl a fluorescence intensity after H2O2exposure.A: Control; B: L0 treatment; C: D0 treatment.
doi:10.1371/journal.pone.0033347.g006
Figure 7. Inhibitory effects of H2O2on Chl a, PE, PC and APC levels inM. aeruginosafor 24 h.
doi:10.1371/journal.pone.0033347.g007
fluorescent lights (4000 lux) for a daily 12-h-12-h light-dark cycle (LD cycle). The cell density of culture was monitored spectropho-tometrically at 685 nm (OD685). The regression equation between
the density of cyanobacteria (Y6105/mL) and OD685 (X) was
established as Y = 34.11X+0.73 (R2= 0.99). When the culture reached the middle of the exponential growth phase (approximate 3.76105/mL), H2O2(40mM) was added to the culture at either
the 0-h light point (termed L0 treatment) or the 0-h dark point (termed D0 treatment). In the LD cycle, the concentration of H2O2 was decided based on our previous report [10]. Sample
collection began after 4 h of treatment and was performed every 4 h (up to 24 h).
RNA extraction, reverse transcription and real-time PCR analysis
Culture samples (30 mL) were collected by centrifugation for RNA isolation at each time point. The cell pellet for RNA isolation was quickly frozen in liquid nitrogen until RNA extraction. Total RNA was extracted using the RNAiso kit (TaKaRa Company,
Dalian, China) following the manufacturer’s instructions. 500 ng RNA was reverse transcripted into cDNA according to the reverse transcriptase kit (Toyobo, Tokyo, Japan). Real-time PCR was carried out using an Eppendorf MasterCyclerH ep RealPlex4 (Wesseling-Berzdorf, Germany). A reaction mixture for each PCR run was prepared with the SYBRHGreen real-time PCR Master Mix (Toyobo, Tokyo, Japan). Final concentrations in a total volume of 10mL were: 5mL of 26Master Mix (including SYBRH
Green I, dNTPs, Mg2+
, Taq DNA Polymerase, 16ROX), 0.4mL of 10mM each of specific sense and anti-sense primers, and 1mL of cDNA, 3.2mL of ddH2O. The following PCR protocol was
used with two steps as our previous report [10]: one denaturation step at 95uC for 1 min and 40 cycles of 95uC for 15 s, followed by 60uC for 1 min. 16Sr DNA was used as a housekeeping gene to normalize the expression profiles. Four clock genes (kaiA,kaiB,kaiC
andsasA) and six circadian genes (psaB, psbD1, rbcL, mcyA,mcyD
andmcyH) were selected and the primer pairs for each are listed in Table S1. For verify the efficiency of amplification determined for Figure 8. Growth ofM. aeruginosathat was cultured with H2O2in the first 24 h.The shaded areas correspond to the dark period. Symbols
represent mean6SEM of triplicate cultures. The open circle corresponds to the control treatment; the filled circle corresponds to the L0 treatment; the filled square corresponds to the D0 treatment.
doi:10.1371/journal.pone.0033347.g008
Figure 9. The intracellular microcystin content ofM. aeruginosa
under light and dark conditions after H2O2 treatment. The
shaded areas correspond to the dark period. The symbols represent the mean6SEM of triplicate cultures. The filled circle corresponds to the L0 treatment; the open circle corresponds to the control treatment; the filled square corresponds to the D0 treatment.
doi:10.1371/journal.pone.0033347.g009
Figure 10. The change of microcystin content in water after oxidation by H2O2for various time periods.
each primer set, dissociation curve was run following the real-time PCR, and found no other dsDNA was amplified including primer dimers, contaminating DNA, and PCR product from misannealed primer, except the targeted fragment. Agarose gel electrophoresis of PCR products also demonstrated that only targeted fragment was amplified. The relative quantification of gene expressions among the treatment groups was analyzed by the 22DDCtmethod [40], whereCtis the cycle number at which the fluorescent signal rises statistically above the background.
Microcystin analysis
Aliquots (30 mL) were centrifuged to collect theM. aeruginosa
bodies. The aliquots were then resuspended in 300mL of Milli-Q water to extract the microcystins using the boiling water bath method, as described by Metcalf and Codd [41]. The MC content was calculated by a standard curve, which was drafted from standard microcystin-LR (MC-LR) that was purchased from Sigma-Aldrich (CAS number: 101043-37-2, analytical standard). The microcystins were analyzed using HPLC, as described by Feng et al [42] with some modification. HPLC was performed on a Jasco LC-2000 series HPLC system (Jasco, Tokyo, Japan) equipped with C18 column (4.6 mm I.D.6250 mm, Shimadzu, Japan). The mobile phase was composed of methanol/water (6/4 by volume) plus 0.04% trifluoroacetic acid, and a flow rate of 1 mL/min was used and 20mL of sample were injected for analysis. For detection, the circular dichroism (CD) detector was operated at 238 nm, and the column temperature was 25uC.
Chromatographic data were acquired and processed with N2000 Online ChromStation software (Zhida Information Ltd. Co, Zhejiang University, China).
Data analysis
All data are presented as mean6standard error of the mean (SEM) and tested for statistical significance by analysis of variance (ANOVA) followed by the Dunnett’s post hoc test using StatView 5.0 program. When the probability (p) was less than 0.05, the values were considered significantly different.
Supporting Information
Table S1 The sequences of primer pairs used in real-time PCR.
(DOC)
Acknowledgments
We thank Dr. Liwei Sun for his assistance for helpful discussions in data analysis.
Author Contributions
Conceived and designed the experiments: HFQ ZWF. Performed the experiments: HFQ BLH SQY XJP. Analyzed the data: BLH SQY TW. Contributed reagents/materials/analysis tools: BLH SQY XJP. Wrote the paper: HFQ ZWF. Edited the manuscript: ZWF.
References
1. Codd GA, Lindsay J, Young FM, Morrison LF, Metcalf JS (2005) From mass mortalities to management measures. In: Huisman J, Matthijs HCP, Visser PM, eds. Harmful Cyanobacteria. Aquatic Ecology Series. The Netherlands: Springer. pp 1–23.
2. Paerla HW, Xu H, McCarthy MJ, Zhu G, Qin B, et al. (2011) Controlling harmful cyanobacterial blooms in a hyper-eutrophic lake (Lake Taihu, China): The need for a dual nutrient (N & P) management strategy. Water Res. pp 1973–1983.
3. Van Dolah FM (2000) Marine algal toxins: origins, health effects, and their increased occurrence. Environ Health Persp 108S1: 133–141.
4. Schrader KK, Nanayakkara NP, Tucker CS, Rimando AM, Ganzera M, et al. (2003) Novel derivatives of 9, 10-anthraquinone are selective algicides against the musty-odor cyanobacteriumOscillatoria perornata. Appl Environ Microbiol 69: 5319–5327.
5. Paerl HW (2008) Nutrient and other environmental controls of harmful cyanobacterial blooms along the freshwater-marine continuum. Adv Exp Med Biol 619: 216–241.
6. Cooper WJ, Zika RG (1983) Photochemical formation of H2O2in surface and ground waters exposed to sunlight. Science 220: 711–712.
7. Skurlatov YI, Ernestova LS (1998) The impact of human activities on freshwater aquatic systems. Acta Hydrochim. Hydrobiol 26(1): 5–12.
8. Dra´bkova´ M, Admiraal W, Marsa´lek B (2007) Combined exposure to hydrogen peroxide and light–selective effects on cyanobacteria, green algae, and diatoms. Environ Sci Technol 41: 309–314.
9. Barrington DJ, Ghadouani A (2008) Application of hydrogen peroxide for the removal of toxic cyanobacteria and other phytoplankton from wastewater. Environ Sci Technol 42: 8916–8921.
10. Qian H, Yu S, Sun Z, Xie X, Liu W, et al. (2010) Effects of copper sulfate, hydrogen peroxide and N-phenyl-2-naphthylamine on oxidative stress and the expression of genes involved photosynthesis and microcystin disposition in
Microcystis aeruginosa. Aquat Toxicol 99: 405–412.
11. Carmichael WW (1996) Toxic Microcystis and the environment. In: Watanabe MF, Harada K, Carmichael WW, Fujiki H, eds. Toxic Microcystis. Boca Raton: CRC Press. pp 1–11.
12. Mackintosh KA, Beattie S, Klumpp P, Cohen, Codd GA (1990) Cyanobacterial microcystine-LR is a potent and specific inhibitor of protein phosphatases 1 and 2A from both mammals and higher plants. FEBS Lett 264: 187–192. 13. Falconer IR, Humpage AR (1996) Tumour promotion by cyanobacterial toxins.
Phycologia 35: 74–79.
14. Kucho K, Okamoto K, Tsuchiya Y, Nomur S, Nango M, et al. (2005) Global analysis of circadian expression in the cyanobacteriumSynechocystissp. strain PCC 6803. J Bacteriology 187: 2190–2199.
15. Agrawal GK, Asayama M, Shirai M (1999) Light-dependent and rhythmicpsbA transcripts in homologous/heterologous cyanobacterial cells. Biochem Bioph Res Co 255: 47–53.
16. Ishiura M, Kutsuna S, Aoki S, Iwasaki H, Andersson CR, et al. (1998) Expression of a gene cluster kaiABC as a circadian feedback process in cyanobacteria. Science 281: 1519–1523.
17. Iwasaki H, Williams SB, Kitayama Y, Ishiura M, Golden SS, et al. (2000) A KaiC-Interacting sensory histidine kinase, SasA, necessary to sustain robust circadian oscillation in cyanobacteria. Cell 101: 223–233.
18. Chen TH, Chen TL, Hung LM, Huang TC (1991) Circadian-rhythm in amino acid uptake bySynechococcusRF-1. Plant Physiol 97: 55–59.
19. Golden SS, Ishiura M, Johnson CH, Kondo T (1997) Cyanobacterial circadian rhythms. Annu Rev Plant Physiol Plant Mol Biol 48: 327–354.
20. Mary I, Garczarek L, Tarran GA, Kolowrat C, Terry MJ, et al. (2008) Diel rhythmicity in amino acid uptake byProchlorococcus. Environ Microbiol 10: 2124–2131.
21. Straub C, Quillardet P, Vergalli J, de Marsac NT, Humbert J (2011) A day in the life ofMicrocystis aeruginosastrain PCC7806 as revealed by a transcriptomic analysis. PLoS ONE 6: e16208.
22. Wu T, Ni Y, Dong Y, Xu J, Song X, et al. (2010) Regulation of circadian gene expression in the kidney by light and food cues in rats. Am J Physiol Regul Integr Comp Physiol 298: 635–641.
23. Sto¨ckel J, Welsh EA, Liberton M, Kunnvakkam R, Aurora R, et al. (2008) Global transcriptomic analysis of Cyanothece 51142 reveals robust diurnal oscillation of central metabolic processes. Proc Nat Acad Sci USA 105: 6156–6161.
24. Zinser ER, Lindell D, Johnson ZI, Futschik ME, Steglich C, et al. (2009) Choreography of the transcriptome, photophysiology, and cell cycle of a minimal photoautotroph, Prochlorococcus. PLoS One 4: e5135.
25. Liu Y, Golden SS, Kondo T, Ishiura M, Johnson CH (1995) Bacterial luciferase as a reporter of circadian gene expression in cyanobacteria. J Bacterial 177: 2080–2086.
26. Murayama A, Ohmori K, Fujimura A, Minami H, Yasuzawa-Tanaka K, et al. (2008) Epigenetic control of rDNA loci in response to intracellular energy status. Cell 133: 627–639.
27. Huang TC, Chen HM, Pen SY, Chen TH (1994) Biological clock in the prokaryote Synechococcus RF-1. Planta 193: 131–136.
28. Xu Y, Mori T, Johnson CH (2000) Circadian clock-protein expression in cyanobacteria: rhythms and phase setting. The EMBO J 29: 3349–3357. 29. Kondo T, Ishiura M (2000) The circadian clock of cyanobacteria. BioEssays 22:
10–15.
30. Dodd A, Parkinson K, Webb AAR (2004) Independent circadian regulation of assimilation and stomatal conductance in the ztl-1 mutant ofArabidopsis. New Phytologist 162: 956–966.
31. Graf A, Schlereth A, Stitt M, Smith AM (2010) Circadian control of carbohydrate availability for growth inArabidopsisplants at night. Proc Nat Acad Sci USA 107: 9458–9463.
32. Wiedner C, Visser PM, Fastner J, Metcalf JS, Codd GA, et al. (2003) Effects of light on the microcystin content of microcystis strain PCC 7806. Appl Environ Microbiol 69: 1475–1481.
33. Bittencourt-Oliveira Mdo C, Kujbida P, Cardozo KHM, Carvalho VM, Moura Ado N, et al. (2005) A novel rhythm of microcystin biosynthesis is described in the cyanobacteriumMicrocystis panniformisKoma´rek et al. Biochem Bioph Res Com 326: 687–694.
34. Taniguchi Y, Takai N, Katayama M, Kondo T, Oyama T (2010) Three major output pathways from the KaiABC-based oscillator cooperate to generate robust circadiankaiBCexpression in cyanobacteria. Proc Natl Acad Sci USA 107: 3263–3268.
35. Haydon MJ, Bell LJ, Webb AAR (2011) Interactions between plant circadian clocks and solute transport. J Exp Bot 1: 2333–2348.
36. Wu T, Ni YH, Kato H, Fu ZW (2010) Feeding-induced rapid resetting of the hepatic circadian clock is associated with acute induction of Per2 and Dec1 transcription in rats Chronobio Int 27: 1–18.
37. Wu T, Jin YX, Kato H, Fu ZW (2008) Light and food signals cooperate to entrain the rat pineal circadian system. J Neurosci Res 86: 3246–3255. 38. Kotchoni SO, Larrimore KE, Mukherjee M, Kempinski CF, Barth C (2009)
Alterations in the endogenous ascorbic acid content affect flowering time in
Arabidopsis. Plant Physiol 149: 803–815.
39. Ditty JL, Williams SB, Golden SS (2003) A cyanobacterial circadian time mechanism. Annu Rev Genet 37: 513–543.
40. Livak KJ, Schmittgen TD (2001) Analysis of relative gene expression data using real-time quantitative PCR and the 22DDCt
method. Methods 25: 402–408. 41. Metcalf JS, Codd G (2000) Microwave oven and boiling waterbath extraction of
hepatotoxins from cyanobacterial cells. FEMS Microbiol Lett 184: 241–246. 42. Feng XG, Ding Z, Wei T, Yuan CW, Fu DG (2006) Identification and