Genetic Evidence for Elevated Pathogenicity
of Mitochondrial DNA Heteroplasmy in
Autism Spectrum Disorder
Yiqin Wang1, Martin Picard2,3, Zhenglong Gu1*
1Division of Nutritional Sciences, Cornell University, Ithaca, New York, United States of America,
2Department of Psychiatry, Division of Behavioral Medicine, Columbia University Medical Center, New York, New York, United States of America,3Department of Neurology, Division of Columbia Translational Neuroscience Initiative, Columbia University Medical Center, New York, New York, United States of America *[email protected]
Abstract
Increasing clinical and biochemical evidence implicate mitochondrial dysfunction in the pathophysiology of Autism Spectrum Disorder (ASD), but little is known about the biological basis for this connection. A possible cause of ASD is the genetic variation in the mitochon-drial DNA (mtDNA) sequence, which has yet to be thoroughly investigated in large genomic studies of ASD. Here we evaluated mtDNA variation, including the mixture of different mtDNA molecules in the same individual (i.e., heteroplasmy), using whole-exome sequenc-ing data from mother-proband-siblsequenc-ing trios from simplex families (n = 903) where only one child is affected by ASD. We found that heteroplasmic mutations in autistic probands were
enriched at non-polymorphic mtDNA sites (P= 0.0015), which were more likely to confer
deleterious effects than heteroplasmies at polymorphic mtDNA sites. Accordingly, we
observed a ~1.5-fold enrichment of nonsynonymous mutations (P= 0.0028) as well as a
~2.2-fold enrichment of predicted pathogenic mutations (P= 0.0016) in autistic probands
compared to their non-autistic siblings. Both nonsynonymous and predicted pathogenic mutations private to probands conferred increased risk of ASD (Odds Ratio, OR[95% CI] = 1.87[1.14–3.11] and 2.55[1.26–5.51], respectively), and their influence on ASD was most pronounced in families with probands showing diminished IQ and/or impaired social behav-ior compared to their non-autistic siblings. We also showed that the genetic transmission pattern of mtDNA heteroplasmies with high pathogenic potential differed between
mother-autistic proband pairs and mother-sibling pairs, implicating developmental and possiblyin
uterocontributions. Taken together, our genetic findings substantiate pathogenic mtDNA
mutations as a potential cause for ASD and synergize with recent work calling attention to their unique metabolic phenotypes for diagnosis and treatment of children with ASD. a11111
OPEN ACCESS
Citation:Wang Y, Picard M, Gu Z (2016) Genetic Evidence for Elevated Pathogenicity of Mitochondrial DNA Heteroplasmy in Autism Spectrum Disorder. PLoS Genet 12(10): e1006391. doi:10.1371/journal.pgen.1006391
Editor:Santhosh Girirajan, Pennsylvania State University, UNITED STATES
Received:June 12, 2016
Accepted:September 28, 2016
Published:October 28, 2016
Copyright:©2016 Wang et al. This is an open access article distributed under the terms of the
Creative Commons Attribution License, which permits unrestricted use, distribution, and reproduction in any medium, provided the original author and source are credited.
Data Availability Statement:All relevant data are within the paper and its Supporting Information files.
Funding:This work was supported by various funds from Cornell University, NSF MCB-1243588, NIH 1R01AI085286, and a grant for ENN science and technology development to ZG. The funders had no role in study design, data collection and analysis, decision to publish, or preparation of the manuscript.
Author Summary
Mitochondria contain their own genome, the mitochondrial DNA (mtDNA), and are abundant in the brain where they produce energy and intracellular signals required for normal brain function and cognition. Mitochondrial dysfunction has been proposed as a cause of Autism Spectrum Disorder (ASD), but the genetic basis has not been established. By analyzing mtDNA sequences from 903 ASD children along with their unaffected sib-lings and mothers, we found a unique pattern of heteroplasmic mtDNA mutations (the coexistence of both mutant and wide-type mtDNA molecules in a cell) associated with increased risk of ASD. A large fraction of these mtDNA heteroplasmies are pathogenic and can be either inherited maternally or acquired during development. Our findings unveil an important issue about pathogenic mtDNA heteroplasmy transmission between mothers and children, which could underlie many neurodevelopmental disorders in chil-dren that are shown to involve mitochondrial dysfunction. Evaluating mtDNA heteroplas-mies in high-risk families could help diagnosis and treatment of these diseases.
Introduction
Autism Spectrum Disorder (ASD) refers to a broad collection of complex, neurodevelopmental disorders, characterized by impairment of communicative and social interactions [1]. ASD usually manifests at an early stage of development in pre-pubertal children [2]. The current prevalence of ASD in the United States according to the 2014 annual report from The Centers for Disease Control and Prevention (CDC) is 1 in 68 children (1.47%), with a skewed gender ratio of 4 affected boys to 1 affected girl [3]. Population-based studies suggest an even higher prevalence of 2.24% in the United States [4]. Treatment for ASD mostly relies on behavioral interventions with specialized training to lessen social, verbal and cognitive deficits. However, the effectiveness varies widely among children with ASD and mild forms of symptoms such as attention deficit and social difficulties may persist throughout life [5].
Although ASD is traditionally described as a developmental disorder of the central nervous system, emerging evidence suggests that systemic physiological abnormalities, including dysre-gulated inflammation and immune system [6,7], elevated oxidative stress [8], and mitochon-drial dysfunction [9–12], are present in peripheral tissues as well as in brains of autistic patients [13]. Epidemiological studies also identified a staggeringly high comorbidity between ASD and mitochondrial disorder (MD) [14]. MD is a heterogeneous group of diseases due to maternally inherited or sporadic defects in genes encoding the mitochondrial oxidative phos-phorylation (OXPHOS) system [15], the core functional component of mitochondria responsi-ble for generating energy. MD usually results from genetic mutations on nuclear DNA or mitochondrial DNA (mtDNA) genes [15]. It has an extremely low birth prevalence of 6.2 in 100,000 children [16] and only about 1 in 4,300 adults is affected or at risk of developing MD [17]. However, the incidence of MD among autistic patients is estimated up to 5% by some studies [14], over 200-fold the incidence of MD in general populations. In addition, expression of OXPHOS genes has been shown to decrease in brains of autistic patients [18], suggesting a biological overlap in the pathogenesis of MD and ASD. Moreover, decreased activity of the five OXPHOS complexes has been observed in leukocytes, buccal cells, muscle biopsies and brains of autistic patients [11,14,19], suggesting the increased MD incidence among autistic patients is due not to a specific protein defect but to defects across components of the OXPHOS system.
Polymorphisms in genes in mitochondria-related pathways, such asPARK2[20] and
SLC25A12[21], were previously found to be associated with ASD in genome-wide or candidate gene association studies, suggesting a genetic basis. However, in recent comprehensive genetic studies among over two thousand affected families, few of the identified risk loci for ASD har-bor genes showing a direct link with mitochondrial function [22–25]. The results from mtDNA studies are also mixed. A number of studies demonstrated elevation of mtDNA dele-tions [10,26], point mutations [9,26,27], or copy numbers [10,28] in autistic patients. Interest-ingly, increased mtDNA copy number can occur secondarily to mitochondrial defects [29], further indicating the presence of genetic and/or functional defects in ASD. But few of these findings have been confirmed in large populations [30].
Because there are thousands of mtDNA molecules in a single cell, new mutations can arise and coexist with the wide-type mtDNA in a state called heteroplasmy, which has been impli-cated in a wide range of diseases [31,32]. To evaluate mtDNA heteroplasmy among healthy individuals, next-generation sequencing technologies such as mtDNA-targeted sequencing [33–36] or computational approaches, which directly leverage (off-target) reads from existing datasets produced by whole-genome sequencing [37,38] or whole-exome sequencing [39,40] have been widely harnessed in recent years. These approaches largely outperform Sanger sequencing and microarray-based sequencing in their ability to detect mtDNA heteroplasmies, and have proven practical for large population-based studies [37–39].
In the current study, we investigated the connection between mtDNA variation, especially heteroplasmy, and ASD by leveraging off-target reads from exome-sequencing data sets among simplex families from the Simons Foundation Autism Research Initiative (SFARI) Simons Col-lection deposited at the National Autism Research Database [23]. Each simplex family is com-posed of one autistic proband, his or her non-autistic sibling and their parents. Because the proband and the sibling have the same mtDNA background, share family environment, and are of comparable age, our study avoids genetic and environmental confounding factors that have limited the interpretation of studies among unrelated case-control pairs or child-parent pairs [30]. Given that the mtDNA is maternally inherited, we analyzed data for mother-pro-band-sibling trios from 903 simplex families and utilized stringent criteria to determine mtDNA homoplasmies and heteroplasmies. We then compared mtDNA variation between autistic probands and non-autistic siblings, along with the transmission pattern of mtDNA mutations between the mother and the child. We showed that autistic children have overrepre-sented pathogenic mutations on mtDNA distinct from their unaffected siblings. Our results offer an important angle to explain mitochondrial dysfunction in ASD patients, pointing towards the accumulation of mtDNA mutations of high pathogenic potential during develop-ment as one possible mechanism underlying the metabolic pathophysiology of ASD.
Results
Characteristics of mtDNA variants in the studied families
The whole-exome sequencing data for the SFARI Simons Collection were generated by three genome centers including CSHL (Cold Spring Harbor Laboratory), YALE (the Department of Genetics at the Yale School of Medicine) and UW (Genome Sciences at the University of Washington) [23]. Only reads generated by CSHL met our minimal mtDNA sequence cover-age depth, where reads from YALE and UW yielded on avercover-age less than 20% of mtDNA sites sequenced to>20X depth (S1 Fig). Hence, this study focused on the 933 families sequenced at
We first examined the distribution of mtDNA variants. In total, we identified 68,670 homo-plasmies according to the revised Cambridge Reference Sequence (rCRS) at 2,152 mtDNA polymorphic sites. Among them, up to 1,847 (85.8%) sites showed the minor allele in less than 1% of individuals, and 1,031 (47.9%) sites were unique to individual families (S2 Fig). When fil-tering high-confidence heteroplasmies at minor allele fraction (MAF)5%, we identified 677 heteroplasmies at 366 mtDNA sites. Based on this stringent criterion to define heteroplasmy, approximately 21.1% of individuals carried at least one heteroplasmy on mtDNA. Individual (n = 229, 62.6%) or family (n = 323, 88.3%) specific heteroplasmies contributed to the majority of the heteroplasmic sites detected (S2 Fig). Only one heteroplasmy, located at position 16,093 in the D-loop region, was present in1% of individuals.
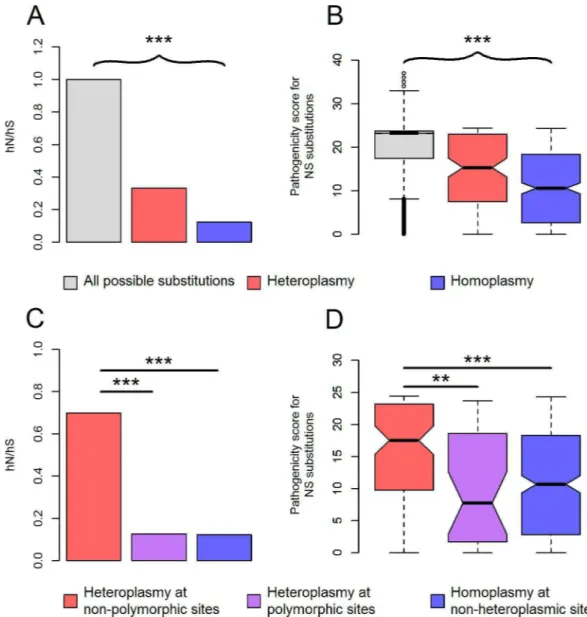
Consistent with our previous findings in the 1000 Genomes population [37,41], we found strong evidence to support the extensive purifying selection on mtDNA. For both homoplas-mies and heteroplashomoplas-mies, their nonsynonymous-synonymous rate ratio was significantly less than one (P<5x10-19,Fig 1A); their pathogenic potential at nonsynonymous sites was
consid-erably lower than that of all possible, nonsynonymous nucleotide substitutions on mtDNA (P<2x10-14,Fig 1B). Of note, compared to homoplasmies, heteroplasmies exhibited higher
nonsynonymous-synonymous rate ratio (P= 1.2x10⁻¹¹,Fig 1A), along with elevated pathoge-nicity at nonsynonymous sites (P= 1.5x10⁻⁴,Fig 1B). This may be due to mitochondrial thresh-old effect [42], which masks deleterious phenotypes of low-fraction mtDNA heteroplasmies, allowing them to persist without being purged by natural selection.
We found that 194 (53.0%) heteroplasmic sites were located at polymorphic sites. Interest-ingly, only heteroplasmies at non-polymorphic sites exhibited inflated pathogenicity compared to homoplasmies (P<1.7x10⁻⁶,Fig 1C and 1D). mtDNA heteroplasmies at non-polymorphic
sites also possessed very low relative mutation rates (S3 Fig). Both features impeded the intro-duction of these mutations into the phylogenetic tree; low mutation rates were responsible for the rare occurrence of these mutations in the first place; if they did mutate and appeared ini-tially in the heteroplasmic state, purifying selection would act on them as soon as the mutant allele fraction exceeded the mitochondrial threshold for manifesting the associated, deleterious phenotype affecting survival or reproduction. The opposite case lies in the mtDNA mutations that have been shown to have entered the phylogenetic tree multiple times, demonstrating low pathogenicity and high relative mutation rates [43]. In comparison with homoplasmies at non-heteroplasmic sites, heteroplasmies at polymorphic sites exhibited similar level of pathogenic-ity (Fig 1C and 1D), but were more likely to mutate (Mann-Whitney test,P= 8x10-32,S3 Fig), suggesting their high incidence of being heteroplasmic may be primarily the consequence of their inherent, high mutation rates.
Elevated pathogenicity of mtDNA mutations in autistic probands
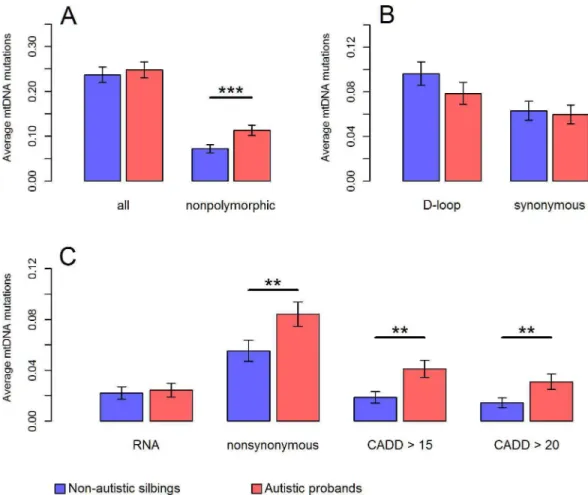
Given evidence on mitochondrial implication in ASD, we postulated that autistic probands might carry mutation burden on mtDNA, especially mutations prone to confer deleterious effects on OXPHOS. To test this hypothesis, we directly compared the number as well as the distribution of mtDNA mutations, at segregating sites within each family, between autistic pro-bands and their non-autistic siblings. For this comparison, we analyzed mtDNA sites where all members in a family had>40X sequencing depth. Among the 903 families, 191 autisticwere more likely to be located at polymorphic sites in autistic probands than those in non-autistic siblings (Chi-squared test,P= 0.0015). The incidence of heteroplasmic mutations at non-polymorphic sites was 53% higher in autistic probands compared to non-autistic siblings (0.11 per proband vs. 0.072 per sibling,P= 0.0003,Fig 2A).
Because the observed pathogenicity of mtDNA mutations was primarily attributed to het-eroplasmies at non-polymorphic sites (Fig 1C and 1D), overrepresented mutations at non-polymorphic sites might imply an elevated pathogenicity. As expected, further stratifying Fig 1. Characteristics of mtDNA variants. (A)The nonsynonymous-synonymous rate ratio (hN/hS) for all possible nucleotide substitutions, observed heteroplasmies, and homoplasmies on mtDNA. hN is the number of nonsynonymous substitutions divided by the total number of possible nonsynonymous substitutions on mtDNA; similarly, hS is the number of synonymous substitutions divided by the total number of possible synonymous substitutions on mtDNA [34]. The ratio of hN and hS is indicative of purifying selection if it is significantly less than one [34].(B)The box plot of CADD pathogenicity scores for all possible substitutions, observed heteroplasmies and homoplasmies at nonsynonymous sites on mtDNA.(C, D)hN/hS(C)and CADD pathogenicity scores of nonsynonymous substitutions(D)for heteroplasmies at non-polymorphic sites, heteroplasmies at polymorphic sites and homoplasmies at non-heteroplasmic sites. Each nucleotide substitution was only counted at most once. ***P<2x10⁻⁴;
**P<2x10⁻³;P: p values for Chi-squared test(A,C)or Mann-Whitney test(B,D).
mutations according to their functional annotations revealed that autistic probands carried 52% more nonsynonymous mutations (0.084 per proband vs. 0.055 per sibling;P= 0.0028,Fig 2C), and 118% more predicted pathogenic mutations compared to non-autistic siblings (0.041 per proband vs. 0.019 per sibling;P= 0.0016,Fig 2C). Autistic probands also had roughly twice as many mutations associated with disease as their non-autistic siblings had (0.012 per proband vs. 0.006 per sibling;P= 0.017,S4 Fig). Additionally, the observed increases of pathogenic mutations in autistic probands were insensitive to changes in minimum DAF we used for defining mutations (from 2% to 8%,S5 Fig). In line with these results, there was no significant evidence on mutation burden at synonymous sites as well as in the D-loop region (P>0.6,Fig
2B), which were normally considered to harbor relatively neutral variants [44].
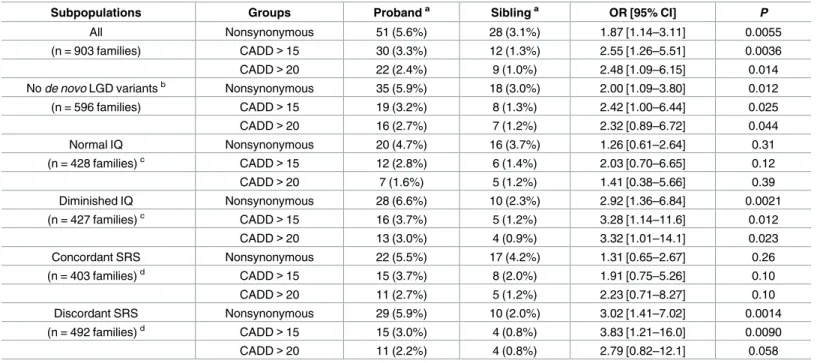
There were 265 mtDNA mutations that were private to only one child within a family: its derived allele was undetectable or had fraction<2% in the other child. Carrying
nonsynon-ymous private mutations was associated with an increased risk of ASD (Odds Ratio, OR: 1.87, P= 0.0055,Table 1). Likewise, carrying private mutations of predicted pathogenicity more than doubled the risk of ASD (OR: 2.55,P= 0.0036,Table 1). Among the 596 families whose Fig 2. Comparison of mtDNA mutation burden and pathogenicity between autistic probands and non-autistic siblings.Mutation burden was calculated using mutations with DAF5% at mtDNA sites where all members in a family had>40X sequencing depth. The average number of mutations per individual was shown in
(A)for all valid sites and non-polymorphic sites, in(B)for sites in the D-loop region and synonymous sites in the coding region, and in(C)for sites in the RNA region, nonsynonymous sites in the coding region, and mutations predicted pathogenic with CADD Phred score>15 or>20. Results in the main text were based on “CADD>15”. Error bars represent the standard error of the mean.***P<0.001;**P<0.01;*P<0.05;P: p values for one-tailed paired t-test.
ASD risk was not attributed to anyde novolikely gene-disruptive (LGD) SNVs or CNVs in the nuclear genomes [23,24], we attained comparable ORs for ASD risk at 2.00 and 2.42 for nonsy-nonymous private mutations and pathogenic private mutations, respectively (P<0.025,
Table 1). Therefore, the observed association between mtDNA mutations and ASD is unlikely to be contingent upon spontaneous nuclear gene mutations.
Pathogenic mtDNA mutations correlate with ASD-associated
phenotypes
We further sought to investigate the relationship between mtDNA mutations and ASD-associ-ated phenotypes, including cognitive ability and social behavior. Compared to ORs in total families, the ORs for ASD risk were attenuated when estimated only in families with the pro-band classified as having normal intelligence quotient (full-scale IQ>85, referred to
through-out as IQ) (Table 1). A similar attenuated genetic contribution to ASD was also identified in previous nuclear genome studies [23,24], suggesting a predominant role of genetic factors in the pathogenesis of ASD only in the context of diminished IQ. Next, we retrieved the Social Responsiveness Scale scores for probands and siblings (parent-reported total SRS T scores, referred to throughout as SRS) in the 903 families, which is a measure of ASD severity in natu-ral social settings. We defined families with discordant proband-sibling social behavior using criteria according to Krummet al. [24] where autistic probands demonstrated severe social Table 1. Contribution of private mtDNA mutations to ASD.
Subpopulations Groups Probanda Siblinga OR [95% CI]
P
All Nonsynonymous 51 (5.6%) 28 (3.1%) 1.87 [1.14–3.11] 0.0055
(n = 903 families) CADD>15 30 (3.3%) 12 (1.3%) 2.55 [1.26–5.51] 0.0036
CADD>20 22 (2.4%) 9 (1.0%) 2.48 [1.09–6.15] 0.014
Node novoLGD variantsb Nonsynonymous 35 (5.9%) 18 (3.0%) 2.00 [1.09–3.80] 0.012
(n = 596 families) CADD>15 19 (3.2%) 8 (1.3%) 2.42 [1.00–6.44] 0.025
CADD>20 16 (2.7%) 7 (1.2%) 2.32 [0.89–6.72] 0.044
Normal IQ Nonsynonymous 20 (4.7%) 16 (3.7%) 1.26 [0.61–2.64] 0.31
(n = 428 families)c CADD>15 12 (2.8%) 6 (1.4%) 2.03 [0.70–6.65] 0.12
CADD>20 7 (1.6%) 5 (1.2%) 1.41 [0.38–5.66] 0.39
Diminished IQ Nonsynonymous 28 (6.6%) 10 (2.3%) 2.92 [1.36–6.84] 0.0021
(n = 427 families)c CADD>15 16 (3.7%) 5 (1.2%) 3.28 [1.14–11.6] 0.012
CADD>20 13 (3.0%) 4 (0.9%) 3.32 [1.01–14.1] 0.023
Concordant SRS Nonsynonymous 22 (5.5%) 17 (4.2%) 1.31 [0.65–2.67] 0.26
(n = 403 families)d CADD>15 15 (3.7%) 8 (2.0%) 1.91 [0.75–5.26] 0.10
CADD>20 11 (2.7%) 5 (1.2%) 2.23 [0.71–8.27] 0.10
Discordant SRS Nonsynonymous 29 (5.9%) 10 (2.0%) 3.02 [1.41–7.02] 0.0014
(n = 492 families)d CADD>15 15 (3.0%) 4 (0.8%) 3.83 [1.21–16.0] 0.0090
CADD>20 11 (2.2%) 4 (0.8%) 2.79 [0.82–12.1] 0.058
aData are the number of individuals carrying private mutations (percentage of families).
bfamilies whose ASD risk was not attributed tode novoLGD SNVs or CNVs; data on exomicde novoLGD SNPs and CNVs were obtained from references [23,24].
cfamilies with probands having full-scale IQ>85 or
85; IQ information for 48 families was not available.
dFamilies with discordant SRS scores had proband SRS score>75 and sibling SRS score<50; otherwise they were considered as having concordant SRS scores; proband and sibling SRS scores were not available in 8 families.
CADD: mutations predicted pathogenic with CADD Phred score>15 or>20; results in the main text were based on “CADD>15”;P: one-tailed p values for Fisher’s exact test.
impairments (SRS score>75) as opposed to their non-autistic siblings (SRS score<50). We
found that ORs of mtDNA mutations for ASD risk were stronger in families with discordant SRS scores between probands and siblings than families with concordant SRS scores (Table 1), indicating that mtDNA mutations might segregate with autistic behavioral phenotypes at a family level.
Because behavioral impairment inversely correlated with cognitive ability in autistic pro-bands (Pearson correlation coefficient between SRS scores and IQ,r= -0.22,P= 4.5x10⁻¹¹), we further stratified the 903 families into four groups according to the criteria on both IQ and SRS scores. Even though the sample sizes were getting smaller in each category, the effects of mtDNA private mutations on ASD were most significant (ORs = 3.56–4.61, Fisher’s exact test, P<0.09,S1 Table) in families with discordant proband-sibling SRS scores and diminished
pro-band IQ, and were least pronounced (ORs = 0.90–1.77, Fisher’s exact test,P>0.27,S1 Table) in
families with concordant SRS scores and normal proband IQ, suggesting that the observed con-tribution of mtDNA mutations to ASD was mostly attributed to families with probands show-ing noticeable deficits in cognition and/or social interactions distinct from their siblshow-ings.
Of note, the incidence of private mtDNA mutations was consistently higher in autistic pro-bands of the diminished IQ group than that of the normal IQ group (3.0%–6.6% vs. 1.6%– 4.7%,Table 1). To examine whether carrying private mtDNA mutations affects cognitive abil-ity, we further analyzed the impact of private mtDNA mutations on IQ as well as intellectual disability (ID, which we defined as IQ<70) among autistic probands. In the 903 families,
pro-band IQ was significantly associated with family ancestry (one-way ANOVA,P<4.8x10⁻¹⁰). To
avoid such confounding factors on proband IQ comparisons among families, we focused on 638 probands of the major ethnic group in the current study for further analysis (S6 Figand
Table 2). Private mtDNA mutations detected at non-polymorphic sites were significantly asso-ciated with decreased proband IQ (linear regression,β= -7.8,P= 0.02,S6 Fig). Similar effects on IQ were also observable for nonsynonymous and predicted pathogenic mtDNA mutations private to probands, but the correspondingPvalues were not significant (β= -7.3 –-5.6, P= 0.15–0.27,S6 Fig). A considerable decrease in IQ was identified in probands with disease-associated private mtDNA mutations which lowered the average IQ by approximately 25 points compared to those devoid of these mutations (P= 0.01,S6 Fig).
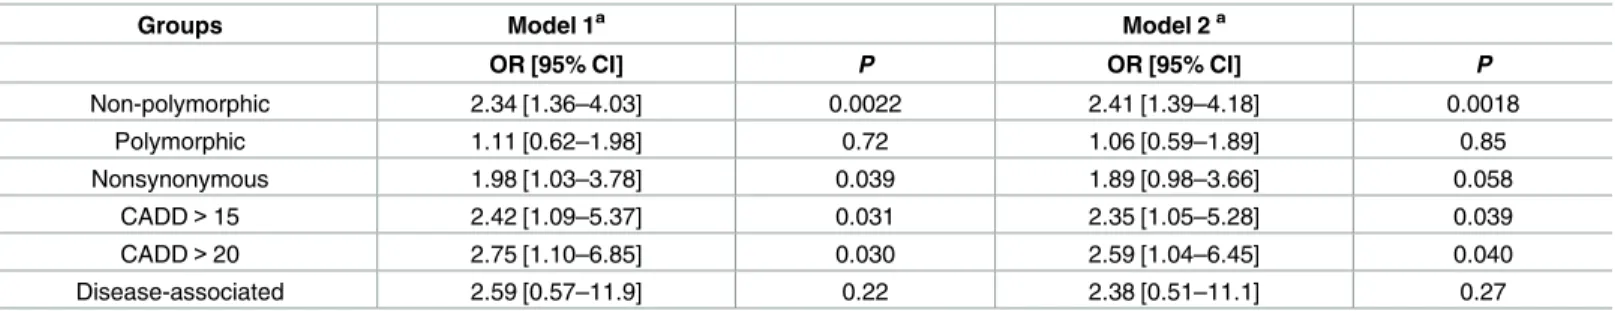
We then asked whether the observed shift of IQ distribution could lead to comorbidity of ASD and ID by using logistic regression. We found that mtDNA mutations at
non-Table 2. Contribution of private mtDNA mutations to ID in ASD.
Groups Model 1a Model 2a
OR [95% CI] P OR [95% CI] P
Non-polymorphic 2.34 [1.36–4.03] 0.0022 2.41 [1.39–4.18] 0.0018
Polymorphic 1.11 [0.62–1.98] 0.72 1.06 [0.59–1.89] 0.85
Nonsynonymous 1.98 [1.03–3.78] 0.039 1.89 [0.98–3.66] 0.058
CADD>15 2.42 [1.09–5.37] 0.031 2.35 [1.05–5.28] 0.039
CADD>20 2.75 [1.10–6.85] 0.030 2.59 [1.04–6.45] 0.040
Disease-associated 2.59 [0.57–11.9] 0.22 2.38 [0.51–11.1] 0.27
Associations of ID (defined as full-scale IQ<70) with proband-private mtDNA mutations were computed in 638 probands of the major ethnic group among the 903 families who had a reported family ancestry of “white” or “more-than-one-race” and an mtDNA-haplogroup inferred maternal ancestry of “Europe”. aOR (odds ratio), 95% CI (confidence interval) of OR, andPvalues were computed for mutations in each category using logistic regression Model 1 (adjusting for age and sex) and Model 2 (adjusting for age, sex, SRS scores and whether carryingde novoLGD SNPs or CNVs on nuclear DNA). CADD: mutations predicted pathogenic with CADD Phred score>15 or>20; results in the main text were based on “CADD>15”.
polymorphic sites as well as nonsynonymous and predicted pathogenic mtDNA mutations that were private to probands significantly increased the risk of ID in ASD (ORs = 1.98–2.75, P= 0.0022–0.039,Table 2), The estimated ORs did not qualitatively change after additional adjustment for ASD severity (proband SRS scores) and whether carryingde novoLGD SNPs or CNVs on nuclear DNA (Table 2). It suggests that mtDNA mutations and the resulting mito-chondrial dysfunction may be responsible for intellectual disability in ASD, which is consistent with clinical reports on ASD-ID cases who manifested defects in mitochondrial OXPHOS [45].
Different mother-to-child mtDNA mutation transmission between autistic
probands and non-autistic siblings
Because mtDNA is uniquely inherited from the mother [46], this dataset also provided us a great opportunity to investigate the transmission pattern of mtDNA mutations from mothers to children. Among all inherited events of homoplasmies from the mother to the child, 99.3% (45,488) were direct transmissions of maternal homoplasmies, and the remaining 0.7% of events resulted from the fixation of either the major allele (n = 295) or the minor allele (n = 6) of maternal heteroplasmies. Among all mother-child pairs, we only identified one possiblede novohomoplasmy in a non-autistic sibling (family id: 12899), located in the D-loop region (143G>A), whose mutant allele A was not detected in either the mother or the autistic
proband.
There was a significant correlation of derived allele fractions for heteroplasmies between the mother and the child (Pearson correlation coefficientr= 0.38,P= 1.9x10⁻¹⁰). For heteroplas-mies with MAF5% in the child, 53.1% were shared with the mother, and therefore were inherited, in agreement with previous studies [36,38]. The proportion of inherited heteroplas-mies decreased to 33.7%, when we lowered the minimum MAF in calling heteroplasheteroplas-mies in children to 2% (S7 Fig), indicating that a majority of heteroplasmies in children could be of developmental origin. However, we might underestimate the proportion of inherited hetero-plasmies, since some heteroplasmies might be of low fraction or somatically lost in the mother.
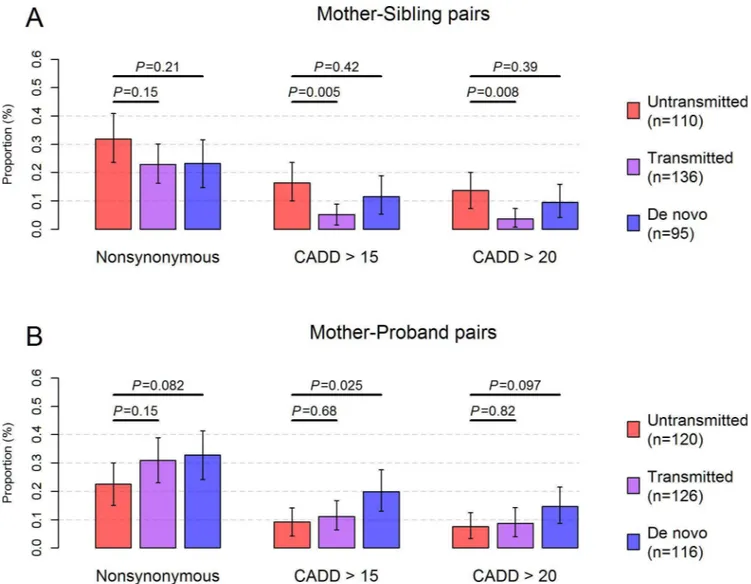
It has been shown that purifying selection operates during oogenesis and early embryogene-sis to reduce the possibility of pathogenic mtDNA mutations being transmitted to the subse-quent generation [47]. This mtDNA quality control mechanism ensures the OXPHOS
function in the maternal germ line and thereby in the child [48]. The influence of this purifica-tion selecpurifica-tion process was evidenced in our dataset with a significant decrease in the proporpurifica-tion of transmitted mutations that were predicted pathogenic, compared to that of untransmitted mutations in mother-sibling pairs (P= 0.005,Fig 3A). However, evidence of the purification selection disappeared when computed in mother-autistic proband pairs, which might be skewed by the ascertainment of disease status in autistic probands [49] (Fig 3B). Interestingly, de novomutations in autistic probands showed an even higher proportion of predicted patho-genic mutations compared to untransmitted mutations (P= 0.025,Fig 3B) in mother-autistic proband pairs.
To ascertain the pathogenic mutation burden observed in autistic probands, we further cal-culated the changes of derived allele fractions between mutations in the mother and mutations in the child (ΔDAF = DAFchild–DAFmother). Overall,ΔDAF followed a normal distribution
pathogenic potential differed between mother-autistic proband pairs and mother-sibling pairs, resulting in a greater abundance of these mutations on mtDNA in autistic children.
Discussion
By employing a set of stringent criteria in calling heteroplasmies, we found a prevalence that 21.1% of individuals carry at least one medium-to-high fraction heteroplasmy with MAF of at least 5%. In order to draw meaningful comparisons with previous studies, we re-calculated the prevalence of heteroplasmy by applying the same MAF detection threshold at 5% in studies using blood specimens. In Rebolledo-Jaramilloet al.’s study, the prevalence of heteroplasmy is Fig 3. Transmission pattern of pathogenic mtDNA mutations.The proportion of untransmitted (red), transmitted (purple) andde novo(blue) mutations that were nonsynonymous or predicted pathogenic was shown in (A) for mother-sibling pairs and in (B)for mother-proband pairs. Only mtDNA sites (n = 448) detected with high-confidence heteroplasmies (MAF5%) orde novohomoplasmies were used for calculation. Untransmitted mutations were defined as mutations present in the mother, but were undetectable or had DAF<2% in the child. Likewise,de novomutations were defined as those present in the child, but were undetectable or had DAF<2% in the mother. Transmitted mutations were mutations shared between the mother and the child with DAF2%. The total number of untransmitted, transmitted andde novomutations was indicated in parentheses for mother-sibling pairs and mother-proband pairs in the legend. Error bars represent the 95% confidence interval of the proportion estimated based on 10,000 bootstrap samples. CADD: mutations predicted pathogenic with CADD Phred score>15 or>20. Results in the main text were based on “CADD>15”;P: p values for Fisher’s exact test.
30.8% among 39 children and 41.0% among their mothers [36]. Liet al. also identified a 41.0% prevalence of heteroplasmy in the blood specimens from 139 individuals with an average age of 58 [34]. Both studies employed mtDNA-targeted deep sequencing to sequence mtDNA to an extremely high coverage, yielding sufficient power for detecting heteroplasmies with MAF down to 1%. Using a similar design to our study, Dinget al. attained a 33.2% prevalence of het-eroplasmy among 2,120 individuals with an average age of 47 years by analyzing the whole-genome sequencing data of SardiNIA Project participants [38]. A 180X depth of average cover-age was obtained on mtDNA. Dinget al. also noticed a considerable elevation of heteroplasmy incidence among elderly Sardinians [38]. Hence, the prevalence of heteroplasmy among chil-dren and young adults could be lower than 33.2%, which was close to our estimate of hetero-plasmy prevalence at 21.1%. A 20–30% prevalence of medium-to-high fraction heteroplasmies in blood was also verified by Sanger-based sequencing, showing that both the prevalence and frequency spectrum of mtDNA heteroplasmies were largely comparable to results generated by massively parallel sequencing [50].
The average depth of mtDNA coverage was significantly lower in mothers (132X [interquar-tile range, IQR:96X-150X], t-test,P<0.0003) than that in siblings (142X [IQR:103X-162X])
and probands (148X [IQR:105X-166X]). This effect could be related to age-dependent decrease of mtDNA copy number in blood [38], and could theoretically have influenced some results in the study. However, the difference of mtDNA coverage between probands and siblings in this dataset was minor and was not statistically significant (t-test,P= 0.074). To ensure such differ-ences in mtDNA sequencing coverage did not confound our results, we performed a proof-of-concept analysis by down-sampling the complete dataset to harmonize sequencing coverage in the mother-proband-sibling trio of each family. In brief, we down-sampled reads of individuals to the lowest depth sequenced in the mother-proband-sibling trio at each mtDNA site. This procedure ensured that individuals from the same family had equal sequencing coverage at every mtDNA site, thus eliminating the possible influence of distinct sequencing coverage on heteroplasmy calling between different groups. Results from this analysis showed that a similar number of heteroplasmies were detected from down-sampled reads compared to total reads in all groups (S1 Text), indicating that lowering read counts in some individuals did not decrease power to identify heteroplasmy differences among family members. The difference between the complete and the down-sampled datasets among mothers, siblings, and probands was also comparable to each other (Fisher’s exact test,P>0.34 for pair-wise comparisons,S1 Text).
Moreover, the enrichment of nonsynonymous and predicated pathogenic mutations in pro-bands remained consistent in independent down-sampling analyses, close to the enrichment level that we computed based on total reads (S9 Fig). Down-sampling reads in each family also did not qualitatively alter the transmission pattern of heteroplasmies between mothers and children (S1 Text). Overall, this test indicated that sequencing coverage differences between mothers and children did not significantly bias heteroplasmy calling and comparisons in the current study.
We found that autistic probands carried overrepresented heteroplasmic mutations at non-polymorphic mtDNA sites, resulting in a ~1.5-fold enrichment of nonsynonymous mutations (P= 0.0028) as well as a ~2.2-fold enrichment of predicted pathogenic mutations (P= 0.0016) compared to those in non-autistic siblings (Fig 2C). The enrichment of predicted pathogenic mutations in autistic probands was not affected by the pathogenicity scores used and was fur-ther confirmed by the analysis of disease-associated mutations (S4 Fig). These results point to significant elevation of pathogenicity on mtDNA for autistic patients and thus provide a molecular basis for mitochondria-related pathophysiological phenotypes, as well as the high prevalence of MD among autistic patients [14,19].
In addition, we observed an overrepresented transmission of mtDNA mutations of high pathogenic potential from the mother to the autistic proband (Fig 3andS2 Table). Due to the complete maternal inheritance of mtDNA [46,54], purifying selection in the maternal line may retain pathogenic mutations that possess a high mitochondrial threshold in females but a low mitochondrial threshold in males [55]. A recent study showed a male-biased expression profile for mitochondria-related genes during early childhood and puberty in the human brain [56]. Accordingly, pathogenic mtDNA mutations may adversely impact brain function when trans-mitted from the mother to the male proband, possibly contributing to the observed sexual dimorphism whereby males are more susceptible to neurodevelopmental disorders [57].
Of interest, such a transmission pattern of ASD-associated variants is also evidenced by the maternal transmission disequilibrium of nuclear LGD SNVs and rare CNVs in male autistic probands, but is inconclusive in female probands [24]. We assume that there can be a similar sex-dependent effect of pathogenic mtDNA heteroplasmies on ASD. Of the 903 families, there were 815 and 88 families with male and female probands, respectively, for a ratio of male: female of 9.3:1. A significant difference in transmission pattern was identified for nonsynon-ymous and predicted pathogenic mtDNA heteroplasmies in male probands compared to that in their siblings (ratio>1.3, one-tailed paired t-test,P<0.02,S2 Table), but no difference was
present in families with female probands (ratio = 1,S2 Table). In contrast, comparable trans-mission patterns of mtDNA heteroplasmies to autistic probands were found when we stratified families according to the sibling sex. Given that the sample size of female probands was rather small in the current dataset, additional data on more ASD families with female probands would be required to confirm this finding and potentially reveal other differences in mtDNA heteroplasmy between families with male probands and families with female probands.
The majority (>65%) of mtDNA mutations detected in the current study had derived allele
fraction in the range of 5% to 20%, below the clinical threshold for most disease-causing het-eroplasmies [42]. It is still elusive how low-to-medium fraction heteroplasmies affect mito-chondrial function. Picardet al. found that cells harboring the mtDNA m.3243A>G
heteroplasmic mutation undergo a biphasic phenotypic change in response to the rise of het-eroplasmy level; a medium hethet-eroplasmy level (10%-30%) is presumed to cause mild OXPHOS deficiency in Diabetes [58] and Autism [59], while a high heteroplasmy level (50%-90%) gives rise to diverse, severe forms of neurodegenerative diseases such as mitochondrial encephalo-myopathies [60]. Hence, individuals carrying a high degree of mtDNA heteroplasmies are prone to manifest systematic symptoms of MD rather than behavioral signs of ASD. Indeed, it is estimated that 10%-20% of MD patients have some autistic endophenotypes, further suggest-ing a possible, shared etiology for these two diseases [19].
diagnosed with epilepsy (S3 Table). One autistic child was found to have anorexia nervosa and the other two were reported with movement abnormalities (S3 Table). Early signs of metabolic or developmental defects related to MD [64] in these 33 autistic children included neonatal hypotonia (n = 3) and hypoglycemia (n = 3) (S3 Table), both of which were identified as risk factors for ASD [65,66]. Medical records also revealed a significantly higher incidence of men-tal retardation among the 33 autistic children than that in the rest of the database (Fisher’s exact test,P= 0.048,S3 Table), in line with our findings on the negative association between pathogenic mtDNA mutations and IQ. The overall prevalence of aforementioned abnormali-ties was 1.2 times higher in these 33 autistic children than other autistic children included in this study as well as in the rest of the SFARI database (36.4% vs. 16.7%, Fisher’s exact test, P<0.008,S3 Table). Furthermore, a decrease in height was found among these autistic children
compared to other autistic children in the SFARI database (Mann-Whitney test,P= 0.026,S3 Table). Shorter stature was previously proposed as one of the major symptoms of MD [61,67] and was discovered in patients with mtDNA(m.3243A>G) heteroplasmy-caused diabetes (i.e.
maternally inherited diabetes and deafness, MIDD) compared to non-MIDD diabetic patients such as patients diagnosed with type 1 or type 2 diabetes [68], suggesting a common underlying pathophysiology of mtDNA origin. Taken together, these evidence indicate that pathogenic mtDNA mutations may be responsible for a wide range of developmental abnormalities in chil-dren which confer susceptibility to ASD. It also calls attention to ASD chilchil-dren with one or more developmental abnormalities or related co-morbid clinical conditions for further testing on mtDNA and mitochondrial defects.
In sum, our findings support the connection between mtDNA variation and ASD, and call on further mtDNA-targeted deep sequencing and functional studies in more ASD families, which are of great importance to understand mtDNA mutation patterns and their contribution to ASD-related phenotypes. Indeed, mitochondrial dysfunction has been implicated in many childhood disorders, especially neurodevelopmental disorders [69]. These diseases manifest metabolic and physiological phenotypes that converge upon mitochondrial dysfunction, and may have mtDNA defects as a common harbinger. Further understanding the genetic architec-ture of mitochondrial genome in these phenotypes will provide crucial insights into pathogene-sis, diagnopathogene-sis, and treatment of these diseases.
Materials and Methods
Study samples and sequencing data
Sequencing data processing
We first extracted sequencing read pairs mapped to mtDNA from the downloaded alignment files. In order to filter out reads resulting from nuclear mitochondrial sequences (NUMTs), extracted reads were realigned to the complete human reference genome consisting of both human nuclear DNA and mtDNA sequences by using BWA (version 0.7.2) [71]. The reference sequences of the GRCh38 human genome assembly were obtained from the 1000Genomes project ftp site [41]. Reads mapped to the nuclear DNA were removed. Next, we performed a series of data processing steps to ensure the quality of remaining reads for calling mtDNA homoplasmies and heteroplasmies, including (1) local realignment around indels; (2) base quality recalibration; (3) detection and exclusion of duplicated reads, reads shorter than 40 bp, reads with5% mismatches, as well as reads that were not aligned in a pair on mtDNA. The remaining reads were then piled up against the revised Cambridge Reference Sequence (rCRS) by using “samtool mpileup” with a mapping quality filter at 20 [72]. The list of tools and spe-cific commands employed in each step was detailed inS10 Fig. A comparison of methods for heteroplasmy calling with previous studies was given inS4 Table.
Point homoplasmy and heteroplasmy calling
To reduce the false positive rate, we only considered reads with a recalibrated base quality Phred score20 (tantamount to0.01 sequencing error) for calling point homoplasmies and heteroplasmies. For homoplasmy, the alternative allele according to rCRS must be supported by at least 10 reads and not be in the heteroplasmic state. Criteria for calling heteroplasmies encompassed (1)>40X depth of coverage, (2) the alternative allele being observed on both
strands, and (3) comparable allele fractions calculated from reads mapped to two strands (Fish-er’s exact test,P0.01). We also required that an mtDNA site was valid for calling heteroplas-mies if its median site coverage was>70X depth in the study population. Based on one-tailed
power calculation for one sample proportion test, it yielded>90% power of detecting real
het-eroplasmies with minor allele fraction (MAF)5% over 1% sequencing error (S11 Fig). As a result, we obtained a total of 12,180 candidate heteroplasmies from 13,704 valid mtDNA sites (83% of total mtDNA sites,S5 TableandS12 Fig).
Maximum likelihood based approach for estimating heteroplasmy
fraction
Next, we utilized a maximum likelihood based approach to estimate MAF for each hetero-plasmy by taking into account the base quality information of covered reads [37,40]. In brief, the likelihood of observing n reads with the minor allele and m reads with the major allele at a particular site was computed as:
Lðfjmapped readsÞ ¼Y
n
i¼1
ðð1 fÞε
iþfð1 εiÞÞ
Ym
i¼1
ðð1 fÞð1 ε
iÞ þfεiÞ
, where f refers to the MAF of interest andεiis the corresponding sequencing error for mapped read i. We then took the maximum-likelihood estimate of f and calculated the log likelihood ratio between the heteroplasmic model and the homoplasmic model (LLR = log(L(^f)/L(f^0))).
LLR score>5 was used as a criterion to define heteroplasmies of high confidence, equivalent to
a false positive rate<10−5[40].
complications from nuclear mitochondrial sequences (NUMTs). Both give rise to a much lower transition-to-transversion (Ti/Tv) ratio compared to real heteroplasmies on mtDNA, which predominantly arise from mutations caused by endogenous, mtDNA polymerase repli-cation errors [51]. When filtered at MAF5%, high-confidence heteroplasmies yielded a Ti/ Tv ratio of 29.5, in line with the hypothesized mutation pattern of mtDNA. High-confidence heteroplasmies could be recovered with the LLR score filter>5 down to MAF = 2% (greater
than the base quality error threshold 1% used), which had a Ti/Tv ratio comparable to that of heteroplasmies with MAF5% (22.8 vs. 29.5; chi-square testP= 0.5;S6 Table). But the major-ity of low-fraction heteroplasmies (MAF<5%) were probably missing due to insufficient
sequencing depth.
Sample quality control
We first removed 19 samples with average mtDNA coverage40X depth. To minimize DNA contamination problems, we further removed samples (n = 19) if they had (1)>5
heteroplas-mies located at polymorphic mtDNA sites in this population and/or (2)>50% of
heteroplas-mies detectable as homoplasheteroplas-mies in another sample, which also accounted for>50% of
homoplasmic sites in that particular sample distinct from those in the sample under investiga-tion. Contamination detection was based on high-confidence heteroplasmies with MAF2%. 903 (97.1%) families with sequencing data from the proband, the sibling and the mother remained and were used for further analysis. The exome sequencing data from the father were processed using the same method but were only utilized for exploring data quality and detect-ing sample contamination. The average depth of mtDNA coverage in the remaindetect-ing samples was ~141X, comparable to the coverage reported in previous studies using whole-exome or whole-genome sequencing data [38,39,73]. Comparisons of site-specific sequencing coverage for homoplasmic and heteroplasmic sites also showed strong correlations between individuals within the same family (R2>0.6,S14 Fig).
After sample quality control, we obtained 677 high-confidence heteroplasmies with MAF
5% in 903 families (S1 Dataset). We checked the mtDNA site for each of the 677 heteroplas-mies within the family where it was found. 649 of them (95.9%) were located at mtDNA sites (n = 447) where all members from a family had>40X sequencing depth and thus were used
for comparing incidence and studying transmission pattern of heteroplasmies (S1 Dataset). We further defined the major allele in a family, the allele with the highest fraction in the mother-proband-sibling trio, as the reference allele for each site on the consensus sequence, and considered a heteroplasmy inherited if the reference allele and the derived allele in the child were detected in the mother with fraction2%. Otherwise we considered itde novoin the child.
Annotation of mtDNA variants
2.4) [79], and MutPred scores were retrieved from a previous study [43]. All of them generated pathogenicity scores comparable to CADD scores (S15 Fig). A list of disease-associated, nonsy-nonymous and RNA mutations was compiled according to the MITOMAP website [80] and the ClinVar database [81] (last accessed Jan. 2016). Mutations with ambiguous annotations such as “unclear”, “conflicting reports” or “further studies needed”, or listed as “synergistic” or “secondary” on the MITOMAP website were not included. Both position and mutant allele information were used for defining mutations. In addition, we constructed a list of mutations which were predicted pathogenic by at least two of the five pathogenicity predictors: (1) CADD Phred score>15; (2) PolyPhen-2 possible and probable damaging; (3) Mutation Assessor
medium and high impact; (4) MutPred score>0.6; (5) associated with disease. We relied on
this list of mutations to replicate results from analyses using only CADD scores. Related results were denoted as “combined prediction” inS4 Fig,S5 FigandS9 Fig.
mtDNA haplogroups
The mtDNA haplogroup information was assessed by using HaploGrep2 [82]. The resulting distribution of macro-haplogroups among the 903 families was representative of that among the U.S. population [83] (S7 Table). The concordance rate between the mtDNA-inferred ances-tral lineage and self-reported maternal ethnicity or race was>96.8% in non-admixed
popula-tions including non-Hispanic white (n = 654) and Asian (n = 49) (S7 Table), in close agreement with the concordance rate recently reported for the NHANES study [83] and among 588 mtDNA-sequenced individuals [84].
Statistical testing
Incidence of mtDNA mutations between probands and siblings was compared at a family level by using paired t-test. Differences in transmission pattern in mother-autistic proband pairs and mother-sibling pairs were assessed by using Fisher’s exact test. Other statistical methods, such as correlation test, ANOVA, linear regression and logistic regression, were also used as indicated in the text. Statistical testing in this study was carried out by using R (version 3.2.2) and python (version 2.7.5)/scipy (version 0.16.1).
Supporting Information
S1 Dataset. Heteroplasmies detected in mother-proband-sibling trios. (XLSX)
S2 Dataset. Incidence of homoplasmies. (XLSX)
S1 Table. Contribution of private mtDNA mutations to ASD in families stratified accord-ing to both IQ and SRS scores.
(XLSX)
S2 Table. Transmission pattern of mtDNA heteroplasmies in families stratified by proband sex and sibling sex.
(XLSX)
S3 Table. Neurological and developmental defects in autistic children carrying pathogenic and/or disease-associatedprivate mtDNA mutations.
S4 Table. Comparison of methods for calling heteroplasmies with other studies. (XLSX)
S5 Table. Valid mtDNA sites for calling heteroplasmies. (XLSX)
S6 Table. Transition-to-transversion (Ti/Tv) ratio among candidate heteroplasmies. (XLSX)
S7 Table. Distribution of mtDNA macro-haplogroups among the 903 families. (XLSX)
S1 Text. Possible confounding factors in heteroplasmy calling and heteroplasmy compari-sons between probands and siblings.
(DOCX)
S1 Fig. Average mtDNA coverage.(A) Average depth of sequencing coverage on mtDNA and (B) percentage of mtDNA sites sequenced to>20X depth per sample for reads generated by
CSHL (3,732 samples), YALE (2,396 samples) and UW (1,492 samples). (TIFF)
S2 Fig. Incidence of mtDNA homoplasmies and heteroplasmies.(A) Incidence of mtDNA homoplasmies. MAF: minor allele frequency of homoplasmies. Site-specific incidence of homoplasmies was given inS2 Dataset. (B, C) Incidence of mtDNA heteroplasmies with minor allele fraction5% and confidence score>5.
(TIFF)
S3 Fig. Relative mutation rates of mtDNA variants.The box plot of relative mutation rates for heteroplasmies at non-polymorphic sites, heteroplasmies at polymorphic sites and homoplasmies at non-heteroplasmic sites. The relative mutation rate for each nucleotide substitution on mtDNA was previously estimated by counting the number of times each nucleotide mutated independently in the phylogenetic tree representing the global human mtDNA variation [44]. The relative mutation rates for all observed substitutions as well as observed nonsynonymous substitutions were shown. Outliers were not depicted for clarity. Each nucleotide substitution was only counted at most once.P<7x10-23;P<6x10⁻³;P: p values for Mann-Whitney test.
(TIFF)
S4 Fig. Comparison of pathogenic mutation burden between autistic probands and non-autistic siblings.Mutation burden was calculated using mutations with DAF5% at mtDNA sites where all members in a family had>40X sequencing depth. Error bars represent the
stan-dard error of the mean. NS: nonsynonymous mutations; CADD: mutations with CADD Phred score>15 or>20; PolyPhen-2: possible and probable damaging mutations predicted by
Poly-Phen-2; Mutation Assessor: medium and high impact mutations predicted by Mutation Asses-sor; MutPred: mutations with MutPred score>0.6; disease-associated: nonsynonymous or
RNA mutations associated with disease according to the MITOMAP website and the ClinVar database; combined prediction: mutations predicted pathogenic in at least two of the five afore-mentioned pathogenicity categories (detailed in Materials and Methods).P: p values for one-tailed paired t-test.
(TIFF)
pathogenic with CADD Phred score>15 or>20, and in (D) for mutations predicted
patho-genic in at least two of the five pathopatho-genicity categories (detailed in Materials and Methods). The black circles in each figure refer to the observed ratios of mtDNA mutations between autis-tic probands and non-autisautis-tic siblings under varying thresholds of minimum DAF (from 2% to 8%) for defining mutations. The pink area represents 90% confidence interval of the same ratio estimated based on 10,000 bootstrap samples of the 903 families.
(TIFF)
S6 Fig. Association between private mtDNA mutations and IQ.Associations of IQ with pro-band-private mtDNA mutations were computed in 638 probands of the major ethnic group among the 903 families who had a reported family ancestry of “white” or “more-than-one-race” and an mtDNA-haplogroup inferred maternal ancestry of “Europe”. Boxplots of IQ were depicted according to proband-private (A) mutations at non-polymorphic sites, (B) mutations at polymorphic sites, (C) nonsynonymous mutations, (D,E) mutations predicted pathogenic based on CADD Phred score>15 or>20, and (F) disease-associated mutations. The dashed red lines
indicate a IQ of 70. Coefficients (Beta,β) and significance levels (P) of the associations between proband-private mtDNA mutations and IQ were given in the Table below the boxplots based on results from linear regression Model 1 (adjusting for age and sex) and Model 2 (adjusting for age, sex, SRS scores and whether carryingde novoLGD SNPs or CNVs on nuclear DNA).
(TIFF)
S7 Fig. Proportion of inherited heteroplasmies in children.The proportion of heteroplas-mies could be detected in the mother with DAF2%.
(TIFF)
S8 Fig. Changes of derived allele fractions of mtDNA mutations in mother-sibling pairs and mother-proband pairs.Changes of derived allele fractions (ΔDAF = DAFchild−DAFmother)
of mtDNA mutations were depicted in A, C, E, and G for mother-sibling pairs (blue), and in B, D, F, and H for mother-proband pairs (red). Only mtDNA sites (n = 448) detected with high-confidence heteroplasmies (MAF5%) orde novohomoplasmies were used for calculation. The total number of mutations used for plotting was indicated in parentheses under each fig-ure. CADD: mutations with CADD Phred score>15 or>20.
(TIFF)
S9 Fig. Differential ratio of pathogenic mtDNA mutations computed after down sampling reads in each family.The ratio of mtDNA mutations between probands and siblings is shown in (A) for nonsynonymous mutations, in (B,C) for mutations predicted pathogenic with CADD Phred score>15 or>20, and in (D) for mutations predicted pathogenic in at least two
of the five pathogenicity categories (detailed in Materials and Methods). The open circles and lines in each figure indicate the ratios of mtDNA mutations between autistic probands and non-autistic siblings computed using total reads under varying thresholds of minimum DAF (from 2% to 8%) for defining mutations. The filled circles, squares, and triangles refer to the same ratios of mtDNA mutations between autistic probands and non-autistic siblings com-puted from three independent down-sampling procedures to harmonize mtDNA sequencing coverage in the mother-proband-sibling trio of each family. The statistical significance that the ratio is greater than one (Pfor one-tailed paired t-test) is shown using different colors indicated in the legend on the right side.
(TIFF)
S11 Fig. Power calculation for heteroplasmy calling.Results were obtained from one-tailed power calculation for one sample proportion test of discriminating real heteroplasmies from sequencing errors under the assumption of base quality error1% (~0.33% for each possible substitution). Each curve refers to the power for detecting heteroplasmies with increasing MAF using the sequencing depth indicated in the legend.
(TIFF)
S12 Fig. Genomic distribution of mtDNA heteroplasmies.The 677 high-confidence, median-to-high fraction heteroplasmies (MAF5%) were depicted with their positions on the mitochondrial genome indicated on the X axis, and their minor allele fractions indicated on the Y axis on the right hand side. Heteroplasmies detected in mothers, siblings, and probands were depicted using squares, triangles and diamonds, respectively. Heteroplasmies in grey are transitions and heteroplasmies in red are transversions. The black curve represents the median sequencing coverage for each mtDNA site as indicated on the Y-axis on the left hand side. Both of Y axes are on logarithmic scales. Fluctuation of sequencing coverage is due to complex-ity of the mitochondrial genome and its sequence similarcomplex-ity with baits designed for whole exome sequencing [40]. The middle panel displays the exact positions (black) of the 13,704 mtDNA sites valid for calling heteroplasmies. The lower panel displays the D-loop region (grey), the 24 RNA genes (blue), and the 13 protein-coding genes (red) on the mitochondrial genome.
(TIFF)
S13 Fig. Distribution of confidence scores among candidate heteroplasmies.The 12,180 candidate heteroplasmies were detected from 13,704 mtDNA sites valid for calling heteroplas-mies. The cumulative distributions of LLR scores for heteroplasmies were shown in the above figures stratified by the minor allele fraction.
(TIFF)
S14 Fig. Correlations of site coverage at homoplasmic and heteroplasmic sites between individuals within each family.The regression lines were depicted in red.
(TIFF)
S15 Fig. Comparisons between CADD predictions and other pathogenicity predictions on mtDNA mutations.For all predictors, the higher the pathogenicity score of a nucleotide sub-stitution, the greater the chance it is pathogenic.P<2x10-100.
(TIFF)
Acknowledgments
We thank Yiping Wang, Ruoyu Zhang and Dr. Kaixiong Ye for their discussions for this proj-ect, and Drs. Lars Steinmetz and Haiyuan Yu for their comments on the manuscript. We are very grateful to the three reviewers and the editor for their constructive comments. We also appreciate being able to obtain access to the exome sequencing data from the National Data-base for Autism Research (NDAR) and to the phenotypic data from the Simons Foundation Autism Research Initiative (SFARI) database.
Author Contributions
Conceptualization:YW ZG.
Data curation:YW MP ZG.
Funding acquisition:ZG.
Investigation:YW MP ZG.
Methodology:YW ZG.
Project administration:ZG.
Resources:YW MP ZG.
Software:YW ZG.
Supervision:ZG.
Validation:YW MP ZG.
Visualization:YW MP ZG.
Writing – original draft:YW MP ZG.
Writing – review & editing:YW MP ZG.
References
1. Jeste SS, Geschwind DH. Disentangling the heterogeneity of autism spectrum disorder through genetic findings. Nat Rev Neurol. Nature Publishing Group; 2014; 10: 74–81. doi:10.1038/nrneurol. 2013.278PMID:24468882
2. Landa RJ. Diagnosis of autism spectrum disorders in the first 3 years of life. Nat Clin Pract Neurol. 2008; 4: 138–47. doi:10.1038/ncpneuro0731PMID:18253102
3. Christensen DL, Baio J, Braun KVN, Bilder D, Charles J, Constantino JN, et al. Prevalence and charac-teristics of Autism Spectrum Disorder among children aged 8 years—Autism and Developmental Dis-abilities Monitoring Network, 11 Sites, United States, 2012. MMWR Surveill Summ. 2016; 65: 1–23.
4. Zablotsky B, Black LI, Maenner MJ, Schieve LA, Blumberg SJ. Estimated prevalence of Autism and other developmental disabilities following questionnaire changes in the 2014 National Health Interview Survey. Natl Health Stat Report. 2015; 1–20.
5. Olsson MB, Westerlund J, Lundstro¨m S, Giacobini M, Fernell E, Gillberg C. “Recovery” from the diag-nosis of autism—and then? Neuropsychiatr Dis Treat. 2015; 11: 999–1005. doi:10.2147/NDT.S78707
PMID:25897237
6. Masi A, Quintana DS, Glozier N, Lloyd AR, Hickie IB, Guastella AJ. Cytokine aberrations in autism spectrum disorder: a systematic review and meta-analysis. Mol Psychiatry. 2015; 20: 440–6. doi:10. 1038/mp.2014.59PMID:24934179
7. Napoli E, Wong S, Hertz-Picciotto I, Giulivi C. Deficits in bioenergetics and impaired immune response in granulocytes from children with autism. Pediatrics. 2014; 133: e1405–10. doi: 10.1542/peds.2013-1545PMID:24753527
8. James SJ, Cutler P, Melnyk S, Jernigan S, Janak L, Gaylor DW, et al. Metabolic biomarkers of increased oxidative stress and impaired methylation capacity in children with autism. Am J Clin Nutr. 2004; 80: 1611–7. PMID:15585776
9. Weissman JR, Kelley RI, Bauman ML, Cohen BH, Murray KF, Mitchell RL, et al. Mitochondrial disease in autism spectrum disorder patients: A cohort analysis. PLoS One. 2008; 3: 1–6.
10. Giulivi C, Zhang Y-F, Omanska-Klusek A, Ross-Inta C, Wong S, Hertz-Picciotto I, et al. Mitochondrial dysfunction in autism. JAMA. 2010; 304: 2389–96. doi:10.1001/jama.2010.1706PMID:21119085 11. Chauhan A, Gu F, Essa MM, Wegiel J, Kaur K, Brown WT, et al. Brain region-specific deficit in
mito-chondrial electron transport chain complexes in children with autism. J Neurochem. 2011; 117: 209– 20. doi:10.1111/j.1471-4159.2011.07189.xPMID:21250997
12. Goh S, Dong Z, Zhang Y, DiMauro S, Peterson BS. Mitochondrial dysfunction as a neurobiological subtype of autism spectrum disorder: evidence from brain imaging. JAMA psychiatry. 2014; 71: 665– 71. doi:10.1001/jamapsychiatry.2014.179PMID:24718932
14. Rossignol DA, Frye RE. Mitochondrial dysfunction in autism spectrum disorders: a systematic review and meta-analysis. Mol Psychiatry. Nature Publishing Group; 2011; 17: 290–314. doi:10.1038/mp. 2010.136PMID:21263444
15. Lightowlers RN, Taylor RW, Turnbull DM. Mutations causing mitochondrial disease: What is new and what challenges remain? Science. 2015; 349: 1494–9. doi:10.1126/science.aac7516PMID:
26404827
16. Skladal D, Halliday J, Thorburn DR. Minimum birth prevalence of mitochondrial respiratory chain disor-ders in children. Brain. 2003; 126: 1905–12. doi:10.1093/brain/awg170PMID:12805096
17. Gorman GS, Schaefer AM, Ng Y, Gomez N, Blakely EL, Alston CL, et al. Prevalence of nuclear and mitochondrial DNA mutations related to adult mitochondrial disease. Ann Neurol. 2015; 77: 753–9. doi:
10.1002/ana.24362PMID:25652200
18. Parikshak NN, Gandal MJ, Geschwind DH. Systems biology and gene networks in neurodevelopmen-tal and neurodegenerative disorders. Nat Rev Genet. Nature Publishing Group; 2015; 16: 441–458. doi:10.1038/nrg3934PMID:26149713
19. Legido A, Jethva R, Goldenthal MJ. Mitochondrial dysfunction in Autism. Semin Pediatr Neurol. Else-vier; 2013; 20: 163–175. doi:10.1016/j.spen.2013.10.008PMID:24331358
20. Glessner JT, Wang K, Cai G, Korvatska O, Kim CE, Wood S, et al. Autism genome-wide copy number variation reveals ubiquitin and neuronal genes. Nature. 2009; 459: 569–73. doi:10.1038/nature07953
PMID:19404257
21. Ramoz N, Reichert JG, Smith CJ, Silverman JM, Bespalova IN, Davis KL, et al. Linkage and associa-tion of the mitochondrial aspartate/glutamate carrier SLC25A12 gene with autism. Am J Psychiatry. 2004; 161: 662–9. doi:10.1176/appi.ajp.161.4.662PMID:15056512
22. De Rubeis S, He X, Goldberg AP, Poultney CS, Samocha K, Ercument Cicek A, et al. Synaptic, tran-scriptional and chromatin genes disrupted in autism. Nature. Nature Publishing Group; 2014; 515: 209–215. doi:10.1038/nature13772PMID:25363760
23. Iossifov I, Roak BJO, Sanders SJ, Ronemus M, Krumm N, Levy D, et al. The contribution of de novo coding mutations to autism spectrum disorder. Nature. Nature Publishing Group; 2014; 515: 216–221. doi:10.1038/nature13908PMID:25363768
24. Krumm N, Turner TN, Baker C, Vives L, Mohajeri K, Witherspoon K, et al. Excess of rare, inherited truncating mutations in autism. Nat Genet. Nature Publishing Group; 2015; 47: 582–588. doi:10.1038/ ng.3303PMID:25961944
25. Sanders SJ, He X, Willsey AJ, Ercan-Sencicek AG, Samocha KE, Cicek AE, et al. Insights into Autism Spectrum Disorder genomic architecture and biology from 71 risk loci. Neuron. Elsevier Inc.; 2015; 87: 1215–1233. doi:10.1016/j.neuron.2015.09.016PMID:26402605
26. Napoli E, Wong S, Giulivi C. Evidence of reactive oxygen species-mediated damage to mitochondrial DNA in children with typical autism. Mol Autism. 2013; 4: 2. doi:10.1186/2040-2392-4-2PMID:
23347615
27. Pons R, Andreu AL, Checcarelli N, VilàMR, Engelstad K, Sue CM, et al. Mitochondrial DNA abnormali-ties and autistic spectrum disorders. J Pediatr. 2004; 144: 81–5. doi:10.1016/j.jpeds.2003.10.023
PMID:14722523
28. Chen S, Li Z, He Y, Zhang F, Li H, Liao Y, et al. Elevated mitochondrial DNA copy number in peripheral blood cells is associated with childhood autism. BMC Psychiatry. 2015; 15: 50. doi: 10.1186/s12888-015-0432-yPMID:25884388
29. Yu-Wai-Man P, Lai-Cheong J, Borthwick GM, He L, Taylor GA, Greaves LC, et al. Somatic mitochon-drial DNA deletions accumulate to high levels in aging human extraocular muscles. Invest Ophthalmol Vis Sci. 2010; 51: 3347–53. doi:10.1167/iovs.09-4660PMID:20164450
30. Hadjixenofontos A, Schmidt M a, Whitehead PL, Konidari I, Hedges DJ, Wright HH, et al. Evaluating mitochondrial DNA variation in autism spectrum disorders. Ann Hum Genet. 2013; 77: 9–21. doi:10. 1111/j.1469-1809.2012.00736.xPMID:23130936
31. Wallace DC, Chalkia D. Mitochondrial DNA genetics and the heteroplasmy conundrum in evolution and disease. Cold Spring Harb Perspect Biol. 2013; 5: 1–47.
32. Stewart JB, Chinnery PF. The dynamics of mitochondrial DNA heteroplasmy: implications for human health and disease. Nat Rev Genet. 2015; 16: 530–42. doi:10.1038/nrg3966PMID:26281784 33. Li M, Scho¨nberg A, Schaefer M, Schroeder R, Nasidze I, Stoneking M. Detecting heteroplasmy from
high-throughput sequencing of complete human mitochondrial DNA genomes. Am J Hum Genet. 2010; 87: 237–49. doi:10.1016/j.ajhg.2010.07.014PMID:20696290
35. Goto H, Dickins B, Afgan E, Paul IM, Taylor J, Makova KD, et al. Dynamics of mitochondrial hetero-plasmy in three families investigated via a repeatable re-sequencing study. Genome Biol. 2011; 12: R59. doi:10.1186/gb-2011-12-6-r59PMID:21699709
36. Rebolledo-Jaramillo B, Su MS-W, Stoler N, McElhoe J a., Dickins B, Blankenberg D, et al. Maternal age effect and severe germ-line bottleneck in the inheritance of human mitochondrial DNA. Proc Natl Acad Sci. 2014; 111: 15474–15479. doi:10.1073/pnas.1409328111PMID:25313049
37. Ye K, Lu J, Ma F, Keinan A, Gu Z. Extensive pathogenicity of mitochondrial heteroplasmy in healthy human individuals. Proc Natl Acad Sci U S A. 2014; 111: 10654–9. doi:10.1073/pnas.1403521111
PMID:25002485
38. Ding J, Sidore C, Butler TJ, Wing MK, Qian Y, Meirelles O, et al. Assessing mitochondrial DNA varia-tion and copy number in lymphocytes of ~2,000 Sardinians using tailored sequencing analysis tools. PLoS Genet. 2015; 11: 1–18.
39. Diroma MA, Calabrese C, Simone D, Santorsola M, Calabrese FM, Gasparre G, et al. Extraction and annotation of human mitochondrial genomes from 1000 Genomes Whole Exome Sequencing data. BMC Genomics. BioMed Central Ltd; 2014; 15 Suppl 3: S2. doi:10.1186/1471-2164-15-S3-S2PMID:
25077682
40. Picardi E, Pesole G. Mitochondrial genomes gleaned from human whole-exome sequencing. Nat Methods. Nature Publishing Group; 2012; 9: 523–524. doi:10.1038/nmeth.2029PMID:22669646 41. Abecasis GR, Auton A, Brooks LD, DePristo M a, Durbin RM, Handsaker RE, et al. An integrated map
of genetic variation from 1,092 human genomes. Nature. 2012; 491: 56–65. doi:10.1038/nature11632
PMID:23128226
42. Rossignol R, Faustin B, Rocher C, Malgat M, Mazat J-P, Letellier T. Mitochondrial threshold effects. Biochem J. 2003; 370: 751–62. doi:10.1042/BJ20021594PMID:12467494
43. Pereira L, Soares P, Radivojac P, Li B, Samuels DC. Comparing phylogeny and the predicted pathoge-nicity of protein variations reveals equal purifying selection across the global human mtDNA diversity. Am J Hum Genet. 2011; 88: 433–439. doi:10.1016/j.ajhg.2011.03.006PMID:21457906
44. Soares P, Ermini L, Thomson N, Mormina M, Rito T, Ro¨hl A, et al. Correcting for purifying selection: an improved human mitochondrial molecular clock. Am J Hum Genet. 2009; 84: 740–759. doi:10.1016/j. ajhg.2009.05.001PMID:19500773
45. Guevara-Campos J, Gonza´lez-Guevara L, Cauli O. Autism and intellectual disability associated with mitochondrial disease and hyperlactacidemia. Int J Mol Sci. 2015; 16: 3870–84. doi:10.3390/ ijms16023870PMID:25679448
46. Giles RE, Blanc H, Cann HM, Wallace DC. Maternal inheritance of human mitochondrial DNA. Proc Natl Acad Sci U S A. 1980; 77: 6715–9. PMID:6256757
47. Mishra P, Chan DC. Mitochondrial dynamics and inheritance during cell division, development and dis-ease. Nat Rev Mol Cell Biol. Nature Publishing Group; 2014; 15: 634–46. doi:10.1038/nrm3877PMID:
25237825
48. Hill JH, Chen Z, Xu H. Selective propagation of functional mitochondrial DNA during oogenesis restricts the transmission of a deleterious mitochondrial variant. Nat Genet. Nature Publishing Group; 2014; 46: 389–92. doi:10.1038/ng.2920PMID:24614072
49. Chinnery PF, Thorburn DR, Samuels DC, White SL, Dahl HM, Turnbull DM, et al. The inheritance of mitochondrial DNA heteroplasmy: random drift, selection or both? Trends Genet. 2000; 16: 500–5. PMID:11074292
50. Just RS, Irwin JA, Parson W. Mitochondrial DNA heteroplasmy in the emerging field of massively par-allel sequencing. Forensic Sci Int Genet. Elsevier Ireland Ltd; 2015; 18: 131–139. doi:10.1016/j. fsigen.2015.05.003PMID:26009256
51. Kennedy SR, Salk JJ, Schmitt MW, Loeb LA. Ultra-sensitive sequencing reveals an age-related increase in somatic mitochondrial mutations that are inconsistent with oxidative damage. PLoS Genet. 2013; 9: e1003794. doi:10.1371/journal.pgen.1003794PMID:24086148
52. Picard M, Zhang J, Hancock S, Derbeneva O, Golhar R, Golik P, et al. Progressive increase in mtDNA 3243A>G heteroplasmy causes abrupt transcriptional reprogramming. Proc Natl Acad Sci U S A. 2014; 111: E4033–42. doi:10.1073/pnas.1414028111PMID:25192935
53. Picard M, McManus MJ, Gray JD, Nasca C, Moffat C, Kopinski PK, et al. Mitochondrial functions mod-ulate neuroendocrine, metabolic, inflammatory, and transcriptional responses to acute psychological stress. Proc Natl Acad Sci. 2015; 112: E6614–6623. doi:10.1073/pnas.1515733112PMID:26627253 54. Pyle A, Hudson G, Wilson IJ, Coxhead J, Smertenko T, Herbert M, et al. Extreme-depth re-sequencing