Bottleneck in Salmon Suggests a Conserved Mechanism
in Vertebrates
Jonci N. Wolff1,2, Daniel J. White1,3, Michael Woodhams4, Helen E. White5, Neil J. Gemmell1,3*
1School of Biological Sciences, University of Canterbury, Christchurch, Canterbury, New Zealand,2School of Biotechnology and Biomolecular Sciences, University of New South Wales, Sydney, New South Wales, Australia,3Department of Anatomy and Structural Biology, Centre for Reproduction and Genomics, University of Otago, Dunedin, Otago, New Zealand,4School of Information Technology, University of Sydney, Sydney, New South Wales, Australia,5National Genetics Reference Laboratory (Wessex), Salisbury District Hospital, Salisbury, Wiltshire, United Kingdom
Abstract
In most species mitochondrial DNA (mtDNA) is inherited maternally in an apparently clonal fashion, although how this is achieved remains uncertain. Population genetic studies show not only that individuals can harbor more than one type of mtDNA (heteroplasmy) but that heteroplasmy is common and widespread across a diversity of taxa. Females harboring a mixture of mtDNAs may transmit varying proportions of each mtDNA type (haplotype) to their offspring. However, mtDNA variants are also observed to segregate rapidly between generations despite the high mtDNA copy number in the oocyte, which suggests a genetic bottleneck acts during mtDNA transmission. Understanding the size and timing of this bottleneck is important for interpreting population genetic relationships and for predicting the inheritance of mtDNA based disease, but despite its importance the underlying mechanisms remain unclear. Empirical studies, restricted to mice, have shown that the mtDNA bottleneck could act either at embryogenesis, oogenesis or both. To investigate whether the size and timing of the mitochondrial bottleneck is conserved between distant vertebrates, we measured the genetic variance in mtDNA heteroplasmy at three developmental stages (female, ova and fry) in chinook salmon and applied a new mathematical model to estimate the number of segregating units (Ne) of the mitochondrial bottleneck between each stage.
Using these data we estimate values for mtDNA Ne of 88.3 for oogenesis, and 80.3 for embryogenesis. Our results confirm the presence of a mitochondrial bottleneck in fish, and show that segregation of mtDNA variation is effectively complete by the end of oogenesis. Considering the extensive differences in reproductive physiology between fish and mammals, our results suggest the mechanism underlying the mtDNA bottleneck is conserved in these distant vertebrates both in terms of it magnitude and timing. This finding may lead to improvements in our understanding of mitochondrial disorders and population interpretations using mtDNA data.
Citation:Wolff JN, White DJ, Woodhams M, White HE, Gemmell NJ (2011) The Strength and Timing of the Mitochondrial Bottleneck in Salmon Suggests a Conserved Mechanism in Vertebrates. PLoS ONE 6(5): e20522. doi:10.1371/journal.pone.0020522
Editor:M. Thomas P. Gilbert, Natural History Museum of Denmark, Denmark
ReceivedJanuary 18, 2011;AcceptedMay 4, 2011;PublishedMay 31, 2011
Copyright:ß2011 Wolff et al. This is an open-access article distributed under the terms of the Creative Commons Attribution License, which permits unrestricted use, distribution, and reproduction in any medium, provided the original author and source are credited.
Funding:This study was funded by a grant to NJG from the Royal Society of New Zealand, Marsden Fund, Grant UOC402. The funders had no role in study design, data collection and analysis, decision to publish, or preparation of the manuscript.
Competing Interests:The authors have declared that no competing interests exist.
* E-mail: [email protected]
Introduction
Mitochondrial DNA (mtDNA) is the linchpin of modern population and evolutionary genetics. It is widely used to examine the evolutionary history of numerous species and has been employed to determine, for example, the origins and the global expansion of modern humans. The power of mtDNA analyses derives from the apparent simplicity of mitochondrial inheritance (maternal, clonal and without recombination), which has enabled models of population history to be much simpler than those needed for the analysis of nuclear DNA. However, a large body of evidence from population genetic studies, shows not only that individuals can harbor more than one type of mtDNA (hetero-plasmy), but that it is apparently widespread in humans [1] and other eukaryotes [2].
While the extent of mtDNA heteroplasmy poses problems for data interpretation in population genetics and forensics [2]; clarifying how mtDNA heteroplasmy is maintained and inherited
is particularly important for the growing list of human diseases with severities that depend upon the ratio of wild-type to aberrant mitochondria [1,4,5]. The number of mtDNA genomes that pass from one generation to the next is also important for assessing the rate with which mtDNA recombination may spawn new haplotypes [2,3].
This bottleneck has risen to recent prominence [1] due to its importance in understanding the intergenerational transmission of mitochondrial DNA mutations, which impacts upon our ability to predict the inheritance of mitochondrial disease states and make evolutionary interpretations using mitochondrial DNA data. While the size (number of segregating mtDNA molecules) of this bottleneck has been estimated for a few species [2], data to determine at what developmental stage, oogenesis or embryogen-esis, such a bottleneck may occur has thus far been restricted to a few studies on mice [8,19,20,21]. These studies have reported highly diverging results, leaving the issue of the developmental timing of the bottleneck equivocal and contentious in this species [1,2,22,23].
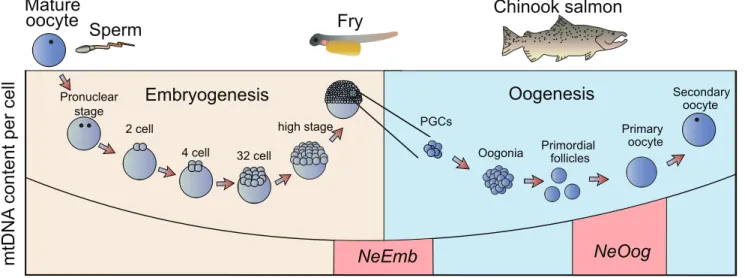
Evidence from mouse suggests that a mtDNA bottleneck acts during the early stages of embryonic development [8,20,24,25]. The hypothesized role of this bottleneck is to remove mitochon-drial mutations and avert ‘mutational meltdown’ in the genome of this crucial organelle [2,24,26,27,28]. However, whether this bottleneck occurs during oogenesis (i.e.during the development of mature oocytes from primordial germ cells, Fig. 1), embryogenesis (i.e.in the cleaving embryo from the zygote to the establishment of the germ layers including the primordial germ cells, Fig. 1), or both remains uncertain [8,19,20,21,25,29].
Several studies have aimed to examine the intergenerational transmission of heteroplasmy levels between heteroplasmic mother/offspring pairs, to estimate the effective number (Ne) of
mtDNA transmitted from mother to offspring [7,12,19,20,21, 25,30,31,32,33,34]. These studies have either used a direct approach by measuring the mtDNA content of single cells [19,20,21,25], but more frequently have monitored differences in haplotype frequencies between mother and offspring [7,12,20,30,31,32,34,35,36]. However, to date, only two studies (both in mouse) have aimed to monitor changes in heteroplasmy levels during different developmental stages of embryogenesis and oogenesis [8,21], and both studies excluded unequal partitioning of mtDNA during embryogenesis from contributing significantly to the observed bottleneck effects. These results are, however, contradicted by another recent mouse study that employed a direct approach [20]. Thus, the timing and strength of the
bottleneck remains uncertain [discussed in 2,20,21,22,23,24,37]. Further, there is currently no empirical data on when this bottleneck might occur for anything other than mouse and further work on evolutionary divergent taxa is needed.
A detailed knowledge of the mitochondrial bottleneck, partic-ularly its magnitude, timing and putative mode of action, and the evolutionary conservation of the above, has important implications for the understanding of the transmission and intergenerational stability of mitochondrial heteroplasmy [2], which impacts in areas spanning the aetiology of mitochondrial disorders [26], including some cancers [38], through to the use of mtDNA data for population and evolutionary interpretations [2].
In this study, we follow the intergenerational transmission of mtDNA in naturally occurring heteroplasmic individuals of New Zealand chinook salmon (Oncorhynchus tshawytscha). Using this system we have measured (i) the change in heteroplasmy levels from mother to oocytes, in order to estimate the effective number of segregating units at oogenesis, (NeOog, Fig. 1), and (ii) the change
in heteroplasmy levels from mother to offspring, in order to estimate the effective number of segregating units at embryogen-esis, (NeEmb, Fig. 1). Collectively, these approaches enable us to
examine the magnitude and developmental stages during which an mtDNA bottleneck is felt in a non-mammalian system, and may help us determine to what extent the mechanism underlying the bottleneck might be conserved across taxa.
Materials and Methods
Markers
Two heteroplasmic sites were investigated in this work, previously discovered in a hatchery population of New Zealand chinook salmon at the Silverstream hatchery, Canterbury, NZ. Both sites confer synonymous changes and are located in the mitochondrial genemt-nd1, at nucleotide positions 4149 and 4316 (NCBI:NC_002980) [39]. An A/G polymorphism (A = wildtype) was found at position 4149 (A4149G), and a C/T polymorphism (T = wildtype) at position 4316 (T4316C). The A/G polymor-phism at this position lies at the edge of a poly-G tract, which is likely to be unstable promoting the conversion of the A to a G and
Figure 1. Schematic illustration of two developmental genetic bottlenecks proposed to impact on mitochondrial inheritance.A
thus a high mutation rate. Heteroplasmic sites were detected by Sanger sequencing, and authenticated by cloning experiments to resolve both haplotypes.
Samples and DNA extractions
Heteroplasmy levels in the somatic tissue (fin clips) of five female fish, and multiple oocytes (N = 13 to 28) and offspring (1–2 mm of tail tissue, N = 20) of each female were examined. Two females were heteroplasmic for nucleotide position 4316 (families 272, 357), and three were heteroplasmic for position 4149 (individual 214, 256, 263). Heteroplasmic offspring were generated by crossing homoplasmic males and heteroplasmic females using the dry method [40]. Fertilized eggs were incubated and embryos reared until hatching, following standard husbandry procedures [40,41]. Both embryos and eggs were harvested and stored in 80% EtOH at 220uC until analysis. DNA was extracted following standard protocols using 350ml lysis buffer (5% Chelex-100,
100 mM NaCl, 50 mM Tris [pH 8.0], 1% SDS, 10 mM EDTA, 100mg/ml RNase A, 100mg/ml Proteinase K) for somatic tissues
and 1500ml roe-specific lysis buffer for oocytes [42]. Sampling strategy
We harvested oocytes from five females and measured heteroplasmy levels within multiple oocytes from each female. The variance in heteroplasmy levels among oocytes in comparison to the heteroplasmy level in the somatic tissues of the female (the oocyte donor) allows for the modelling of the segregation of mtDNA variants (NeOog) from the beginning of oogenesis (assumed
to be equivalent to the heteroplasmy levels found in the soma and gonadal structures) to the end of oogenesis (heteroplasmy level of oocytes). A subset of oocytes from the same donor was reared until hatching and heteroplasmy levels determined in these offspring. The variance in heteroplasmy levels among these offspring in comparison to the heteroplasmy level in the somatic tissues of the female allow for the modelling of mtDNA segregation between generations and subsequently in embryogenesis (NeEmb, in
comparison toNeOog). Additionally, five further tissues (gills, heart,
muscle, liver and gonads) were sampled from two founder females (214, 263) to investigate whether heteroplasmy levels are constant within different tissues taken from the same individual.
Pyrosequencing
Haplotype frequencies were determined using quantitative pyrosequencing, undertaken at the National Genetics Reference Laboratory (Wessex, UK) at the Salisbury District Hospital. PCR products were generated in a 50ml reaction volume with 15 pmol
of forward and reverse PCR primers (for sequence details see supporting information), 0.2 mM dNTPs (Promega, Madison, USA), 1.5 mM MgCl2, 16Buffer II (Applied Biosystems), 1 U
AmpliTaq Gold (Applied Biosystems, Foster City, USA) using approximately 10 ng genomic DNA. PCR conditions for all reactions were 94uC for 7 min; 40 cycles with denaturation at 94uC for 30 sec, annealing at 57uC for 30 sec and elongation at 72uC for 30 sec; 1 cycle at 72uC for 7 min; and a final hold at 15uC.
Single-stranded biotinylated PCR products were prepared for sequencing using the PyrosequencingTM Vacuum Prep Tool (Qiagen, Hilden, Germany). Three microliter of Streptavidin SepharoseTMHP (Amersham, Little Chalfont, UK) was added to 37ml Binding buffer (10 mM Tris-HCl pH 7.6, 2 M NaCl, 1 mM
EDTA, 0.1% Tween 20) and mixed with 20ml PCR product and
20ml high purity water for 10 min at room temperature using a
thermal shaker. The beads containing the immobilized templates were captured onto the filter probes after applying the vacuum,
and then washed with 70% ethanol for 5 sec, denaturation solution (0.2 M NaOH) for 5 sec and washing buffer (10 mM Tris-Acetate pH 7.6) for 5 sec. The vacuum was then released and the beads released into a PSQ 96 Plate Low, containing 45ml
annealing buffer (20 mM Tris-Acetate, 2 mM MgAc2pH 7.6) and
0.3mM sequencing primer (Table S1). Samples were heated to 80uC for 2 min and allowed to cool to room temperature.
Pyrosequencing reactions were performed on a PSQTM96MA System according to the manufacturer’s instructions, using the PSQ 96 SNP Reagent Kit and analysed using the in-built Allele Frequency Quantification (AQ) function in the SNP Software. For nucleotide dispensation, see supporting information. To determine the measurement error of this method, all females and a randomly chosen subset of oocytes and offspring were subject to repeat measurements. Repeat measurements were carried out on the same DNA extraction.
Overview of Inheritance Model
In this analysis, we assume there are at most two mitochondrial alleles present in any individual and label them ‘A’ and ‘B’ arbitrarily. Then the heteroplasmy ratiohof an individual is the fraction of its genomes belonging to allele A. When comparing the heteroplasmy ratios of two individuals with the same two alleles, we use the same labeling for both of them.
Perhaps the simplest model of the inheritance of mitochondrial heteroplasmy is that each offspring samples a small numberNof mitochondrial genomes at random from its mother (single-sampling binominal model), defining the offspring’s heteroplasmy ratio by the proportions of both samples in this sample [43]. The probability of each sampled genome being allele A is the mother’s heteroplasmy ratioh. Ifh9 is the offspring’s heteroplasmy ratio, thenNh9has a binomial distribution, so the distribution ofh9has mean h, variance sh0~
h(1{h)
N , and for large enough N
(approximatelyN.30) is well approximated by a Gaussian. If the germline sequence of cells over a full generation had a single bottleneck cell withNmitochondrial genomes (all other cells having a much larger number), then our simple model would be close to reality. In reality the situation is likely more complex than this, and the population genetic model assumes the mitochondrial bottleneck is the effect of repeated sampling and partitioning of mitochondrial genomes during all successive binary cell divisions forming the female germ line [8]. In this case the variance inh9
will be the sum of variances from each bottleneck cell,
sh&
h(1{h)
N1 z h(1{h)
N2 z:::z h(1{h)
Ne
(making the approxinma-tion thath(12h)does not vary greatly over cell generations) where
1 Ne
~ 1
N1z 1
N2z:::. IfNeis large enough, the distribution is still
well approximated by a Gaussian. Should h drift close to 0 or 1during this process, the distribution derived by Wonnapinij et al. [44] exceeds the performance of our simple Gaussian approxi-mation, but the sensitivity limitations of our measurements have the side effect of keeping our estimates well within the zone where the Gaussian approximation is valid.
We therefore model the inheritance of mitochondrial hetero-plasmy as follows: a mother with heterohetero-plasmy ratiohhas offspring with heteroplasmy ratios normally distributed with meanh and varianceh(1{h)=Ne.Neis a property of the population (species)
-all mothers have the same value. Our model is only valid ifNeis
sufficiently large – the predicted probability ofh9lying outside the range 0 to 1 increases asNedecreases and ashtends to 0 or 1. Forh
Many biological mechanisms will result in such a distribution
-e.g., a bottleneck spread over several cell generations, selection of clusters of mitochondrial genomes, genome reproduction from a subpopulation of the genomes in a single cell [6] or the drift in heteroplasmy in a single cell with lifetime longer than the lifetime of the mitochondrial genomes it contains. Our model and analysis are blind to these details. The parameter which we measure –Ne–
is a lower bound on the true bottleneck genome number. Its relationship to the true bottleneck genome number will depend on the actual biological mechanisms at play. Our model does not account for the possibility of a bottleneck between the germline cells and the somatic cells sampled from the mother. We would require data from an additional generation of fish to be able to measure this effect. This model is developed in greater detail in Hendyet al.[45] and is applied to Ade´lie penguins in Milleret al.
[46]. For detailed analyses and calculations, see supporting information (Text S1, S2, S3).
Results
Two discrete heteroplasmic sites were investigated in this work. Both sites confer to synonymous changes and are located in mitochondrial genemt-nd1, at nucleotide positions 4149 and 4316 (NCBI:NC_002980). An A/G polymorphism (A = wildtype) was found at position 4149 (A4149G), and a C/T polymorphism (T = wildtype) at position 4316 (T4316C). Heteroplasmy levels in the somatic tissue (fin clips) of five female fish, and multiple oocytes (N = 13 to 28) and offspring (N = 20) of each female were examined. Two females were heteroplasmic for nucleotide position 4316 (families 272, 357), and three were heteroplasmic for position 4149 (individual 214, 256, 263). Heteroplasmic offspring were generated by crossing homoplasmic males with heteroplasmic females and the haplotype frequencies of the resulting offspring were determined using quantitative pyrosequencing [47].
Mean levels of heteroplasmy for each developmental stage, expressed as haplotype frequencies within an individual, are shown in Table 1 (see Table S2 for raw data). The variation about these means for the oocyte and offspring samples, and the experimental error, is used to estimateNevalues with our mathematical model.
In Table 2, the level of measurement error obtained with the pyrosequencing approach to allelic quantization is indicated by the mean standard errors, and was calculated formally using our model.
To determine whether fin clips are a good representation of heteroplasmy levels in all cell lines of mother fish, we measured heteroplasmy levels in various tissues of two female founder fish (Table 3). One-sample t-tests were performed, comparing hetero-plasmy levels from fin clips with those obtained from five other tissue types for two family lines, 214 and 263. Of the ten p-values obtained, two were less than the cut-off value of 0.05, with no obvious trend between tissue types. Some chance fluctuation in heteroplasmy levels between tissues is expected due to the random segregation of mtDNA, and may explain the two significant p-values. Since fin clip measurements were not significantly different between 4 out of 5 tissues in both family lines, we deemed our estimation of heteroplasmy in the mother fish a good approxima-tion of what existed in the primordial germ cells (Table 3).
The heteroplasmy levels observed in offspring are not significantly different from those observed in oocytes (p = 0.33). Consequently,Nefor offspring is of similar size to theNeestimated
for eggs, indicating no reduction in mitochondrial genome number between these two stages (Figure 2): Analyzing the data from the eggs with our model gives a posterior distribution onNewith mean
88.3, median 87.4, mode 85.6, 95% confidence interval 63.7 to 118.4. For the offspring data, the posterior distribution onNehas
mean 80.3, median 79.6, mode 78.2, 95% confidence interval 58.7 to 105.8. The posterior distributions on measurement errors are plotted in Figure 3. The mean (and 95% CIs) are 1.92% (1.59%–
Table 1.Summary of heteroplasmy levels for each family [% mutant allele].
Family 214 256 263 272 357
Heteroplasmy A4149G A4149G A4149G T4316C T4316C
Mother mean 63.3 32.4 67.7 20.3 28.1
n 13 13 13 12 10
C of V (%) 1.6 4.0 1.1 15.1 8.6
Oocyte mean 63.8 37.4 67.6 20.9 26.3
N 28 23 13 20 17
SD 5.1 4.3 4 4.4 5.3
C of V (%) 8.0 11.6 6.0 21.1 20.0
Offspring mean 65.0 36.2 69.9 19.8 31.6
N 20 20 20 20 20
SD 6.4 4.4 3.6 4.5 4.4
C of V (%) 9.8 12.1 5.2 22.8 13.9
Values represent percentage of the G or C allele, respectively. n: number of repeat measurements from one individual, N: number of individuals from which measurements taken, SD: standard deviation; C of V: coefficient of variance. doi:10.1371/journal.pone.0020522.t001
Table 2.Variation in heteroplasmy levels between measurements at each developmental stage of randomly chosen oocyte and offspring samples and of all females to determine the measurement error.
n N Mean SE
Mother 10 to 13 5 0.50
Oocyte 3 31 0.88
Offspring 3 18 0.58
n: number of repeat measurements per sample, N: total number of individuals from which repeat measurements were taken, mean SE: mean standard error across all individuals.
doi:10.1371/journal.pone.0020522.t002
Table 3.Triplicate measurements of heteroplasmy levels G4149A in various tissues of mothers 214 and 263 [% mutant allele].
214 263
Mean SE p Mean SE p
Gills 64.0 0.7 0.39 68.1 0.3 0.33
Gonads 65.6 0.4 0.03 69.7 0.6 0.08
Heart 63.9 0.3 0.21 69.2 0.7 0.15
Liver 63.9 0.5 0.33 69.7 0.2 0.01
Muscle 65.5 0.5 0.05 67.3 0.5 0.50
2.32%) for mothers, 1.67% (1.38%–2.03%) for eggs, and 1.18% (0.95%–1.49%) for offspring. Our lower Ne estimate of 80.3 is
approximately 4.06107-fold less than mtDNA copy number in mature salmon oocytes, estimated to harbor some 3.26109
mtDNA molecules [39].
Discussion
We draw two major conclusions from our work. Firstly, by observing changes in heteroplasmy levels from mothers to oocytes and offspring, we can confirm that a mitochondrial genetic bottleneck, or bottleneck effect, exists in chinook salmon during early developmental stages. Thus, salmon appear congruent with an array of other taxonomic groups [7,8,12,19,20,30,31,32, 34,35,36]. Secondly, the similarity between NeOog (88.3) and NeEmb(80.3), as found here, indicates that the main mitochondrial
genetic bottleneck occurs during oogenesis in salmon. Although we foundNeOogto be slightly higher thanNeEmb, this difference was
not significantly different. As estimates ofNeare directly correlated
to measurement error, the greater value ofNefor oogenesis may be
due to a larger measurement error for oocytes (1.67%), compared to that for F1 offspring (1.18%). Alternatively, random sample choice could have led to the chance selection of oocyte samples
with less variation in heteroplasmy measurements, leading to a higher estimate ofNeOog. A third possibility is that a further,
non-significant, reduction in effective mtDNA copy number occurs during embryogenesis.
Our results tie in with those of earlier studies which proposed that segregation is likely to occur prior to the differentiation of the primary oocyte population during oogenesis in mouse [8,21]. Possible mechanisms underlying heteroplasmy shifts in oocytes have been proposed and include relaxed replication of mtDNA, and random partitioning of mitochondria [8,48], which typically depend on vast cell proliferation and mtDNA replication, two processes that can be observed during germ line development [19,49].
Previous studies suggest that the size of the intergenerational mtDNA bottleneck is unexpectedly similar across a wide range of different taxa, spanning invertebrates to vertebrates, supporting the idea of a conserved mechanism across taxa [7,8,12,31,34,36]. Our estimates of NeOog and NeEmb for chinook salmon are in
concordance with those of mammals [8,20] and crickets [31], and within the same order of magnitude as fruit flies [12]; despite the 10,000-fold higher mtDNA content of chinook salmon versus mammalian oocytes, and differences in cleavage patterns (rota-tional holoblastic in mammals vs. discoidal meroblastic in teleosts) [34,39,50]. Further, the mechanism in salmon demonstrates striking similarities to those found in mice, according to two studies, in that segregation of heteroplasmy can be accounted for during oogenesis [8,21]. Thus, our findings strongly indicate that mechanisms of mitochondrial inheritance may be conserved and of a comparable nature among divergent taxa.
The intergenerational transmission of mitochondrial hetero-plasmy has many important biological implications. First, the transmission of heteroplasmy has direct impact on the inheritance of mitochondrial diseases [1,51,52,53] - most of which are observed in a heteroplasmic form and expressed when the deleterious allele exceeds a certain threshold [1,4]. Second, heteroplasmy may also create some ambiguity in phylogenetic and network interpretations of population data of mtDNA [2]. Third, heteroplasmy will create the possibility for intermolecular recombination [2,3], which might further affect the evolution of the mtDNA molecule and thus evolutionary analysis based on this molecule [54], but also may enable the molecule to escape the mutational meltdown expected if it were solely inherited in a clonal fashion [28,55]. On the other hand, the inclusion of knowledge of the frequency and stability of mtDNA heteroplasmy would increase the level of molecular information available from, and may improve the resolution of, mtDNA focused analyses in evolutionary, forensic and medical science [2].
For example, heteroplasmic states that are stably inherited for significant periods may provide useful additional information for defining haplotypes, and resolving further the relationships among individuals at a population level [2]. Thus far such an approach has been used rarely [2,16], but there is potential for this to increase if we better understand the mtDNA bottleneck and can therefore predict how long such mutations might persist. A simple mutation drift model predicts that a mtDNA bottleneck of Ne= 100 leads to a predicted time to fixation for a neutral,
mitochondrial, heteroplasmic variant of approximately 200 generations [2]; long enough to impact significantly on population genetic interpretations.
In this study, we have demonstrated the existence of a mtDNA bottleneck in a teleost, the first non-mammalian vertebrate to be examined. Despite fundamental differences in physiology and developmental cleavage pattern, the number of segregating units between generations appears remarkably similar to that found in
Figure 2. Posterior distributions onNe, the effective bottleneck
number of mitochondrial genomes per cell.
doi:10.1371/journal.pone.0020522.g002
Figure 3. Posterior distribution on heteroplasmy measurement error.
other species, including mouse. This finding suggests the mitochondrial bottleneck might be conserved among divergent taxa. However, across the animal kingdom, our knowledge of the mechanisms underlying mtDNA inheritance is far from complete, and many more studies of this nature are required to further understand this important evolutionary process, and thus capture the full extent of the additional value that an understanding of heteroplasmy may bring to the life sciences.
Supporting Information
Text S1 Detailed mathematical analysis. (DOC)
Text S2 Mathematica notebook (Mathematica file).
(NB)
Text S3 Mathematica notebook (.pdf version). (PDF)
Table S1 Primer and target sequences and dispensation order
for pyrosequencing to determine allele frequencies for two heteroplasmic sites.
(DOC)
Table S2 Raw data for a.mothers (fin clips, additional repeat
measurements (1–10) to infer measurement error in founder females), b.oocytes and c.offspring. Frequencies are expressed as x(101). More than one number in one cell indicates repeat measurements for that sample.
(DOC)
Acknowledgments
We thank the NIWA Silverstream Hatchery team for their support, advice and use of their facilities. For valuable comments, we thank Bill Ballard, Alan Wilton, Lou Puslednik and two annonymous reviewers. We also thank Robbie McPhee for preparing Figure 1. Permissions for this work were covered by ERMA decision GMD00066, MAF permit
#2003018889, the University of Canterbury animal ethics board (permission#2002/01), and the Fish and Game council of New Zealand.
Author Contributions
Conceived and designed the experiments: JNW DJW NJG. Performed the experiments: JNW DJW HEW. Analyzed the data: JNW DJW MW. Contributed reagents/materials/analysis tools: JNW DJW MW HEW NJG. Wrote the paper: JNW DJW MW HEW NJG.
References
1. Poulton J, Chiaratti MR, Meirelles FvV, Kennedy S, Wells D, et al. (2010) Transmission of mitochondrial DNA diseases and ways to prevent them. PLoS Genetics 6: e1001066.
2. White DJ, Wolff JN, Pierson M, Gemmell NJ (2008) Revealing the hidden complexities of mtDNA inheritance. Molecular Ecology 17: 4925–4942. 3. Slate J, Gemmell NJ (2004) Eve ‘n’ Steve: recombination of human
mitochondrial DNA. Trends in Ecology & Evolution 19: 561–563.
4. Wallace DC (1999) Mitochondrial diseases in man and mouse. Science 283: 1482–1488.
5. Rossignol R, Faustin B, Rocher C, Malgat M, Mazat JP, et al. (2003) Mitochondrial threshold effects. Biochemical Journal 370: 751–762. 6. Olivo PD, Van de Walle MJ, Laipis PJ, Hauswirth WW (1983) Nucleotide
sequence evidence for rapid genotypic shifts in the bovine mitochondrial DNA D-loop. Nature 306: 400–402.
7. Ashley MV, Laipis PJ, Hauswirth WW (1989) Rapid segregation of heteroplasmic bovine mitochondria. Nucleic Acids Research 17: 7325–7331. 8. Jenuth JP, Peterson AC, Fu K, Shoubridge EA (1996) Random genetic drift in
the female germline explains the rapid segregation of mammalian mitochondrial DNA. Nature Genetics 14: 146–151.
9. Brown DT, Samuels DC, Michael EM, Turnbull DM, Chinnery PF (2001) Random genetic drift determines the level of mutant mtDNA in human primary oocytes. American Journal of Human Genetics 68: 533–536.
10. Fan W, Waymire KG, Narula N, Li P, Rocher C, et al. (2008) A mouse model of mitochondrial disease reveals germline selection against severe mtDNA mutations. Science 319: 958–962.
11. Stewart JB, Freyer C, Elson JL, Larsson NG (2008) Purifying selection of mtDNA and its implications for understanding evolution and mitochondrial disease. Nature Reviews Genetics 9: 657–662.
12. Solignac M, Ge´nermont J, Monnerot M, Mounolou J-C (1984) Genetics of mitochondria in Drosophila: mtDNA inheritance in heteroplasmic strains ofD.
mauritiana. Molecular and General Genetics 197: 183–188.
13. Harrison RG, Rand DM, Wheeler WC (1985) Mitochondrial-DNA size variation within individual crickets. Science 228: 1446–1448.
14. Wilkinson GS, Chapman AM (1991) Length and sequence variation in evening bat D-loop mtDNA. Genetics 128: 607–617.
15. Gemmell NJ, Western PS, Watson JM, Graves JAM (1996) Evolution of the mammalian mitochondrial control region - comparisons of control region sequences between monotreme and therian mammals. Molecular Biology and Evolution 13: 798–808.
16. Ivanov PL, Wadhams MJ, Roby RK, Holland MM, Weedn VW, et al. (1996) Mitochondrial DNA sequence heteroplasmy in the Grand Duke of Russia Georgij Romanov establishes the authenticity of the remains of Tsar Nicholas II. Nature Genetics 12: 417–420.
17. Howell N, Smejkal CB (2000) Persistent heteroplasmy of a mutation in the human mtDNA control region: Hypermutation as an apparent consequence of simple-repeat expansion/contraction. American Journal of Human Genetics 66: 1589–1598.
18. Taylor JS, Breden F (2002) The inheritance of heteroplasmy in guppies. Journal of Fish Biology 60: 1346–1350.
19. Cao L, Shitara H, Horii T, Nagao Y, Imai H, et al. (2007) The mitochondrial bottleneck occurs without reduction of mtDNA content in female mouse germ cells. Nature Genetics 39: 386–390.
20. Cree LM, Samuels DC, de Sousa Lopes SC, Rajasimha HK, Wonnapinij P, et al. (2008) A reduction of mitochondrial DNA molecules during embryogenesis explains the rapid segregation of genotypes. Nature Genetics 40: 249–254. 21. Wai T, Teoli D, Shoubridge EA (2008) The mitochondrial DNA genetic
bottleneck results from replication of a subpopulation of genomes. Nature Genetics 40: 1484–1488.
22. Wonnapinij P, Chinnery PF, Samuels DC (2010) Previous Estimates of Mitochondrial DNA Mutation Level Variance Did Not Account for Sampling Error: Comparing the mtDNA Genetic Bottleneck in Mice and Humans. American Journal of Human Genetics 86: 540–550.
23. Samuels D, Wonnapinij P, Cree L, Chinnery P (2010) Reassessing evidence for a postnatal mitochondrial genetic bottleneck. Nature Genetics 42: 471–472. 24. Shoubridge EA, Wai T (2008) Sidestepping mutational meltdown. Science 319:
914–915.
25. Cao L, Shitara H, Sugimoto M, Hayashi J-I, Abe K, et al. (2009) New evidence confirms that the mitochondrial bottleneck is generated without reduction of mitochondrial DNA content in early primordial germ cells of mice. PLoS Genet 5: e1000756.
26. Lightowlers RN, Chinnery PF, Turnbull DM, Howell N (1997) Mammalian mitochondrial genetics: heredity, heteroplasmy and disease. Trends in Genetics 13: 450–455.
27. Bergstrom CT, Pritchard J (1998) Germline bottlenecks and the evolutionary maintenance of mitochondrial genomes. Genetics 149: 2135–2146.
28. Gemmell NJ, Metcalf VJ, Allendorf FW (2004) Mother’s curse: the effect of mtDNA on individual fitness and population viability. Trends in Ecology & Evolution 19: 238–244.
29. Smith LC, Bordignon V, Couto MM, Garcia SM, Yamazaki W, et al. (2002) Mitochondrial genotype segregation and the bottleneck. Reproductive Biomed-icine Online 4: 248–255.
30. Koehler CM, Lindberg GL, Brown DR, Beitz DC, Freeman AE, et al. (1991) Replacement of bovine mitochondrial DNA by a sequence variant within one generation. Genetics 129: 247–255.
31. Rand DM, Harrison RG (1986) Mitochondrial DNA transmission genetics in crickets. Genetics 114: 955–970.
32. Hauswirth WW, Laipis PJ (1982) Mitochondrial DNA polymorphism in a maternal lineage of Holstein cows. Proceedings of the National Academy of Sciences of the United States of America 79: 4686–4690.
33. Laipis PJ, Van de Walle MJ, Hauswirth WW (1988) Unequal partitioning of bovine mitochondrial genotypes among siblings. Proceedings of the National Academy of Sciences of the United States of America 85: 8107–8110. 34. Howell N, Halvorson S, Kubacka I, McCullough DA, Bindoff LA, et al. (1992)
Mitochondrial gene segregation in mammals: is the bottleneck always narrow? Human Genetics 90: 117–120.
35. Stewart JB, Freyer C, Elson JL, Wredenberg A, Cansu Z, et al. (2008) Strong purifying selection in transmission of mammalian mitochondrial DNA. PLoS Biology 6: e10.
36. Bendall KE, Macaulay VA, Baker JR, Sykes BC (1996) Heteroplasmic point mutations in the human mtDNA control region. American Journal of Human Genetics 59: 1276–1287.
38. He Y, Wu J, Dressman DC, Iacobuzio-Donahue C, Markowitz SD, et al. (2010) Heteroplasmic mitochondrial DNA mutations in normal and tumour cells. Nature 464: 610–614.
39. Wolff JN, Gemmell NJ (2008) Lost in the zygote: the dilution of paternal mtDNA upon fertilization. Heredity 101: 429–434.
40. Huet M (1970) Breeding and cultivation of salmonids. , Kahn H, translator. London: Fishing News Ltd.
41. McIntyre JD, Stickney RR (1991) Pacific salmon Culture for stocking. Boca Raton: CRC Press.
42. Aranishi F (2006) A short-cut DNA extraction from cod caviar. Journal of the Science of Food and Agriculture 86: 425–428.
43. Poulton J, Macaulay V, Marchington DR (1998) Mitochondrial genetics ’98 is the bottleneck cracked? American Journal of Human Genetics 62: 752–757. 44. Wonnapinij P, Chinnery PF, Samuels DC (2008) The distribution of
mitochondrial DNA heteroplasmy due to random genetic drift. American Journal of Human Genetics 83: 582–593.
45. Hendy MD, Woodhams MD, Dodd A (2009) Modelling mitochondrial site polymorphisms to infer the number of segregating units and mutation rate. Biology Letters 5: 397–400.
46. Millar CD, Dodd A, Anderson J, Gibb GC, Ritchie PA, et al. (2008) Mutation and evolutionary rates in adelie penguins from the antarctic. PLoS Genetics 4: e1000209.
47. White HE, Durston VJ, Seller A, Fratter C, Harvey JF, et al. (2005) Accurate detection and quantitation of heteroplasmic mitochondrial point mutations by pyrosequencing. Genetic Testing 9: 190–199.
48. Birky CW (2001) The inheritance of genes in mitochondria and chloroplasts: laws, mechanisms, and models. Annual Review of Genetics 35: 125–148. 49. Shoubridge EA, Wai T (2007) Mitochondrial DNA and the mammalian oocyte.
In: St. John JC, ed. The mitochondrion in the germline and early development. San Diego: Elsevier. pp 87–111.
50. May-Panloup P, Chretien MF, Jacques C, Vasseur C, Malthiery Y, et al. (2005) Low oocyte mitochondrial DNA content in ovarian insufficiency. Human Reproduction (Oxford) 20: 593–597.
51. White SL, Collins VR, Wolfe R, Cleary MA, Shanske S, et al. (1999) Genetic counseling and prenatal diagnosis for the mitochondrial DNA mutations at nucleotide 8993. American Journal of Human Genetics 65: 474–482. 52. Blok RB, Gook DA, Thorburn DR, Dahl HH (1997) Skewed segregation of the
mtDNA nt 8993 (TRG) mutation in human oocytes. American Journal of Human Genetics 60: 1495–1501.
53. Holt IJ, Dunbar DR, Jacobs HT (1997) Behaviour of a population of partially duplicated mitochondrial DNA molecules in cell culture: segregation, mainte-nance and recombination dependent upon nuclear background. Human Molecular Genetics 6: 1251–1260.
54. White DJ, Gemmell NJ (2009) Can indirect tests detect a known recombination event in human mtDNA? Molecular Biology and Evolution 26: 1435–1439. 55. Lynch M, Blanchard JL (1998) Deleterious mutation accumulation in organelle