* Corresponding author: Mostafa Abbasi Joshaghan, Department of Electrical, Faculty of Engineering, Islamic Azad University, Gonabad Branch, Gonabad, Iran. E-mail: [email protected]
© 2014 mums.ac.ir All rights reserved.
This is an Open Access article distributed under the terms of the Creative Commons Attribution License
Evaluation of the Nutritional Effects of Fasting on
Cardiovascular Diseases, Using Fuzzy Data Mining
Mostafa Abbasi Joshaghan
1*, Ali Vahidian Kamyad
2, Amir Reza Razavi
3, Abdolreza
Norouzy
41 Department of Electrical, Faculty of Engineering, Islamic Azad University, Gonabad Branch, Gonabad, Iran
2 Department of Applied Mathematics, Faculty of Mathematics, Department of Electrical, Faculty of Engineering, Ferdowsi University, Mashhad, Iran 3 Department of Medical Informatic, Faculty of Medicine, Mashhad University of Medical Sciences, Mashhad, Iran
4 Department of Nutrition, Faculty of Medicine, Mashhad University of Medical Sciences, Mashhad, Iran
A R T I C L E I N F O A B S T R A C T
Article type:
Original article
Introduction: Advances in information technology and data collection methods have
enabled high-speed collection and storage of huge amounts of data. Data mining can be used to derive laws fromlargedata volumes and their characteristics (1). Similarly, fuzzy logic by facilitating the understanding of events is considered a suitable complement to scientific data mining.
Method: The present study used clustering to identify the independent characteristics of
data. Related fuzzy sets, linguistic variables, and data classifications were defined, and the index was introduced based on the characteristics extracted from useful results. By considering the disease risk factors, the results were analyzed.
Results: Two factors contributing to the health improvement or deterioration were
defined: ‘age’ and ‘the appropriateness or inappropriateness between insulin level and blood sugar’. In addition, according to the results, fasting had a positive effect on fatty substances of the blood (cholesterol and triglycerides).
Conclusion: The results can help us determine whether or not an individual with a
cardiovascular disease should fast in the month of Ramadan. However, due to variations in some features such as blood pressure throughout the day, there are uncertainties in some input data; therefore, the results could be far from reality. If it is possible to generate fuzzy data, then we can obtain more accurate results.
Article History:
Received: 24 Jan 2014 Revised: 05 Feb 2014 Accepted: 07 Feb 2014 Published: 19 Feb 2014
Keywords:
Cardiovascular disease Classification Clustering Fasting Fuzzy set theory
Please cite this paper as:
Abbasi Joshaghan M, Vahidian Kamyad A, Razavi AR, Norouzy A. Evaluation of the Nutritional Effects of Fasting on Cardiovascular Diseases, Using Fuzzy Data Mining. J Fasting Health. 2014; 2(1): 14-21.
Introduction
Today, most companies and organizations are producing and recording different types of data. Extracting the appropriate data from databases and converting them into useful knowledge reveal hidden aspects in various fields and help with the progress of the organizations. Data mining as a new statistical technology can facilitate the development of various scientific fields. In other words, data mining is the extraction of information and knowledge and discovery of hidden patterns in large databases (2, 3).
Fuzzy logic as a form of reasoning which is approximate rather than exact, has many
applications in various fields (4). Due to the proximity of fuzzy logic to human reasoning, its methods are easy to understand. In case of inaccurate and vague information, fuzzy sets provide data with more accuracy. In the data mining process, fuzzy logic can be applied especially by professionals in human resources (5, 6). Regarding data mining techniques such as clustering and classification, fuzzy logic has a great impact on the development process of data mining.
health care centers can be analyzed and invest-tigated using data mining processes. An effective review not only requires the use of data analysis techniques, but also calls for the integration of medical knowledge with these techniques and a close collaboration between the experts of data analysis and medical care (7).
Today, cardiovascular diseases are
conside-red a major threat to societies due to the unhealthy lifestyle of people. Knowledge of the risk factors and making positive lifestyle modifications can prevent the disease progress (8), and even the resultant morbidity and mortality can be significantly prohibited.
According to the lunar calendar, Muslims fast during the month of Ramadan. In Qur'an, in addition to spiritual growth, health benefits of fasting have been emphasized. Moreover, according to religious principles, only a healthy individual should fast during this month; in other words, if a person's health is compromised, he/she should refrain from fasting.
In compliance with medical advice, fasting can be considered as a diet. Fasting in some patients can be followed by improvements in health indices, in case the patients have consulted a physician. Therefore, special attention needs to be paid to fasting by both physicians and patients. In case of cardiovascular disease, patients should consult a physician in order to see whether or not fasting is disadvantageous for them.
In this study, a database including 75 cardiovascular patients (36 males and 39 females), aged 29-76 years, was used. Each patient’s record included 24 features, and the data were gathered before and after Ramadan. The purpose of this study was to evaluate the patient’s health condition via fuzzy data mining.
Materials and Method
One of the major steps of data mining is data preparation phase. The larger the data volume is, the more difficult the analysis will be. Since each record contained 24 features, conducting an analysis was quite difficult; therefore, data with reduced dimensions would facilitate the analysis of data (9). By using fuzzy clustering, clusters and the relationship between the features in the cluster were identified.
To start, we considered a k×n matrix (M)
from the database, with k and n denoting the
number of features and patients, respectively. The original data varied in size and range; therefore, they were converted to standard data.
First, we formed the matrix �′with the
following formula:
���′ =����−���� (1)
In this formula, i=1,…,k is the number of
rows, j=1,…,n is the number of columns, ��� is
the mean, and �� is the standard deviation of
each column of matrix M.
Afterwards, the matrix elements range was
converted to [0, 1], and matrix �′′wasformed:
���′′ =
���′ −�������′ ∶ 1≤�≤��
�������′ ∶ 1≤�≤��−�������′ ∶ 1≤�≤�� , j=1,…,n (2)
Then, a similar fuzzy matrix was formed:
���=
∑�ℎ=1������ℎ′′,��ℎ′′ �
∑�ℎ=1������ℎ′′,��ℎ′′ � , i=1,…,k j=1,…,n (3)
The resulting matrix (R= [���]) was diagonal;
therefore, in the above equation, i is considered
≤j (10, 11).
According to the results of clustering and by focusing on blood features, multiple features with more independence were selected which are as follows: triglyceride (TG), cholesterol (CHOL), diastolic pressure (DP), and fasting blood sugar (FBS).
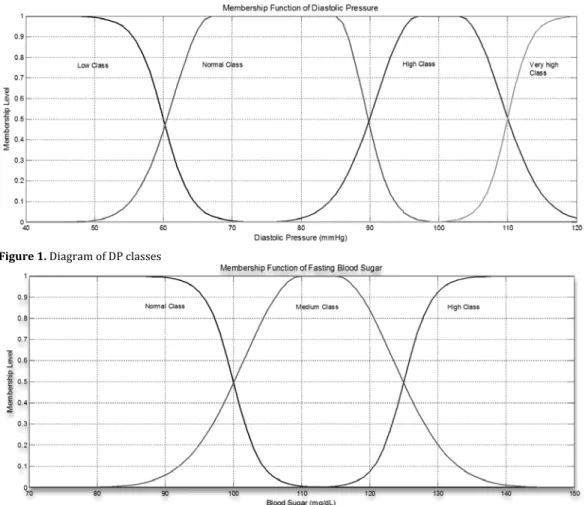
After pre-processing and dimensionality reduction, to obtain the values of the aforementioned features, a new model needed to be formed. In the medical literature and according to the laboratory results, a specific range is defined for normal and high values of each feature; however, these ranges are exact. In the present study, we used defined ranges, and with the help of fuzzy set theory, a unique classification was considered for each feature. (Table 1)
Table 1. Ranges of the selected features
Features Low Normal Medium High Very High
DP * * * *
FBS * * *
CHOL * * * *
Figure 1. Diagram of DP classes
Figure 2. Diagram of FBS classes
In data classification, similar to fuzzy clustering, data may belong to more than one class (12, 13). In fact, each fuzzy class is a fuzzy set, and the amount of data belonging to each fuzzy class is determined by the corresponding membership function. For each class, two fuzzy sets were formed (before and after Ramadan, with the same membership function):
�̃=����,��(��)�|��∈�� (4)
In this equation, i=1,…,75 indicates the
record number or the subject, X is a universal
set of relevant features of the data sets in the
database, �� is the data relating to the subject,
and ���(��)denotes the grade of the membership
of �� in �̃. ;���(��)is a real number satisfying 0≤���(��)≤1 (4).
Guassian and Sigmoid functions were used to determine the membership functions, and for each feature, the membership function was
defined according to the specified range (14). Membership function curves for each of the features are shown in the following figures (Figures 1-4).
After data classification, the results
(outputs) were required for data analysis. Two indices were introduced:
First index: This index refers to the cardinality of fuzzy sets, but first it is necessary to give a definition of cardinality.
A fuzzy set �̃ is denoted as:
�̃=���,���(�)�|�∈�� (5)
The cardinality is defined as the sum of the
membership degrees of the limited set �̃,
whichin fact defines the number of members with full membership. In other words, we have:
��̃�=������̃�=∑��=1���(��) , ∀�∈� (6)
Figure 3. Diagram of CHOL classes
Figure 4. Diagram of TG classes
In addition, relative cardinality is defined as follows:
��̃�=∑��=1���(��)
� , ∀�∈� (7)
For the deployment of cardinality, first a
new set C was defined for each feature. This set
included individuals who did not belong to the normal class before Ramadan, but after this month, they were classified as the normal class or had a membership degree in this class. The cardinality in each set is the sum of membership degrees for all those entering the normal class. This number shows the positive effects on each feature during Ramadan fasting.
Contrary to set C, a new set D was defined.
This set for each feature included individuals who did not belong to the high and very high classes before Ramadan, but after this month, they were included in the mentioned classes or had a membership degree in the high and very
high classes. This number shows the negative effects on each feature during Ramadan fasting. The obtained results will be discussed in the next section.
Second index: By using the selected features, a function was defined to analyze the classifications. It should be noted that this function had coefficients, and the coefficient choice was based on the importance of each feature in the health of an individual from the perspective of physicians and different sources. The mentioned functions are defined as follows:
�=�����,����,��ℎ��,����
=�1��(���) +�2��(����) +�3��(��ℎ��) + �4��(���) (8)
Figure 5. MISO system for the defined function
In Figure 5, d (as the output) is defined as
the health degree, and the inputs include the membership degrees of the selected features in
the normal sets. Variables w are important
coefficients for the index:
�1+�2+�3+�4= 1 (9)
The above coefficients determine the importance of each factor for health, and are as follows:
�1= 0.3, �2= 0.25, �3= 0.3, �4= 0.15 (17)
In the present study, the goal was to compare the index changes in each person between the pre- and post-Ramadan periods.
∆�=�������������−�������������� (10)
If the above equation was positive for each person, we could say that fasting had positive effects on the health or vice versa.
Table 2. Cardinality of fuzzy set C
Number of records for C Cardinality of fuzzy set C
Features
4 2.2728
DP
5 4.3228
FBS
10 9.8959
CHOL
18 16.9455
TG
Table 3. Cardinality of fuzzy set D
Number of records for D Cardinality of fuzzy set D
Features
6.0881 9
DP
3.2689 4
FBS
1.24 2
CHOL
5.2494 6
TG
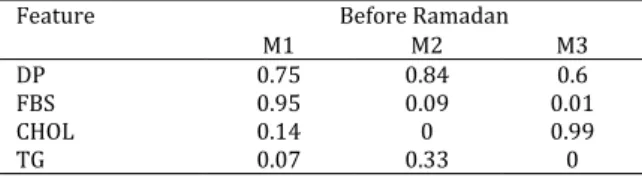
Table 4. The average of membership in the normal class for each selected feature
Before Ramadan Feature
M3 M2
M1
0.6 0.84
0.75 DP
0.01 0.09
0.95 FBS
0.99 0
0.14 CHOL
0 0.33
0.07 TG
Table 5. The average membership of the normal class for each selected feature
Before Ramadan Feature
N2 N1
0.79 0.97
DP
0.99 0.04
FBS
0.99 0.85
CHOL
0.4 0.29
TG
Results
The results of the first index: This index showed the positive effects on each feature during Ramadan fasting; of course, this did not mean that a person regained his/her health.
Table 2 shows the cardinality of fuzzy set C.
According to Table 2, fasting has positive effects on the blood fats; in fact, fasting can change the level of CHOL and TG towards the normal range. In Table 3, the negative effects of
fasting are shown for fuzzy set D.
According to Table 3, fasting has negative effects on DP and has the least effect on CHOL.
Second index results: As discussed in the previous section, changes in the indices during fasting are helpful for checking the recovery or deterioration of an individual’s health. The output of the equation (10) was placed in the interval [-1, 1]. Therefore, we considered the set
of individuals with ∆�> 0and cutting in 0.2
(∆�> 0.2) as the new set M, and the set of
subjects with ∆�< 0and cutting in -0.2 (∆�<
−0.2) as the new set N.
Indeed the members of the mentioned sets
are the results that should be studied (M with
∆�> 0.2 and N with ∆�<−0.2) . Fourteen
individuals are included in the set M, and set N
consists of 12 subjects. For a better analysis of the data, we performed a simple clustering of
the sets (M and N). The results of clustering for
sets M and N were 3 and 2 clusters, respectively.
Tables 4 and 5 show the mean membership level of the subjects in each cluster for the normal class.
The above tables did not prove to be helpful. As it is known, DP, FBS, and CHOL are some of the risk factors for cardiovascular diseases. Here other risk factors were used to analyze the results. Thus, risk factors such as age, sex, low-density lipoprotein (LDL), insulin level, body mass index (BMI), and waist circumference were considered. Tables 6-11 show the
mentioned features in M and N clusters.
�
MISO Health System
Inputs Outputs
���
����
��ℎ��
Table 6. M and N clusters before Ramadan N2 N1 M3 M2 M1 Feature 5 7 4 6 4 Number of members
57.2 57 50 51.8 51.7 Average age 58% 57% 75% 50% 50% Percentage of male participants
Table 7. Comparison of the average insulin level in clusters Normal range N2 N1 M3 M2 M1 Feature
4 – 11 15.6 9.85 16 17.2 8.97 Before Ramadan Average insulin level (uIU/mL)
Table 8. Comparison of the average LDL in clusters
Normal range N2 N1 M3 M2 M1 Feature <130 75 105 87 153 127 Before Ramadan Average LDL (mg/dL) 99 101 75.2 99.7 112 After Ramadan
According to Table 6, the average age in M
(51 years) is approximately 6 years less than N
(57 years). Therefore, age can be considered as a risk factor.
According to tables 4, 5 and 7, in clusters M1
and M2, the average of FBS is not normal and
insulin level is higher than the normal range.
Unlike clusters N1 and N2, in cluster M1, FBS
and insulin level are both normal. In cluster N1,
FBS is not normal, unlike the insulin level. In
cluster N2, FBS is normal, and insulin level is
higher than normal. The imbalance between the two sets is remarkable; in other words, the imbalance between insulin level and FBS is the main reason or one of the reasons for index
deterioration in N during fasting.
According to table 8, although the index
decreases, LDL is normal in clusters N1 and N2;
However, in clusters M1 and M2, LDL is
borderline and even higher than normal. As discussed in the first index, fasting has positive effects on blood fats, especially CHOL. However,
LDL is normal in set N, and undergoes no
changes (even no increase) after Ramadan; this could be due to the reason mentioned in the previous paragraph.
In Tables 9-11, in clusters M1, M2 and M3,
waist circumference is higher than normal, especially for females. BMI is also higher than normal (considered as almost overweight), but the cases recover after Ramadan. Since these features directly correlate with blood fats (TG and CHOL), fasting can have positive effects.
Table 9. Comparison of the average BMI in clusters
Normal range N2 N1 M3 M2 M1 Feature 18.5–24.99 26.6 27.3 30 28.3 30.7 Before Ramadan Average BMI 20.45 26.55 29.4 27.8 29.5 After Ramadan
Table 10. Comparison of the average waist circumference of males in clusters
Normal range N2 N1 M3 M2 M1 Feature 93.9–101.5 102 99.5 106.7 92.3 97 Before Ramadan Average waist circumference 98 97.5 105 93 95.5 After Ramadan
Table 11 .Comparison of the average waist circumference of females in clusters
Normal range N2 N1 M3 M2 M1 Feature
80 – 88.9 91.5 100 98 103 106 Before Ramadan Average waist circumference 85 101 96 102 105.5 After Ramadan
Discussion
As to the previous section, we can conclude that age and imbalance between insulin level and FBS are of high importance. In other words, these two factors can determine whether an individual can fast during Ramadan or not. Moreover, fasting has positive effects on blood fats including CHOL and TG.
Blood pressure of healthy individuals normally changes throughout the day; it is higher in the morning and lower at night (18). Moreover, blood pressure changes due to some factors such as work stress, physical activity, and the consumption of some foods and medications. Therefore, in this study we face the uncertainty in some input data such as blood pressure, etc. Considering the uncertainties in the study, the obtained results were not fully in consistence with previous results, no matter what the method was.
Figure 6. Blood pressure changes and production of fuzzy number
Suppose there is a set of individuals who
should be assessed by two LR1fuzzy numbers
before and after their diets;
The LR fuzzy numbers are defined by two
functions L : [0;∞) →[0; 1] and R : [0,∞) → [0, 1]
that:
(1) L(·) and R(·) are left and right continuous. (2) L(·) and R(·) have finite support.
(3) L(·) and R(·) are monotonic non increasing (19).
Using these functions the characterizing
function ξ (·) of an LR-fuzzy interval like
��:(��,�1�,�1�)��is defined by:
ξ(�)={�(
�−�
� ) �<�
�(�−�
� ) �≥�
(11);
The changes during the diet need to be assessed.
Before the diet: ��:(��,�1�,�1�)��
After the diet: ��:(��,�2�,�2�)��
If we obtain the difference between the two numbers by the following formula:
���−�����= (��−��,�1�+�2�,�1�+�2�)�� (12)
for all individuals(i=1,…,k), we will have:
�=∑10�=1(��−��) (13)
�=∑10�=1(�1�+�2�) (14)
�=∑10�=1(�1�+�2�) (15)
1Left-Right
If G (as the center) is far from zero, little
difference is observed in blood pressure before and after the diet. In addition, positivity or
negativity of G indicates the increase or
decrease of the value of the feature (e.g. blood pressure). As to the above equations, the overall difference can be obtained for each person.
Conclusion
It is necessary to mention some points about the used data in this study. As previously mentioned, blood pressure of healthy individuals normally changes within 24 hours of the day; due to these alterations, the exact time of these changes cannot be determined. Regarding FBS, the fasting duration and meal times of the subjects were not fully specified in the study; for instance, the meal was consumed at the beginning or at the end of the night before the test. Moreover, subjects’ nutritional status was not determined before and during Ramadan. Also, it should be mentioned that every year, the time and duration of Ramadan fasting change, which can act as a confounding factor. Finally, in the conducted study, it has not been determined whether Ramadan fasting affects physical activity level. By considering these facts, such data can be useful for analysis.
References
1. Cios KJ, Pedrycz W, Swiniarski RW, Kurgan LA. Data Mining, A Knowledge Discovery Approach. New York: Springer; 2007.
0 1 2 3 4 5 6 7 8 9 10 11 12 13 14 15 16 17 18 19 20 21 22 23 24 70
75 80 85 90 95 100
D
ias
tol
ic
P
res
s
ur
e (
m
m
H
g)
Hour
Producing fuzzy data from Blood pressure changes during the day
95
83.67
78
2. Olson DL, Delen D. Advanced Data Mining Techniques. Berlin Heidelberg: Springer-Verlag; 2008.
3. Shahrabi J, Zolghadr Shojaei A. Advanced Data Mining: Concepts & Algorithms. Tehran: Iranian Academic Center for Education Culture and Research, AmirKabir Branch; 2009. [Persian] 4. Golyari S, Vahidian Kamyad A. Application of
Fuzzy Logic in Medicine and Nutrition Science. The 2nd Conference on Medical Applications of
Mathematics and Control Theory; 2009. [Persian]
5. Wang LX. A Course in Fuzzy Systems and Control. (Teshneh Lab M, Saffar Pour N, Afyouni D, Trans). Tehran: Khajeh Nasir University of Technology; 2009. [Persian]
6. Tanaka k. An Introduction toFuzzy Logic for Practical Applications. (Vahidian Kamyad A, Tareghian H R, Trans). Mashhad: Ferdowsi University of Mashhad; 2002. [Persian]
7. Berka P, Rauch J, Zighed DA. Data Mining and Medical Knowledge Management: Cases and Applications. New York: Medical Information Science Reference; 2009.
8. Buckingham SA. Factors that Affect
Cardiovascular Health: A Review. The Plymouth Student Scientist. 2007; 1(1): 331-44.
9. Yan J, Zhang B, Liu N, Yan S, Cheng Q, Fan W, et al. Effective and Efficient Dimensionality Reduction for Large-Scale and Streaming Data Preprocessing. Knowledge and Data Engineering, IEEE Transactions on. 2006; 18(3):320-33. 10. Yang J, Watada J. Fuzzy Clustering Analysis of
Data Mining: Application to An Accident Mining System. International Journal of Innovative
Computing, Information and Control. 2012;8: 5715-24.
11. Yao K, Wang Y. The Applications of Fuzzy Clustering Analysis In The Internal Structure of Perceptions of Organizational Politics. International Journal of Innovative Management, Information & Production. 2011; 2: 49-55. 12. Gan G, Ma C, Wu J. Data Clustering: Theory,
Algorithms and Applications. Philadelphia: American Statistical Association and the Society for Industrial and Applied Mathematics; 2007. 13. Yaghini M, Ranjpour M, Yousofi F. A Review of
Fuzzy Clustering Algorithms. The 3rd Iran Data
Mining Conference; 2009. [Persian]
14. Sivanandam SN, Sumathi S, Deepa SN.
Introduction to Fuzzy Logic using MATLAB. Berlin: Springer-Verlag; 2007.
15. Dhar M. On Cardinality of Fuzzy Sets. International Journal of Intelligent Systems and Applications. 2013; 6: 47-52.
16. Dhar M. Cardinality of Fuzzy Sets: An Overview. International Journal of Energy, Information and Communications. 2013; 4: 15-22.
17. Schnohr P, Jensen JS, Scharling H, Nordestgaard BG. Coronary heart disease risk factors ranked by importance for the individual and community. A 21 year follow-up of 12000 men and women from The Copenhagen City Heart Study. European heart journal. 2002; 23(8): 620-6. 18. Degaute JP, Van De Borne P, Linkowski P, Van
Cauter E. Quantitative analysis of the 24-hour blood pressure and heart rate patterns in young men. Hypertension. 1991; 18(2): 199-210. 19. Viertl R. Statistical Methods for Fuzzy Data. 1st