BGD
12, 14981–15010, 2015
Moderate topsoil erosion rates
J. Zhao et al.
Title Page
Abstract Introduction
Conclusions References
Tables Figures
◭ ◮
◭ ◮
Back Close
Full Screen / Esc
Printer-friendly Version Interactive Discussion
Discussion
P
a
per
|
Discussion
P
a
per
|
Discussion
P
a
per
|
Discussion
P
a
per
|
Biogeosciences Discuss., 12, 14981–15010, 2015 www.biogeosciences-discuss.net/12/14981/2015/ doi:10.5194/bgd-12-14981-2015
© Author(s) 2015. CC Attribution 3.0 License.
This discussion paper is/has been under review for the journal Biogeosciences (BG). Please refer to the corresponding final paper in BG if available.
Moderate topsoil erosion rates constrain
the magnitude of the erosion-induced
carbon sink and agricultural productivity
losses on the Chinese Loess Plateau
J. Zhao1,2, K. Van Oost3, L. Chen2, and G. Govers1
1
Division of Geography, Department of Earth and Environmental Sciences, KU Leuven, Leuven, Belgium
2
School of Environmental Sciences and Spatial informatics, China University of Mining and Technology, 221116 Xuzhou, China
3
Earth and Life Institute, Universite Catholique de Louvain, Louvain-la-Neuve, Belgium Received: 18 July 2015 – Accepted: 24 August 2015 – Published: 10 September 2015 Correspondence to: J. Zhao (jianlin.zhao@ees.kuleuven.be)
BGD
12, 14981–15010, 2015
Moderate topsoil erosion rates
J. Zhao et al.
Title Page
Abstract Introduction
Conclusions References
Tables Figures
◭ ◮
◭ ◮
Back Close
Full Screen / Esc
Printer-friendly Version Interactive Discussion
Discussion
P
a
per
|
Discussion
P
a
per
|
Discussion
P
a
per
|
Discussion
P
a
per
|
Abstract
Despite a multitude of studies, erosion rates as well as the contribution of different processes on Chinese Loess Plateau (CLP) remain uncertain. This makes it impossi-ble to correctly assess the impact of conservation programs and the magnitude of the erosion-induced carbon sink. We used a novel approach, based on field evidence, to
5
reassess erosion rates on the CLP before and after conservation measures were im-plemented. Our results show that the current average topsoil erosion rate is 3–9 times lower than earlier estimates suggested: most sediments are mobilised by gully erosion and/or landsliding. Under 2005 conditions, the combination of topsoil erosion, gully ero-sion and landslides mobilised 0.81±0.23 Gt yr−1 of sediments and 4.77±1.96 Tg yr−1
10
of soil organic carbon (SOC): the latter number sets the maximum magnitude of the erosion-induced carbon sink, which is ca. 4 times lower than other recent estimates suggest. The sediment fluxes we calculate are consistent with sediment yields mea-sured in the Yellow River.
The conservation programs implemented from the 1950s onwards reduced topsoil
15
erosion from 0.51±0.13 to 0.30±0.08 Gt yr−1while SOC mobilisation was reduced from 7.63±3.52 to 4.77±1.96 Tg C. Prior to 1950, a geomorphological equilibrium existed whereby the amount of sediment and carbon exported to the Bohai sea was similar to the amount of sediment eroded on the CLP, so that the erosion-induced carbon sink nearly equalled the amount of mobilised SOC. Conservation efforts and reservoir
20
construction have disrupted this equilibrium and most eroded sediments and carbon are now stored on land where part of the SOC may decompose, thereby potentially lowering the strength of the erosion-induced carbon sink.
Despite the fact that average topsoil losses on the CLP are still relatively high, the current level of topsoil erosion on the CLP is no major threat to the agricultural
pro-25
BGD
12, 14981–15010, 2015
Moderate topsoil erosion rates
J. Zhao et al.
Title Page
Abstract Introduction
Conclusions References
Tables Figures
◭ ◮
◭ ◮
Back Close
Full Screen / Esc
Printer-friendly Version Interactive Discussion
Discussion
P
a
per
|
Discussion
P
a
per
|
Discussion
P
a
per
|
Discussion
P
a
per
|
so for the CLP we have shown that current perceptions regarding the intensity of soil erosion and its effects (both negative and positive) need to be revised.
1 Introduction
The Chinese Loess Plateau (CLP) is one of the cradles of human civilization: agricul-ture started in ca. 7500 BC and the first kingdoms appeared around 1000 BC (Li et al.,
5
2007). The fertile loess soils of the area are a key factor in explaining this early devel-opment (Ho, 1969). Yet, loess soils are also highly sensitive to erosion (Zhang et al., 2004). The intense erosion of soils on the CLP was already described many years ago and seen as a key factor explaining the relative decline of the area and its descrip-tion as “China”s sorrow’ (Liu, 1999; Lowdermilk, 1953). Soil erosion not only threatens
10
agricultural soil productivity, but also causes water pollution and reservoir sedimenta-tion (Blanco-Canqui and Lal, 2008; Pimentel et al., 1995) and exacerbates downstream flooding problems in the valley of the Yellow River (Cai, 2001; Tsunekawa et al., 2014). Therefore, major conservation efforts were undertaken to reduce soil erosion on the CLP in two stages: between 1950 and 1990 conservation focused on reducing erosion
15
through infrastructural measures: intensive programs of terracing and check-dam con-struction were implemented aiming at reducing erosion while maintaining or improving agricultural production (Chen et al., 2007; Shi and Shao, 2000; Zhao et al., 2013). After 1990, efforts focused on reforestation to curb erosion problems (Chen et al., 2007; Fu et al., 2011; Sun et al., 2013).
20
Soil erosion also has a significant impact on elemental cycles. In particular, agricul-tural erosion has been reported to induce a carbon sink from the atmosphere to the soil, driven by dynamic replacement at eroded sites and soil organic carbon (SOC) burial at depositional sites (Y. Li et al., 2015; Van Oost et al., 2007). Determining the exact magnitude of this sink critically depends on the fate of the eroded carbon as
25
ero-BGD
12, 14981–15010, 2015
Moderate topsoil erosion rates
J. Zhao et al.
Title Page
Abstract Introduction
Conclusions References
Tables Figures
◭ ◮
◭ ◮
Back Close
Full Screen / Esc
Printer-friendly Version Interactive Discussion
Discussion
P
a
per
|
Discussion
P
a
per
|
Discussion
P
a
per
|
Discussion
P
a
per
|
sion processes (Y. Li et al., 2015). One recent estimate places the total amount of SOC that is currently annually mobilised by soil erosion on the CLP area at ca. 18 Tg (Ran et al., 2014), which is 1.5 to 2 times the amount of carbon sequestered in biomass (Feng et al., 2013; Persson et al., 2013) and one order of magnitude larger than the amount of carbon sequestered in soils as a result of theGrain for Greensoil
conserva-5
tion program (Chang et al., 2011; Deng et al., 2013; Shi and Han, 2014; Zhang et al., 2010). Soil erosion also affects the cycling of major nutrients such as N and P: nutrient losses by soil erosion can exceed nutrient inputs by fertilization, thereby reducing soil fertility and generating significant economic and environmental costs (Quinton et al., 2010; Trimble and Crosson, 2000).
10
The impact of erosion not only depends on the total quantity of sediments mobilised but also on their source. Crop productivity is largely controlled by the water holding capacity of the topsoil layer and is therefore threatened when excessive topsoil erosion by rill and interrill erosion occurs (Bakker et al., 2004; den Biggelaar et al., 2003a). Topsoil also contains far more SOC and nutrients than subsoil material and its
mobili-15
sation will therefore have a strong impact on carbon and nutrient cycling (Jobbágy and Jackson, 2000, 2001). Excessive river sediment loads and the siltation of reservoirs, on the other hand, may be caused by a range of processes, including gully erosion and landsliding. However, these processes will be less important for elemental cycling as the sediments mobilised contain much less SOC and nutrients than topsoil (Han et al.,
20
2010).
Assessment of topsoil erosion rates over large areas is not straightforward. While measurements of sediment yield provide information on the net loss of sediment from an area (Cai, 2001; Tang et al., 1993), they cannot be directly converted into (top-) soil erosion rates as other erosion processes may also contribute to sediment
mobili-25
BGD
12, 14981–15010, 2015
Moderate topsoil erosion rates
J. Zhao et al.
Title Page
Abstract Introduction
Conclusions References
Tables Figures
◭ ◮
◭ ◮
Back Close
Full Screen / Esc
Printer-friendly Version Interactive Discussion
Discussion
P
a
per
|
Discussion
P
a
per
|
Discussion
P
a
per
|
Discussion
P
a
per
|
extensively calibrated and validated for the prediction of topsoil erosion by water (rill and inter-rill erosion) on cropland in the USA. Current (R)USLE estimates of topsoil erosion on the CLP vary between 0.95 and 4.32 Gt, a wide range reflecting the uncer-tainty on these estimates (Table 2). Even more importantly, these values are at least equal to and mostly significantly larger than the total sediment yield of the CLP before
5
conservation programs were implemented and reservoirs were installed (Miao et al., 2010). This raises the question whether the true value of topsoil erosion is even within the broad range of estimates that has been published. On the CLP, a dense network of active gullies is present over large areas of the CLP (Cai, 2001) and landslides due to earthquakes or heavy rainfall mobilise large amounts of sediment (Zhang and Wang,
10
2007). It is unlikely that the total contribution of these processes to sediment export would be negligible in comparison to the amount of soil mobilised by topsoil erosion.
Evidently, the large uncertainties on current topsoil erosion prevent a correct assess-ment of the impact of topsoil erosion. However, an important data source that may allow to address these uncertainties has hitherto been left untapped. Numerous field studies
15
on erosion on the CLP have been carried out, the results of which were hitherto not used to improve regional erosion estimates. Many of these studies were carried out using erosion plots and therefore measured topsoil erosion by sheet and rill erosion. Other studies assessed erosion rates at the small catchment scale, where measured sediment fluxes are the result of both topsoil erosion and gully erosion. We used the
20
results of these field observations to develop models that, after validation, allowed to calculate topsoil erosion and gully erosion on the CLP and to assess how conserva-tion programs have affected sediment mobilisation and transport. This allowed us (i) to develop sediment budgets for the CLP before and after the implementation of conser-vation programs and (ii) to more accurately assess the amount of SOC and nutrients
25
BGD
12, 14981–15010, 2015
Moderate topsoil erosion rates
J. Zhao et al.
Title Page
Abstract Introduction
Conclusions References
Tables Figures
◭ ◮
◭ ◮
Back Close
Full Screen / Esc
Printer-friendly Version Interactive Discussion
Discussion
P
a
per
|
Discussion
P
a
per
|
Discussion
P
a
per
|
Discussion
P
a
per
|
2 Materials and methods
2.1 Materials
Erosion plot database (EPD).We compiled a large dataset of erosion rates measured on erosion plots from scientific papers, books and reports (Supplement 1). Only mea-surements conducted for at least one year on bounded erosion plots with a minimum
5
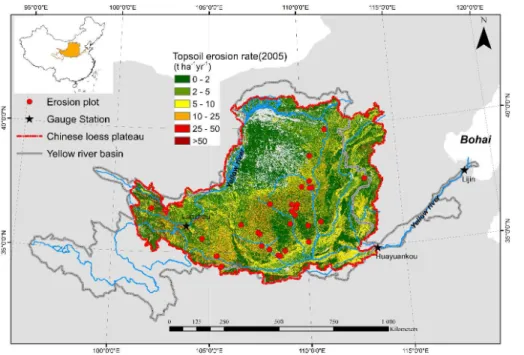
plot length of 3 m with a specific land use type under natural rainfall were retained. Plots on which soil and water conservation measures were tested were not considered as these are not representative for standard agricultural practices. The final database consisted of data for 306 erosion plots spread all over the CLP (Fig. 1), on which mea-surements were carried out for a total of 1357 plot years (Supplement 1).
10
Landscape characterisation.1000 randomly distributed points (GEps) were selected using ArcGIS 10.1 software (Supplement 2). The points were loaded into Google® Earth software and for each point the land use type was determined visually using four classes: forest, grassland, farmland and other (built-up, desert or barren and wa-ter body). The topography was also subdivided into four categories: flat, hilly, gullied
15
land and “other” if the topography type could not be well defined. Desert areas were classified separately. When farmland was present, we registered whether or not the farmland was terraced and determined the maximum field length in the downslope di-rection. The proportion of gully areas for whole CLP (Ag) is estimated as the ratio of gullied land points to total points. The proportion of terraced land (TP) (Fig. S1) as well
20
as the average field slope length for terraced (λT) and sloping land (λS) was calculated for 5◦slope intervals (Fig. S2).
Land use. The land use dataset of 1980 and 2005 with 100 m resolution was pro-vided by the Resources and Environmental Centre of the Institute of Geographical Sciences and Natural Resources Research, Chinese Academic of Sciences (http:
25
//www.geodata.cn/) and reports the dominant land use for each pixel.
BGD
12, 14981–15010, 2015
Moderate topsoil erosion rates
J. Zhao et al.
Title Page
Abstract Introduction
Conclusions References
Tables Figures
◭ ◮
◭ ◮
Back Close
Full Screen / Esc
Printer-friendly Version Interactive Discussion
Discussion
P
a
per
|
Discussion
P
a
per
|
Discussion
P
a
per
|
Discussion
P
a
per
|
Environmental and Ecological Science Data Centre for West China, National Science Foundation of China (http://westdc.westgis.ac.cn/). Slope calculations were corrected for resolution effects using the procedures developed by Van Oost et al. (2007).
2.2 Estimation of average topsoil erosion rate (TER)
On farmland erosion plots, a strong correlation was found between TER and slope
5
gradient and slope length. Such relationships were not present for other land uses plots (Table 1). Surface runoffon permanently vegetated land (forest and shrub land) is most often discontinuous with patches generating runoffthat subsequently infiltrates at other locations on the slope: hence, the erosive power of overland flow does not increase systematically in the downslope direction (Cammeraat, 2002; Cerdan et al.,
10
2004). The absence of a relationship between slope gradient and TER for plots under permanent vegetation may be due to the fact that erosion under low runoffconditions is limited by the amount of material that is dislodged by raindrop impact. The latter process does not show a strong slope dependency (Torri and Poesen, 1992).
As a relationship between erosion rates and topography was only present for
farm-15
land, different strategies were employed to estimate the mean TER for farmland in comparison to other land uses based on land use dataset. Nearing’s model (Nearing, 1997) described the relationship between erosion rate and slope gradient very well on farmland (Fig. S3). As this model was extensively tested using data from the CLP and is consistent with earlier studies we used it to normalise observed erosion rates with
20
respect to slope gradient.
TER′=a ×
−1.5+ 17
1+e2.3−6.1 sinθ
Where, TER′is the slope-corrected TER for farmland (t ha−1yr−1);ais a scaling factor representing the comprehensive effect ofR (rainfall erodibility) andK (soil erodibility) on the TER. The value ofawas determined through regression analysis and equals to
25
BGD
12, 14981–15010, 2015
Moderate topsoil erosion rates
J. Zhao et al.
Title Page
Abstract Introduction
Conclusions References
Tables Figures
◭ ◮
◭ ◮
Back Close
Full Screen / Esc
Printer-friendly Version Interactive Discussion
Discussion
P
a
per
|
Discussion
P
a
per
|
Discussion
P
a
per
|
Discussion
P
a
per
|
The TER measured on farmland was also dependent on slope length (Table 1). We assumed that erosion rate was proportional to the square root of slope, which is con-sistent with earlier research (Liu et al., 2000; Wischmeier and Smith, 1978).
Finally, calculation of the TER needs to account for the presence of terraces. First, we calculated the probability of a slope being terraced using an empirical relationship
5
between slope gradient and the proportion of the farmland that was terraced. Next, we compiled available literature data to deriveTE, the average erosion reduction factor that is obtained by installing terraces. If a pixel is under farmland, the average TER for this pixel can then be calculated as follows:
TER=TER′×
" λ
T 22
0.5
×TP×TE+(1−TP)×
λ
S 22
0.5#
(1)
10
where, TP is probability of terracing for the slope class to which the pixel belongs (Fig. S1), whileλT andλSare the average slope lengths for terraced and non-terraced farmland for this particular slope class (Fig. S2) and TE is the terrace efficiency (see below).
Terrace efficiency (TE). We found 16 erosion plot studies evaluating the effect of
15
terracing on erosion rates on the CLP using a paired sample design (i.e. topography, crops and soil conservation measures other than terraces were similar on the terraced and non-terraced plot) (Table S3). The terrace efficiency factor,TE, was calculated as a the ratio between the erosion rate observed on the terraced and non-terraced plots. The meanTE, weighted by the number of plot years, was 0.20±0.19 indicating that TER
20
on terraced farmland were, on average, only 20 % of that occurring on non-terraced farmland.
We did find a significant relationship between rainfall erosivity on the one hand and normalised erosion rates on farmland on the other hand but the explained variance was very small (3 %). Therefore we did not include rainfall erosivity in our model. The
25
BGD
12, 14981–15010, 2015
Moderate topsoil erosion rates
J. Zhao et al.
Title Page
Abstract Introduction
Conclusions References
Tables Figures
◭ ◮
◭ ◮
Back Close
Full Screen / Esc
Printer-friendly Version Interactive Discussion
Discussion
P
a
per
|
Discussion
P
a
per
|
Discussion
P
a
per
|
Discussion
P
a
per
|
conditions (with lower rainfall erosivity) soil cover by vegetation will also be lower: a low erosivity is then compensated for by a high cover factor.
As we did not find any relationship between topography and erosion rates on land under permanent vegetation (Table 1), we estimated erosion rates for pixels under these land uses by simply taking the average erosion rate observed on erosion plots
5
with the same land use (Fig. S4).
2.3 Estimation of total sediment mobilisation
The total amount of sediment mobilised by topsoil erosion under 2005 conditions was estimated by aggregating the topsoil erosion amount estimated for individual pixels. Sediment mobilisation prior to the extensive implementation of conservation measures
10
(around 1950) was estimated assuming that land use did not change between 1950 and 1980. Given the fact that during this period the emphasis of government efforts was clearly on the increase of agricultural production this assumption is reasonable. Furthermore we assumed that no terracing was carried out prior to 1950. This assump-tion is a simplificaassump-tion: it may be expected that some measures to protect the cropland
15
were in place prior to 1950. However, the vast majority of the terraces present on the CLP have been constructed after 1950 when terrace implementation was stimulated through massive government programs (Chen et al., 2007).
2.4 The contribution of gully erosion
The radioactive nuclide 137Cs is a soil erosion tracer that is in principle only present
20
in the topsoil to which it was delivered by rainfall and dry deposition after the open air nuclear experiments between 1950 and 1970 (Zhang et al., 2007). Assuming that, in a catchment where gullying does occur, the137Cs concentration in the topsoil of the non-gullied areas, in the sediments coming from gullied areas, and in sediment being deposited in colluvial/alluvial environments downstream of the erosion areas is known,
BGD
12, 14981–15010, 2015
Moderate topsoil erosion rates
J. Zhao et al.
Title Page
Abstract Introduction
Conclusions References
Tables Figures
◭ ◮
◭ ◮
Back Close
Full Screen / Esc
Printer-friendly Version Interactive Discussion
Discussion
P
a
per
|
Discussion
P
a
per
|
Discussion
P
a
per
|
Discussion
P
a
per
|
the contribution of gully erosion to total catchment erosion can be estimated as:
SCg=
Csh−Csd Csh−Csg
where, SCg is the sediment contribution of gully areas (%) and Csg, Csh and Csd are the average Cs-137 concentrations in sediments from gullied, non-gullied and deposi-tional areas (Bq kg−1), respectively.
5
We found 11 studies on relatively small catchments for which such data were avail-able (Tavail-able S2). Using these data as well as the relative areal extent of gullies (CAg, %) in each of these catchments we were therefore able to calculate the ratio between the erosion rate on hilly arable land and the gully erosion rate (Eg/h) for each catchment.
Eg/h=
SCg(1−CAg)
CAg(1−SCg)
10
In order to estimate the contribution of gullies to total sediment mobilisation on the CLP we first calculated the average TER for hilly areas (Eh, t ha−
1
yr−1). The proportion of gully areas for the whole CLP (Ag) was calculated based on the information obtained from the GEps. Finally, the total amount of sediment mobilised in these gullied areas was estimated as:
15
SYg=Eg/h×Eh×Ag×TAclp (2)
where, SYgis the amount of sediment mobilised by gully; TAclpis the total areas of CLP (620 000 km2).
2.5 The contribution of landslides
To the best of our knowledge, no detailed landslide inventory of the CLP exists. We
20
BGD
12, 14981–15010, 2015
Moderate topsoil erosion rates
J. Zhao et al.
Title Page
Abstract Introduction
Conclusions References
Tables Figures
◭ ◮
◭ ◮
Back Close
Full Screen / Esc
Printer-friendly Version Interactive Discussion
Discussion
P
a
per
|
Discussion
P
a
per
|
Discussion
P
a
per
|
Discussion
P
a
per
|
a conservative estimate of mean volume of a major landslide (3±2.14×10⁶m3) (Zhang and Wang, 2007) to make a preliminary estimate of the mean sediment flux that is delivered to the river network by landslides. It is evident that the uncertainty on our estimate is large and that landslide events will be highly episodic, triggered by ma-jor rainfall events and/or earthquakes but the necessary data to assess this temporal
5
variability are at present not available.
3 Results and discussion
3.1 Topsoil erosion on the CLP
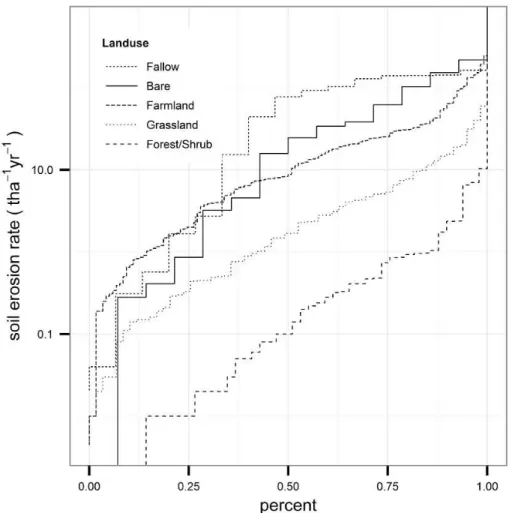
The analysis of the plot data confirmed the importance of land use/vegetation cover for topsoil erosion: the average topsoil erosion rate (TER) measured on plots with
perma-10
nent woody vegetation (shrub or forest) was 0.70±0.28 t ha−1yr−1 (n=66) while the average TER on grassland plots was 5.51±1.36 t ha−1yr−1 (n=90). The TER mea-sured under forest is considerably lower than the average TER observed on arable farmland plots (23.61±3.69 t ha−1yr−1, n=120), confirming that conversion of forest to arable land may increase the TER by up to two orders of magnitude (Vanacker et al.,
15
2007). TER on bare land plots was, on average (45.27±19.17 t ha−1yr−1,n=14), which is about twice as high as those observed on arable land (Fig. 2).
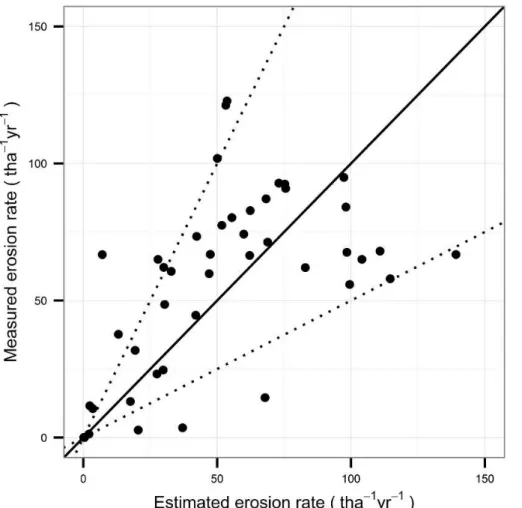
Erosion plot rates cannot be directly extrapolated to large areas: erosion plots tend to be located in areas where erosion rates are high (Cerdan et al., 2010) (Supplement 1) and have dimensions that are smaller than that of a typical field. The model we
20
developed (Eq. 1) allowed to account for variations in land use, topography (slope gradient and length) as well as for the impact of terracing on TER. Validation of the model using independent estimates of erosion rates showed that it performed well with 77 % of the observations within a 0.5–2 range of the predicted values (Fig. 3 and Supplement Methods).
BGD
12, 14981–15010, 2015
Moderate topsoil erosion rates
J. Zhao et al.
Title Page
Abstract Introduction
Conclusions References
Tables Figures
◭ ◮
◭ ◮
Back Close
Full Screen / Esc
Printer-friendly Version Interactive Discussion
Discussion
P
a
per
|
Discussion
P
a
per
|
Discussion
P
a
per
|
Discussion
P
a
per
|
The estimated average TER in 2005 was 9.74±3.12 t ha−1yr−1for farmland; 3.78± 1.63 t ha−1yr−1for grassland and 0.53±0.15 t ha−1yr−1for land with permanent woody vegetation. The calculated overall average TER was 5.41±1.35 t ha−1yr−1for the whole CLP and total amount of sediment mobilised by topsoil erosion was estimated at 0.30±0.08 Gt, with 0.198±0.062 Gt coming from arable land and 0.098±0.043 Gt
com-5
ing from grassland. About 57.0±11.2 % of the total amount of topsoil that is lost due to erosion comes from non-terraced arable land which occupies 61.30 % of the total area of arable land. Terraced arable land contributes ca. 8.8±3.5 %; ca. 32.6±11.6 % comes from grassland and the reminder 1.6±0.7 % comes from land with permanent vegetation (Fig. 1).
10
Our estimates of topsoil erosion are 3 to 9 times lower than the estimates reported in recent studies (Table 2). This discrepancy far exceeds the uncertainties associated with our estimates. Several reasons explain why previous estimates of topsoil erosion were too high: most notably, soil erodibility is often strongly overestimated (Table S1 and Supplement Discussion) and the procedures to estimate slope length at the landscape
15
scale tend to ignore the effects of landscape structure and field borders in particular (Supplement Discussion).
3.2 Gully erosion and landslides
We estimated the relative contribution of gullies to sediment mobilisation in 7 agri-cultural catchments and used the data from 4 other studies reporting the
contribu-20
tion of gully erosion using the 137Cs content of sediments in gully, inter-gully areas and reservoirs and retention structures downstream of small, gullied catchments (Ta-ble S2). In these catchments gully erosion mobilised, on average 2.60±1.48 times more sediment than sheet and rill erosion, confirming the importance of gullies as a sediment source (Table S2). Based on our GEps, we estimated that ca. 13 % of
25
BGD
12, 14981–15010, 2015
Moderate topsoil erosion rates
J. Zhao et al.
Title Page
Abstract Introduction
Conclusions References
Tables Figures
◭ ◮
◭ ◮
Back Close
Full Screen / Esc
Printer-friendly Version Interactive Discussion
Discussion
P
a
per
|
Discussion
P
a
per
|
Discussion
P
a
per
|
Discussion
P
a
per
|
10.78±15.27 t ha−1yr−1. Combining all these values using Eq. (2), we estimated that gullies mobilised 0.23±0.28 Gt yr−1of sediments under current conditions (Sect. 2.4). Landsliding on the CLP may be triggered by both extreme rainfall and seismic events: more than 40 000 landslides have been identified (Derbyshire et al., 2000). Derbyshire (2000) reports that ca. 1000 “large” landslides occurred on the CLP between 1965 and
5
1979. Assuming an average volume of 3 million m3 for a large landslide, the volume of sediment that is annually mobilised by landslides can be conservatively estimated as ca. 0.28±0.23 Gt (Sect. 2.5). This estimate does not include the contribution of seismic events such as theHaiyuanearthquake (1928), which generated over 1000 landslides on its own (W. Li et al., 2015).
10
3.3 The impact of conservation programs
Under pre-1950 conditions, the average estimated TER on farmland was 19.3± 6.18 t ha−1yr−1, resulting in a total amount of topsoil mobilization of 0.40
±0.13 Gt. An additional 0.10±0.04 Gt was mobilised on grassland and land under permanent vege-tation, resulting in an overall total of 0.50±0.13 Gt. Gully erosion was also higher
be-15
fore soil conservation programs were started: concurrently with terracing, check dams were installed on gully floors, thereby stabilising their base level (Xiang-zhou et al., 2004). We assumed that the decrease in gully erosion rates was proportional to the decrease in TER. The impact of conservation measures on landslides is ambiguous. While the reshaping of slopes by terracing may in principle increase their stability,
ter-20
racing also facilitates irrigation and may therefore increase the landslide risk (Meng and Derbyshire, 1998). At the same time, the stabilisation of the base level by check dams reduced the risk of slope failure. We therefore assumed that the landslide risk was not affected by conservation programs.
The effect of land use changes induced by regreening programs was still small in
25
com-BGD
12, 14981–15010, 2015
Moderate topsoil erosion rates
J. Zhao et al.
Title Page
Abstract Introduction
Conclusions References
Tables Figures
◭ ◮
◭ ◮
Back Close
Full Screen / Esc
Printer-friendly Version Interactive Discussion
Discussion
P
a
per
|
Discussion
P
a
per
|
Discussion
P
a
per
|
Discussion
P
a
per
|
parison to 1980. As the areas covered by these conservation programs continues to increase, their effect on erosion reduction will also increase (Fu et al., 2011).
The average sediment export from the CLP measured at Huayunkou station (see Fig. 1), which is located on the Yellow River just downstream of the CLP was, on aver-age, ca. 1.37 Gt yr−1between 1950 and 1975 (Ministry of Water Resources of China,
5
2011). Other long-term estimates confirm that this value is realistic, at least for the last centuries, for which an average yield of ca. 1.1 Gt yr−1 was reported (Saito et al., 2001). However, sediment yields have decreased significantly in the last decades and current sediment yield (2000–2010) is, on average 0.10 Gt yr−1
(Ministry of Water Re-sources of China, 2011). This sharp reduction is mainly due to increased sediment
10
trapping. Recent estimates place the amount of sediment trapped annually in reser-voirs on the CLP at 0.55 Gt, while ca. 0.59 Gt yr−1
is trapped in reservoirs in the whole Yellow River Basin: the annual retention rate strongly increased since ca. 1970 as sev-eral major reservoirs on the Yellow River came into operation (Ran et al., 2013a). An additional 0.11 Gt yr−1 is estimated to be retained by smaller conservation structures
15
(check dams) (Jiao et al., 2014; Ran et al., 2004).
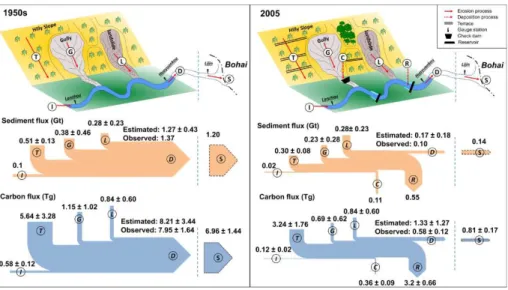
Combining all data sediment budgets can be constructed for the CLP under current conditions (2005) and for the pre-conservation period (1950) (Fig. 4). Comparing the observed average sediment yield with the sediment yield calculated by summing all sediment inputs and sinks shows good agreement both for 1950 and 2005, confirming
20
that our estimates are indeed of the correct order of magnitude (Fig. 4). Clearly, sed-iment dynamics have dramatically changed since 1950. Not only have erosion rates been significantly reduced, mainly as a result of terracing and check dam construction, but eroded sediments are now mostly stored within the CLP rather than exported to the BohaiSea, as was the case before 1950.
25
3.4 The magnitude of the erosion-induced carbon sink
BGD
12, 14981–15010, 2015
Moderate topsoil erosion rates
J. Zhao et al.
Title Page
Abstract Introduction
Conclusions References
Tables Figures
◭ ◮
◭ ◮
Back Close
Full Screen / Esc
Printer-friendly Version Interactive Discussion
Discussion
P
a
per
|
Discussion
P
a
per
|
Discussion
P
a
per
|
Discussion
P
a
per
|
under different land use (Liu et al., 2011), we estimated that, at present, ca. 3.24± 1.76 Tg yr−1 of SOC are mobilised by topsoil erosion. Sediments from gullied areas contain far less SOC than agricultural topsoil (ca. 3±0.05 g kg−1) (Han et al., 2010), resulting in total SOC mobilisation of ca. 0.69±0.62 Tg yr−1. Landslides operate over depth scales similar to those of gullies: assuming that landslide sediments also contain
5
ca. 3±0.05 g kg−1of SOC, the contribution of landsliding to SOC mobilisation may be conservatively estimated at 0.84±0.60 Tg yr−1. This results in an overall total of ca. 4.77±1.96 Tg yr−1 of SOC under current conditions. Before 1950, when erosion was more intense, 7.63±3.52 Tg yr−1 of SOC was mobilised. As is the case for erosion rates, our estimates of SOC mobilisation (and hence of the maximum magnitude of the
10
SOC sink) are much lower than other, recently published estimates (Ran et al., 2014). The moderate losses of topsoil constrain the maximum magnitude of the erosion-induced carbon sink, which is at present limited to 4.77±1.96 Tg C. The amount of SOC that was mobilised by erosion, and therefore the potential magnitude of the erosion-induced carbon sink was significantly higher before conservation programs started
15
(7.63±3.52 Tg C, Fig. 4). Assessing the magnitude of the current and past erosion-induced carbon sink more precisely requires an assessment of the fate of the SOC mo-bilised by erosion as well as of the rate at which this carbon is dynamically replaced on arable land. Experimental data suggest that dynamic replacement and carbon export may be in near-equilibrium on eroding farmland but the question remains how much
20
of the eroded carbon is preserved in depositional environments. (Y. Li et al., 2015). Nowadays, nearly all sediments and associated SOC mobilised by different erosion processes on the CLP are stored on land (Fig. 4). Studies of colluvial environments on the CLP suggest that a significant amount of the SOC buried by deposition is preserved in such depositional environments (Y. Li et al., 2015). Similarly, reservoirs sediments
25
BGD
12, 14981–15010, 2015
Moderate topsoil erosion rates
J. Zhao et al.
Title Page
Abstract Introduction
Conclusions References
Tables Figures
◭ ◮
◭ ◮
Back Close
Full Screen / Esc
Printer-friendly Version Interactive Discussion
Discussion
P
a
per
|
Discussion
P
a
per
|
Discussion
P
a
per
|
Discussion
P
a
per
|
construction. As most of these depositional environments came only recently into be-ing, their carbon burial efficiency will still be relatively high (Z. Wang et al., 2012, 2015) and SOC respiration at depositional sites will not exceed 50 % of the total amount of SOC mobilised, placing a lower bound of ca. 2.38±0.98 Tg on the magnitude of the current erosion-induced carbon sink. Prior to 1950 the geomorphological cascade was
5
more or less in equilibrium, i.e. the amount of sediment mobilised on the CLP approxi-mately equalled the amount of sediment exported to theBohaiSea (Miao et al., 2010). The lower bound of the erosion induced carbon sink will then be equal to the amount of carbon exported to theBohaiSea and buried in coastal and distal marine sediments. The OC content of Yellow river sediments is on average ca. 0.58±0.12 % (Ran et al.,
10
2013b; X. Wang et al., 2012; Zhang et al., 2013). As the total sediment export by the Yellow River to theBohaiSea was 1.2 Gt yr−1, this places the lower bound of the carbon sink prior to conservation measures at ca. 6.96±1.44 Tg of C. This suggests that not only the geomorphological but also the carbon cascade was at near-equilibrium prior to 1950, with the Yellow River exporting an amount of organic carbon similar to the
15
amount delivered to the river systems by hillslope processes.
The implementation of soil conservation programs has reduced the strength of the erosion-induced carbon sink on the CLP by 4.58±1.74 Tg. Estimates of the beneficial effects of the Grain for Green program largely surpass this value (Feng et al., 2013; Persson et al., 2013).
20
3.5 Nutrient losses and agricultural productivity reduction by soil erosion
We estimate that in 1950 annual nitrogen (N) and phosphorous (P) losses amounted to ca. 0.38 and 0.34 Tg respectively. Conservation efforts reduced these losses to 0.22 and 0.20 Tg respectively (Table 3). Currently, these losses are less than 20 % of the fer-tilizer input (Table 3). However, this is only because ferfer-tilizer inputs have risen
dramat-25
BGD
12, 14981–15010, 2015
Moderate topsoil erosion rates
J. Zhao et al.
Title Page
Abstract Introduction
Conclusions References
Tables Figures
◭ ◮
◭ ◮
Back Close
Full Screen / Esc
Printer-friendly Version Interactive Discussion
Discussion
P
a
per
|
Discussion
P
a
per
|
Discussion
P
a
per
|
Discussion
P
a
per
|
unsustainable. The reduction of relative nutrient losses is mainly due to the increase of nutrient inputs: the reduction of TER is relatively less important (Wang et al., 2014).
The average TER on arable land is now close to what was long considered to be an acceptable soil loss tolerance level (Jiao, 2014). While topsoil erosion at this rate may still threaten agricultural productivity, this threat would only materialize over long
5
time spans (Bakker et al., 2004; den Biggelaar et al., 2003b; Lal, 2003). In high-input agricultural systems such as the CLP, a loss of 0.1 m of soil induces an inherent pro-ductivity loss of ca. 4 % on soils with a limited water holding capacity (Bakker et al., 2004). At current erosion rates, such a loss would take, on average, ca. 100–130 years on the arable land of the CLP. Productivity losses on deep soils are lower, which
ex-10
plains why very significant gains in productivity could be realized on the CLP over the last 50 years, despite the heavily degraded status of some of the soils (Bakker et al., 2004). There is a large spatial variation of TER within the CLP: even under current conditions, TER exceed 10 t ha−1
yr−1
on 40 % of the arable land calling for targeted conservation efforts to reduce local TER even further.
15
4 Conclusions
The mechanisms of many processes modifying the Earth’s surface are nowadays well understood. However, assessing their impact at the regional or global scale does not only depend on our level of process understanding but also on the careful extrapola-tion of the data we collect, often over relatively small areas. In this study we showed
20
that current topsoil erosion rates on the CLP are 3 to 9 times lower than previously assumed. This revision also limits the magnitude of the erosion-induced carbon sink and the impact of topsoil losses on nutrient losses and agricultural productivity. Further studies in other environments are essential to correctly assess the impact of agricultural erosion at the global scale. In such studies, temporal dynamics need to be accounted
25
BGD
12, 14981–15010, 2015
Moderate topsoil erosion rates
J. Zhao et al.
Title Page
Abstract Introduction
Conclusions References
Tables Figures
◭ ◮
◭ ◮
Back Close
Full Screen / Esc
Printer-friendly Version Interactive Discussion
Discussion
P
a
per
|
Discussion
P
a
per
|
Discussion
P
a
per
|
Discussion
P
a
per
|
on elemental cycles, but may also alter the sustainability of agricultural systems by fundamentally altering their nutrient balance.
The Supplement related to this article is available online at doi:10.5194/bgd-12-14981-2015-supplement.
Author contributions. G. Govers conceived and directed the project. J. Zhao collected the data
5
and conducted the calculation and analysis. All authors contributed to interpretation and writing.
Acknowledgements. We acknowledge the China Scholarship Council (CSC) for supporting J. Zhao’s research at KU Leuven. We thank Jiyuan Liu at the Institute of Geographical Sciences and Natural Resources Research, Chinese Academic of Sciences for his help to obtain land use dataset.
10
References
Bakker, M. M., Govers, G., and Rounsevell, M. D.: The crop productivity–erosion relationship: an analysis based on experimental work, Catena, 57, 55–76, doi:10.1016/j.catena.2003.07.002, 2004.
Blanco-Canqui, H. and Lal, R.: Soil and water conservation, in: Principles of Soil Conservation
15
and Management SE-1, Springer, Dordrecht, the Netherlands, 1–19, 2008.
Cai, Q.: Soil erosion and management on the Loess Plateau, J. Geogr. Sci., 11, 53–70, doi:10.1007/BF02837376, 2001.
Cammeraat, L. H.: A review of two strongly contrasting geomorphological systems within the context of scale, Earth Surf. Proc. Land., 27, 1201–1222, 2002.
20
Cerdan, O., Le Bissonnais, Y., Govers, G., Lecomte, V., van Oost, K., Couturier, A., King, C., and Dubreuil, N.: Scale effect on runofffrom experimental plots to catchments in agricultural areas in Normandy, J. Hydrol., 299, 4–14, doi:10.1016/j.jhydrol.2004.02.017, 2004.
Cerdan, O., Govers, G., Le Bissonnais, Y., Van Oost, K., Poesen, J., Saby, N., Gobin, A., Vacca, A., Quinton, J., Auerswald, K., Klik, A., Kwaad, F. J. P. M., Raclot, D., Ionita, I.,
Rej-25
BGD
12, 14981–15010, 2015
Moderate topsoil erosion rates
J. Zhao et al.
Title Page
Abstract Introduction
Conclusions References
Tables Figures
◭ ◮
◭ ◮
Back Close
Full Screen / Esc
Printer-friendly Version Interactive Discussion
Discussion
P
a
per
|
Discussion
P
a
per
|
Discussion
P
a
per
|
Discussion
P
a
per
|
soil erosion in Europe: a study based on erosion plot data, Geomorphology, 122, 167–177, doi:10.1016/j.geomorph.2010.06.011, 2010.
Chang, R., Fu, B., Liu, G., and Liu, S.: Soil carbon sequestration potential for “grain for green” project in Loess Plateau, China, Environ. Manage., 48, 1158–1172, doi:10.1007/s00267-011-9682-8, 2011.
5
Chen, L., Wei, W., Fu, B., and Lu, Y.: Soil and water conservation on the Loess Plateau in China: review and perspective, Prog. Phys. Geog., 31, 389–403, doi:10.1177/0309133307081290, 2007.
Den Biggelaar, C., Lal, R., Wiebe, K., and Breneman, V.: The global impact of soil erosion on productivity, I: absolute and relative erosion-induced yield losses, Adv. Agron., 81, 1–48,
10
doi:10.1016/S0065-2113(03)81001-5, 2003a.
Den Biggelaar, C., Lal, R., Wiebe, K., Eswaran, H., Breneman, V., and Reich, P.: The global impact of soil erosion on productivity, II: effects on crop yields and production over time, Adv. Agron., 81, 49–95, doi:10.1016/S0065-2113(03)81002-7, 2003b.
Deng, L., Shangguan, Z., and Li, R.: Effects of the grain-for-green program on soil erosion in
15
China, Int. J. Sediment Res., 27, 120–127, 2013.
Derbyshire, E., Meng, X., and Dijkstra, T. A.: Landslides in the Thick Loess Terrain of North-West China, John Wiley & Sons Incorporated, Chichester, 2000.
Feng, X., Fu, B., Lu, N., Zeng, Y., and Wu, B.: How ecological restoration alters ecosystem services: an analysis of carbon sequestration in China’s Loess Plateau, Sci. Rep., 3, 2846,
20
doi:10.1038/srep02846, 2013.
Fu, B., Liu, Y., Lü, Y., He, C., Zeng, Y., and Wu, B.: Assessing the soil erosion control ser-vice of ecosystems change in the Loess Plateau of China, Ecol. Complex., 8, 284–293, doi:10.1016/j.ecocom.2011.07.003, 2011.
Han, F., Hu, W., Zheng, J., Du, F., and Zhang, X.: Estimating soil organic carbon
stor-25
age and distribution in a catchment of Loess Plateau, China, Geoderma, 154, 261–266, doi:10.1016/j.geoderma.2009.10.011, 2010.
Ho, P.-T.: The loess and the origin of Chinese agriculture, Am. Hist. Rev., 75, 1–36, 1969. Jiao, J.: Countermeasures to prevent water erosion in the Loess Plateau of China, in:
Restoration and Development of the Degraded Loess Plateau, China SE-14, edited by:
30
BGD
12, 14981–15010, 2015
Moderate topsoil erosion rates
J. Zhao et al.
Title Page
Abstract Introduction
Conclusions References
Tables Figures
◭ ◮
◭ ◮
Back Close
Full Screen / Esc
Printer-friendly Version Interactive Discussion
Discussion
P
a
per
|
Discussion
P
a
per
|
Discussion
P
a
per
|
Discussion
P
a
per
|
Jiao, J., Wang, Z., Zhao, G., Wang, W., and Mu, X.: Changes in sediment discharge in a sediment-rich region of the Yellow River from 1955 to 2010: implications for further soil erosion control, J. Arid Land, 6, 540–549, doi:10.1007/s40333-014-0006-8, 2014.
Jobbágy, E. G. and Jackson, R. B.: The vertical distribution of soil organic carbon and its relation to climate and vegetation, Ecol. Appl., 10, 423–436, 2000.
5
Jobbágy, E. G. and Jackson, R. B.: The distribution of soil nutrients with depth: global patterns and the imprint of plants, Biogeochemistry, 53, 51–77, 2001.
Lal, R.: Soil erosion and the global carbon budget, Environ. Int., 29, 437–50, doi:10.1016/S0160-4120(02)00192-7, 2003.
Li, W., Huang, R., Pei, X., and Zhang, X.: Historical co-seismic landslides inventory and analysis
10
using Google Earth: a case study of 1920 M8.5 Haiyuan Earthquake, China, in: Engineering Geology for Society and Territory – Volume 2 SE-118, edited by: Lollino, G., Giordan, D., Crosta, G. B., Corominas, J., Azzam, R., Wasowski, J., and Sciarra, N., Springer International Publishing, Cham, 709–712, 2015.
Li, X., Dodson, J., Zhou, X., Zhang, H., and Masutomoto, R.: Early cultivated wheat and
broad-15
ening of agriculture in Neolithic China, Holocene, 5, 555–560, 2007.
Li, Y., Quine, T. A., Yu, H. Q., Govers, G., Six, J., Gong, D. Z., Wang, Z., Zhang, Y. Z., and Van Oost, K.: Sustained high magnitude erosional forcing generates an organic carbon sink?: Test and implications in the Loess Plateau, China, Earth Planet. Sci. Lett., 411, 281–289, 2015.
20
Liu, B., Nearing, M., Shi, P. J., and Jia, W. Z.: Slope length effects on soil loss for steep slopes, Soil Sci. Soc. Am. J., 64, 1759–1763, 2000.
Liu, G.: Soil conservation and sustainable agriculture on the Loess Plateau: challenges and prospects, Ambio, 28, 663–668, 1999.
Liu, Z., Shao, M., and Wang, Y.: Effect of environmental factors on regional soil organic
car-25
bon stocks across the Loess Plateau region, China, Agr. Ecosyst. Environ., 142, 184–194, doi:10.1016/j.agee.2011.05.002, 2011.
Liu, Z.-P., Shao, M.-A., and Wang, Y.-Q.: Spatial patterns of soil total nitrogen and soil total phosphorus across the entire Loess Plateau region of China, Geoderma, 197, 67–78, 2013. Lowdermilk, W. C.: Conquest of the Land Through 7,000 Years, US Department of Agriculture,
30
BGD
12, 14981–15010, 2015
Moderate topsoil erosion rates
J. Zhao et al.
Title Page
Abstract Introduction
Conclusions References
Tables Figures
◭ ◮
◭ ◮
Back Close
Full Screen / Esc
Printer-friendly Version Interactive Discussion
Discussion
P
a
per
|
Discussion
P
a
per
|
Discussion
P
a
per
|
Discussion
P
a
per
|
Meng, X. and Derbyshire, E.: Landslides and their control in the Chinese Loess Plateau: models and case studies from Gansu Province, China, Geol. Soc. London, Eng. Geol. Spec. Publ., 15, 141–153, 1998.
Miao, C., Ni, J., and Borthwick, A. G. L.: Recent changes of water discharge and sediment load in the Yellow River basin, China, Prog. Phys. Geog., 34, 541–561,
5
doi:10.1177/0309133310369434, 2010.
Ministry of Water Resources of China: China River Sediment Bulletin, China Waterpower Press, Beijing, China, 2011.
Nearing, M. A.: A single, continuous function for slope steepness influence on soil loss, Soil Sci. Soc. Am. J., 61, 917–919, 1997.
10
Persson, M., Moberg, J., Ostwald, M., and Xu, J.: The Chinese Grain for Green Programme: assessing the carbon sequestered via land reform, J. Environ. Manage., 126, 142–6, doi:10.1016/j.jenvman.2013.02.045, 2013.
Pimentel, D., Harvey, C., Resosudarmo, P., Sinclair, K., Kurz, D., McNair, M., Crist, S., Shpritz, L., Fitton, L., Saffouri, R., and Blair, R.: Environmental and
eco-15
nomic costs of soil erosion and conservation benefits, Science, 267, 1117–1123, doi:10.1126/science.267.5201.1117, 1995.
Quinton, J. N., Govers, G., Van Oost, K., and Bardgett, R. D.: The impact of agricultural soil erosion on biogeochemical cycling, Nat. Geosci., 3, 311–314, doi:10.1038/ngeo838, 2010. Ran, D., Luo, Q., and Wang, H.: Effect of soil-retaining dams on flood and sediment reduction
20
in middle reaches of yellow river, J. Hydraul. Eng.-ASCE, 35, 7–13, 2004.
Ran, L., Lu, X. X., Xin, Z., and Yang, X.: Cumulative sediment trapping by reservoirs in large river basins: a case study of the Yellow River basin, Global Planet Change, 100, 308–319, doi:10.1016/j.gloplacha.2012.11.001, 2013a.
Ran, L., Lu, X. X., Sun, H., Han, J., Li, R., and Zhang, J.: Spatial and seasonal variability of
25
organic carbon transport in the Yellow River, China, J. Hydrol., 498, 76–88, 2013b.
Ran, L., Lu, X. X., and Xin, Z.: Erosion-induced massive organic carbon burial and carbon emission in the Yellow River basin, China, Biogeosciences, 11, 945–959, doi:10.5194/bg-11-945-2014, 2014.
Renard, K. G., Foster, G. R., Weesies, G. A., McCool, D. K., and Yoder, D. C.: Predicting soil
ero-30
BGD
12, 14981–15010, 2015
Moderate topsoil erosion rates
J. Zhao et al.
Title Page
Abstract Introduction
Conclusions References
Tables Figures
◭ ◮
◭ ◮
Back Close
Full Screen / Esc
Printer-friendly Version Interactive Discussion
Discussion
P
a
per
|
Discussion
P
a
per
|
Discussion
P
a
per
|
Discussion
P
a
per
|
Saito, Y., Yang, Z., and Hori, K.: The Huanghe (Yellow River) and Changjiang (Yangtze River) deltas: a review on their characteristics, evolution and sediment discharge during the Holocene, Geomorphology, 41, 219–231, doi:10.1016/S0169-555X(01)00118-0, 2001. Schnitzer, S., Seitz, F., Eicker, A., Guntner, A., Wattenbach, M., and Menzel, A.: Estimation of
soil loss by water erosion in the Chinese Loess Plateau using Universal Soil Loss Equation
5
and GRACE, Geophys. J. Int., 193, 1283–1290, doi:10.1093/gji/ggt023, 2013.
Shi, H. and Shao, M.: Soil and water loss from the Loess Plateau in China, J. Arid Environ., 45, 9–20, doi:10.1006/jare.1999.0618, 2000.
Shi, S. and Han, P.: Estimating the soil carbon sequestration potential of China’s Grain for Green Project, Global Biogeochem. Cy., 28, 1279–1294, 2014.
10
Sun, W., Shao, Q., and Liu, J.: Soil erosion and its response to the changes of precipitation and vegetation cover on the Loess Plateau, J. Geogr. Sci., 23, 1091–1106, doi:10.1007/s11442-013-1065-z, 2013.
Tang, K., Xiong, G., Liang, J., Jing, K., Zhang, S., Chen, Y., and Li, S.: Varieties of Erosion and RunoffSediment in Yellow River Basin, Chinese Sciences and Technique Press, Beijing,
15
1993.
Torri, D. and Poesen, J.: The effect of soil surface slope on raindrop detachment, Catena, 19, 561–578, 1992.
Trimble, S. W. and Crosson, P.: US soil erosion rates: myth and reality, Science, 289, 248–250, doi:10.1126/science.289.5477.248, 2000.
20
Tsunekawa, A., Liu, G., Yamanaka, N., and Du, S.: Restoration and Development of the De-graded Loess Plateau, China, edited by: Tsunekawa, A., Liu, G., Yamanaka, N., and Du, S., Springer, Tokyo, Japan, 2014.
Vanacker, V., von Blanckenburg, F., Govers, G., Molina, A., Poesen, J., Deckers, J., and Ku-bik, P.: Restoring dense vegetation can slow mountain erosion to near natural benchmark
25
levels, Geology, 35, 303–306, 2007.
Van Oost, K., Quine, T. A., Govers, G., De Gryze, S., Six, J., Harden, J. W., Ritchie, J. C., McCarty, G. W., Heckrath, G., Kosmas, C., Giraldez, J. V., da Silva, J. R. M., and Merckx, R.: The impact of agricultural soil erosion on the global carbon cycle., Science, 318, 626–629, doi:10.1126/science.1145724, 2007.
30
BGD
12, 14981–15010, 2015
Moderate topsoil erosion rates
J. Zhao et al.
Title Page
Abstract Introduction
Conclusions References
Tables Figures
◭ ◮
◭ ◮
Back Close
Full Screen / Esc
Printer-friendly Version Interactive Discussion
Discussion
P
a
per
|
Discussion
P
a
per
|
Discussion
P
a
per
|
Discussion
P
a
per
|
Wang, X., Tong, Y., Gao, Y., Gao, P., Liu, F., Zhao, Z., and Pang, Y.: Spatial and temporal variations of crop fertilization and soil fertility in the Loess Plateau in China from the 1970s to the 2000s, PLoS One, 9, e112273, doi:10.1371/journal.pone.0112273, 2014.
Wang, Z., Liu, G.-B., Xu, M., Zhang, J., Wang, Y., and Tang, L.: Temporal and spatial variations in soil organic carbon sequestration following revegetation in the hilly Loess Plateau, China,
5
Catena, 99, 26–33, doi:10.1016/j.catena.2012.07.003, 2012.
Wang, Z., Van Oost, K., and Govers, G.: Predicting the long-term fate of buried organic carbon in colluvial soils, Global Biogeochem. Cy., 29, 65–79, 2015.
Wischmeier, W. H. and Smith, D. D.: Predicting Rainfall Erosion Losses – a Guide to Conser-vation Planning, Washington, US Department of Agriculture, 1978.
10
Xiang-zhou, X., Hong-wu, Z., and Ouyang, Z.: Development of check-dam systems in gullies on the Loess Plateau, China, Environ. Sci. Policy, 7, 79–86, doi:10.1016/j.envsci.2003.12.002, 2004.
Zhang, D. and Wang, G.: Study of the 1920 Haiyuan earthquake-induced landslides in loess (China), Eng. Geol., 94, 76–88, doi:10.1016/j.enggeo.2007.07.007, 2007.
15
Zhang, K., Li, S., Peng, W., and Yu, B.: Erodibility of agricultural soils on the Loess Plateau of China, Soil Tillage Res., 76, 157–165, doi:10.1016/j.still.2003.09.007, 2004.
Zhang, K., Dang, H., Tan, S., Cheng, X., and Zhang, Q.: Change in Soil Organic Carbon Fol-lowing the “Grain-For-Green” Programme in China, L. Degard. Dev., 21, 13–23, 2010. Zhang, L. J., Wang, L., Cai, W.-J., Liu, D. M., and Yu, Z. G.: Impact of human activities on
or-20
ganic carbon transport in the Yellow River, Biogeosciences, 10, 2513–2524, doi:10.5194/bg-10-2513-2013, 2013.
Zhang, X., Wen, Z., Feng, M., Yang, Q., and Zheng, J.: Application of 137Cs fingerprinting tech-nique to interpreting sediment production records from reservoir deposits in a small catch-ment of the Hilly Loess Plateau, China, Sci. China Ser. D, 50, 254–260,
doi:10.1007/s11430-25
007-2013-5, 2007.
BGD
12, 14981–15010, 2015
Moderate topsoil erosion rates
J. Zhao et al.
Title Page
Abstract Introduction
Conclusions References
Tables Figures
◭ ◮
◭ ◮
Back Close
Full Screen / Esc
Printer-friendly Version Interactive Discussion
Discussion
P
a
per
|
Discussion
P
a
per
|
Discussion
P
a
per
|
Discussion
P
a
per
|
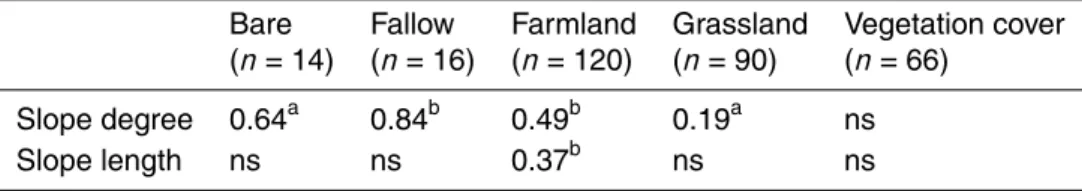
Table 1.Correlation (Pearsonr2) between topsoil erosion rate and topography (slope gradient and slope length) under different land uses: no significant relationships were found for plots with a permanent vegetation cover. The effect of slope is significant on grassland but this is due to high values observed on slopes exceeding 25◦(Fig. S4), for which few data is available: no
effect is present for lower slope gradients.
Bare Fallow Farmland Grassland Vegetation cover (n=14) (n=16) (n=120) (n=90) (n=66)
Slope degree 0.64a 0.84b 0.49b 0.19a ns Slope length ns ns 0.37b ns ns
a
BGD
12, 14981–15010, 2015
Moderate topsoil erosion rates
J. Zhao et al.
Title Page
Abstract Introduction
Conclusions References
Tables Figures
◭ ◮
◭ ◮
Back Close
Full Screen / Esc
Printer-friendly Version Interactive Discussion
Discussion
P
a
per
|
Discussion
P
a
per
|
Discussion
P
a
per
|
Discussion
P
a
per
|
Table 2.Previous estimates of total sediment yield (Gt) and average TER (t ha−1
yr−1
) in CLP.
Reference Areas(km−2
) Total sediment Average TER Method
Fu et al. (2011) 620 000 1.51 23.99 RUSLE
Sun et al. (2013) 620 000 0.95 15.20 RUSLE
Schnitzer et al. (2013)–RUSLE1 900 000 4.32 48.00 RUSLE
Schnitzer et al. (2013)–RUSLE2 900 000 1.45 16.11 RUSLE
Ran et al. (2014) 750 000 2.2 29.00 Literature review
BGD
12, 14981–15010, 2015
Moderate topsoil erosion rates
J. Zhao et al.
Title Page
Abstract Introduction
Conclusions References
Tables Figures
◭ ◮
◭ ◮
Back Close
Full Screen / Esc
Printer-friendly Version Interactive Discussion
Discussion
P
a
per
|
Discussion
P
a
per
|
Discussion
P
a
per
|
Discussion
P
a
per
|
Table 3.Comparing of fertilizer inputs (N and P) and losses due to topsoil erosion (Tg) in 1980 and 2000.
Nutrient Year Input(Tg)a Erosion(Tg)b loss ratio N 1980 0.70 0.38 53.66 %
2000 2.74 0.22 8.00 % P 1980 0.39 0.34 87.64 %
2000 1.28 0.20 15.37 %
aNutrients inputs were estimated by multiplying fertilizer input per areas
(kg ha−1) (Wang et al., 2014) with the total cropland areas (ha).
bNutrients erosion were estimated based on the amount of sediment and
BGD
12, 14981–15010, 2015
Moderate topsoil erosion rates
J. Zhao et al.
Title Page
Abstract Introduction
Conclusions References
Tables Figures
◭ ◮
◭ ◮
Back Close
Full Screen / Esc
Printer-friendly Version Interactive Discussion
Discussion
P
a
per
|
Discussion
P
a
per
|
Discussion
P
a
per
|
Discussion
P
a
per
|