Geographia
Napocensis
Anul II, nr.1/2008
THE MOTRU MINING BASIN – GIS APPLICATION ON SHEET EROSION
Anghel TITU1, Bilaşco ŞTEFAN2 1
Universitatea Babeş-Bolyai, Facultatea de Geografie, str. Clinicilor nr. 5-7, Cluj-Napoca, România.
2
Academia Română, Filiala Cluj, Colectivul de Geografie, str. Republicii nr.9, Cluj-Napoca, România.
ABSTRACT.- The Motru Mining Basin – GIS Application on Sheet Erosion. The activation of the sheet erosion has important negative effects upon the soil profile. The anticipation of this geomorphologic process is important for taking some measures for protecting the susceptible areas. Within our study, we will carry out a quantitative estimation of the soil losses in the Motru Mining Basin, caused by the activation of the sheet erosion mechanism. We will apply the classic methodology proposed by the ROMSEM model of the USLE type by using the GIS technology
1. Introduction
Soil erosion is a complex geomorphologic process, slightly visible, but with a great spatial spreading. The mechanism of the erosional process is active especially during the rains with torrential character. The negative effects induced by the activation of this geomorphologic process (the removal of the superior segment present in the soil profile) are immediately perceived and they manifest themselves through the rarefaction of the vegetal cover, the appearance of some spontaneous species of plants characteristic for the degraded soils, the generation of a specific erosion micromorphology (fine accumulations of eroded material, small sheets of mobilized soil, small rills and ditches that can culminate with the creation of a bad-land-type landscape etc.) etc.
Geographia
Napocensis
Anul II, nr.1/2008
the effects of the sheet erosion (the multi-annual specific soil loss per homogenous land unit, the weighted average soil loss, the thickness of the washed soil layer, the admissible erosion, the effluent erosion, etc.) and indicators for estimating the effects of the gully erosion(Dârja, 2000).Within our study, we will carry out a quantitative estimation of the soil losses caused by the activation of the sheet erosion mechanism. Among the favouring factors, declivity (slope and the length of the slope), the meteorological and climatic conditions from the respective area, the physical characteristics of the substratum, the characteristics of the vegetal cover, the activity of the anthropic factor etc.
The geographical methodology of quantitative estimation of the risk related to the destruction of the edaphic cover through erosional processes is borrowed from the soil science domain. The calculation of the eroded soil is done by applying the empirical mathematical models based on computerized processing of the database (geodatabase). The practical utility of the computerized applications within the deterministic models for assessing the risk of sheet erosion activation is motivated by the rapidity of the operations, the precision of the results, and their spatial distribution.
In the last seven decades, several empirical mathematical relations, destined to approach the problematic of sheet erosion, have been elaborated.
Universal Soil Loss Equation (U.S.L.E.), as it was called in the USA, has the most frequently used contemporary calculus methodology. This mathematical equation appeared as an answer to the necessities from agriculture related to the assessment of the average soil losses due to cultivation. Afterwards, the utility of this model was extended over the erosion of the lands with other practical uses. We mention that in the areas where concentrated flows of the surface water take place, the greatest quantitative soil losses appear, these being always greater than the ones estimated through the U.S.L.E. The utility of this calculus model is argued by the fact that it reflects the actual increases in erosion and indicates, with a good precision, the areas with ravination potential.
2. History of soil loss equations.
Although it does not represent the main approach of this study, the contradictory information from the Romanian literature as regards the history of the U.S.L.E. made us pay a supplementary attention to this problem.
Geographia
Napocensis
Anul II, nr.1/2008
tackled the problem of soil erosion by using the experimental runoff plots. The first applications were developed in the Corn Belt region. Later on, between 1940 and 1960, the methodology regarding the estimation of the soil losses centred especially on the concept of “the slope-practice method”. Thus, in 1940, R.W. Zingg, established an operable mathematical relation, using the length and the slope steepness as the main calculus factors (Zingg, 1940). A year later, Dwight Smith improved this equation by adding factors such as the type of the agricultural crops (land use) and the antierosional methods carried out in the area. The American scientist, Dwight Smith, also introduced the notion of „specific soil loss limit”, having in view the development of a graphical methodology for determining the preservation stage of the edaphic cover (Smith, 1941, Smith, Whitt, 1947, Wischemeier, Smith, 1978). In 1947, G. H. Browning and contributors published a mathematical relation in which the soil losses were calculated depending on several physical factors that influence the erosion: the type of soil, the quantity of organic matter of the soil, the state of the vegetal cover, the manner of working the soil, the slope steepness and length. These factors were ordered in tables for simplifying the manner in which the equation is applied (Browning et. al. 1947, Wischemeir, Smith, 1978, Dârja,, 2000,). A solution with graphic character, regarding the soil losses resulted from the activation of the sheet erosion, was published in 1952 and was used especially in the north eastern part of the USA (Lloyd, Eley, 1952, Wischemeier, Smith, 1978).Geographia
Napocensis
Anul II, nr.1/2008
Resources Conservation Service. The model has evolved in time and its applications have been improved. Thus, the study Agriculture Handbook No.537, published in 1978 by the same researchers, certifies the fact that the U.S.L.E. model represented the first methodological solution used at the end of the 70’s and the beginning of the 80’s in the USA.The revision of the U.S.L.E. model was made on the basis of the previously-gained experience and a new model called R.U.S.L.E. (Revised Universal Soil Loss Equation) asserted itself. This model uses the same empirical principles as the U.S.L.E. model, but includes improvements such as the one regarding the integration of the influence of the slope concavity or convexity profile by using the segmentation of the irregular slopes. K.G. Renard’s researche, published in 1985, brought an important contribution in the creation of the R.U.S.L.E model.In 1995, R. Loch and K.G.Evansalso introduced modifications in the U.S.L.E. model (Mitasova, Mitas,1999). As a result of the studies made by the two researchers, the erodibility factor was corrected depending on the density of the sediments. R. Loch (1996) interfered again in the R.U.S.L.E. equation by modifying the vegetation factor and the applied agrotechnical method. The resulted model of calculus has a greater precision, being one of the models with concentrated parameters.
By using the revised model called R.U.S.L.E., the influence of each erosion factor is analysed. Its calibration was made by using the Anglo-Saxon measure units, thus, becoming unusable in Europe. The EUROSEM Model (European Soil Erosion Model) was elaborated in 1992 by the European researchers co-ordinated by R.P.C. Morgan (Cranfield University, United Kindom) and appeared as a response to the necessity of adapting the American models to the European conditions.
The recent RUSLE and USLE methodology requires the use of the GIS techniques (Mitasova, Mitas, 1999; Mitasova et al., 2001, Barton, Sarjoughian, 2005).
3. Romanian models of assessing the sheet erosion.
In Romania, the researches regarding the soil erosion started from the elements of the erosion universal equation. Being the best-known and often-used model of assessing the sheet erosion, U.S.L.E. was adapted to the conditions from Romania by a team of researchers working at the Institute of Pedology and Agrochemical Studies from Bucharest.
Geographia
Napocensis
Anul II, nr.1/2008
assessed the effect of the erosion factors, excepting the pluvial agressiveness, the calibration being made on the basis of the data regarding the erosion rate obtained with the help of the runoff plots from the Câmpia Turzii Research Station. A second variant of the model was published in 1973 and kept the structure of the Wischemeier-Smith model from 1965. In the formula of this equation, the pluvial agressiveness factor was also introduced, the calibration being made on the basis of the data obtained from several pedological research stations. In 1979, Mo oc and contributors proposed an improved variant of the equation, a variant that was called ROMSEM Model (Romanian Soil Erosion Model). The values of the factors within the mathematical relation were established within the soil preservation laboratory of I.S.C.I.F., having a specific application in the pedo-climatic conditions from Romania. In 1982, Mo oc elaborated a study for zoning the total specific erosion on agricultural lands. Another model proposed by Mo oc was published as a manuscript in 1987, within the Institute of Pedology and Agrochemical Studies from Bucharest. This model assesses the effluent erosion in small basins characterized by sheet and gully erosion (numerical and graphical methods are used).In 1999 and 2002, Mircea Mo oc proposed the continuation in using the 1979 form of the ROMSEM model (Mo oc, Sevastel,. 2002 ).
4. The characteristics of the Motru Mining Basin
The Motru Mining Basin is situated in the northwestern part of the Getic Plateau, within the framework of the Motru Piedmont, being “housed” by the Jil ului Hills (Fig. 1). The studied area is fragmented in an ensemble of long hilly ridges sculptured into monoclinal formations disposed on the northwest-southeast direction, whose altitude does not exceed 450 m. Lithology is specific to the Carpathian foreland. The petrographical formations were deposited in the geological interval Miocene – Holocene, in mainly lacustrine facies, under the form of some successions of clay, marl clay, sand clay, and sand, partially covered by Pleistocene gravel and loess-like deposits. The piedmont area was sectioned in the north-south direction by the Motru river, the primary morphology of the piedmont plateau being subsequently modified under the activity of the temporary rivers (Ploştina, Lupoaia, etc.).
Geographia
Napocensis
Anul II, nr.1/2008
southwestern part). The influence of the sub-Mediterranean climate determines heavier precipitations than usually, the highest registered values appearing in the northern part, in the vicinity of the Sub-Carpathian sector. The multi-annual average precipitation between 1961 and 2000 ranges between 602.2 mm at the Bâcleşu meteorological station (in the eastern part) and 882.5 mm at the Apa Neagr meteorological station (in the north western part).Geographia
Napocensis
Anul II, nr.1/2008
The lignite deposits from the Pliocene sedimentary deposits (lower Dacian and Romanian) are present as a productive complex composed of 17 strata (I-XVII) exploited after 1960 by underground pit mining and then, in the 70’s, by open-pit mining.5. Methodology and research methods – Application:
ROMSEM Model of U.S.L.E. type
The mathematical models of assessing the sheet erosion risk propose easy solutions for calculating the active factors in the erosional process. The produce of the factors that take part in the equation determines the estimation of the eroded soil quantity (mobilized) per hectare, throughout a year, in normal climatic conditions. The calculus structure of the sheet erosion was elaborated by applying the statistical methods of data processing obtained through direct measurements.
In the USA, the most commonly used calculus formula is the one suggested in the U.S.L.E. guide book, Agriculture Handbook No. 537 - „ Predicting rain fall erosion losses - a guide to conservation planning” (Wischemeier, Smith, 1978). The formula appears as in the following: A = R.K.L.S.C.P; where: A= the average soil loss quantity per land unit (tons/acre/year), R= the rainfall and runoff factor, K= the soil erodibility,
L= the slope-length factor, S= the slope steepness factor, C= the cover and management factor, P= the support practice factor. This formula was brought up-to-date by Renard and contributors, being called R.U.S.L.E. (Renard et. al, 1991,Mitasova şi Mitas, 1999).
Geographia
Napocensis
Anul II, nr.1/2008
Es=K.Lm.in S.C.CSwhere: Es- the quantity of sediments generated by the sheet erosion as multi-annual average (tons/ha/year), K- the rainfall-runoff erosivity factor,
Lm- the slope length factor, i- the slope steepness factor, S- the soil erodibility factor, C- the cover-management factor, CS- the supporting
practices factor.
The calculus formula of the ROMSEM model can be also written in a simplified manner as in the following: Es = A.Li, in which Li = Lm.in ;where:
A= the coefficient which comprises the influence of the other factors excepting the relief, Li = the relief factor. Following the researches, and as a result of the fact that it has a greater applicability, M. Dârja (2000)proposes the following formula: E= A.L0.3.11.5.
The assessment of the sheet erosion is classically applied to homogenous land surfaces. Thus, some land units of constant value are required for the slope of the terrain, the length of the runoff slope, the same slope exposition, the form of the homogenous surfaces having to be as regular as possible, etc. The potential of the sheet erosion for the entire perimeter is established by using the weighted average of the sheet erosion size, determined for each homogenous land unit.
Geographia
Napocensis
Anul II, nr.1/2008
facility of its use and the spatial repartition of the result.In the following, each of the factors of the ROMSEM model (Es=K.Lm.in S.C.CS) will be presented individually, taking as example the
corresponding area of the Motru Mining Basin. The data sources for the calibration of this model were the determinations with the help of the runoff plots from the following research stations: Perieni – Vaslui county, with data collected for 30 years, Aldeni – Buz u county, Bilceşti – Argeş county, Câmpia Turzii – Cluj county and Valea C lug reasc – Prahova county); the pedological and erosion studies made by I.C.P.A. Bucharest; U.S.L.E. and R.U.S.L.E. models created in the USA, as well as the pluviograms made by the National Institute of Meteorology and Hydrology (I.N.M.H.), regarding torrential rainfalls.
5. 1. The rainfall - runoff erosivity factor - K
The rainfall-runoff erosivity factor represents the soil loss in rapport with the pluvial aggressiveness (the erosion capacity exerted by the occurrence of torrential rainfalls or snowmelt). Erosivity is defined as the rapport between the quantity of eroded soil in a standard plot and the pluvial aggressiveness.
The rainfall-runoff erosivity factor K represents the Romanian adaptation of the R factor proposed by Wischmeier and Smith in 1978.
According to Nearing (1999), the relation between R factor and sheet erosion is expressed by a logistic function of the R=E I30 type; E represents
the intensity of precipitations and is expressed in mm/hour (is established by deciphering the pluviographs), while I30 represents the intensity of the
torrential nucleus developed for 30 minutes. In the USA, the R coefficient is also calculated as the average of the annual erosivity, a value divide by 100:
R = E.I30 /100. By definition, the value of EI for agiven rainfall is equal to
the result of the equation: total storm energy (E) for an intensity of maximum 30 minutes (I30) (Mo oc, Sevastel, 2002).
Geographia
Napocensis
Anul II, nr.1/2008
rainfall-runoff erosivity factor as being the produce between the quantity of rainfall and the intensity of the 15-minute-torrential nucleus: K=H I15,where: H represents the quantity of precipitation during the entire rainfall, and I15 represents the 15-minute-torrential nucleus. The duration of 15
minutes represents the time for the concentration of water within the runoff plots in order to form the rills. In the case of the runoff plots, the erosion starts if the produce H.I15 exceeds the value of 10 for the entire territory of
Romania (Mo oc, Sevastel, 2002).
The rainfall-runoff erosivity factor has different specific values on the territory of Romania, the regionalization of this coefficient being the result of the physical-geographical disparities. Thus, several zones of climatic aggressiveness have been individualized, the values of this correction coefficient having been taken from the hydrological regionalization used by the National Institute of Meteorology and Hydrology. The exact establishment (regionalization) of the rainfall-runoff erosivity value is done in conformity with the map elaborated by P. St nescu and contributors and published in 1969. For the Motru Piedmont, the climatic aggressiveness index is the one specific to zone 3, presented in the above-mentioned map: KMOTRU= 0.140.
5. 2. The slope length factor - Lm
Microrelief is one of the favouring factors, both for the activation and the maintenance of the erosional process. The morphological components with an important participation in the erosional process are the declivity of the terrain (slope steepness), the length of the inclined surfaces (slope length) and the slope form. The relation between erosion, slope steepness and slope length was established for the slopes with straight, uniform profile, erosion actually increasing in proportion to the convexity degree and decreasing in rapport with the concavity degree. The spatial variability of the relief factor is very great in comparison with the climatic aggressiveness or the pedo-lithological erodibility. In a traditional manner, the value of the slope length factor is calculated on homogenous land units (on the topographical map) and is expressed in meters. The slope length factor is a topographical coefficient (the presence of the relief in the equation), being a function of the slope and of the terrain length; the increase of the slope length determines the amplification of the total precipitations drained on the respective surface.
Geographia
Napocensis
Anul II, nr.1/2008
the LS (the slope length factor) is an empirical one, being taken over from the USDA Agriculture Handbook No. 537 (Wischemeier, 1978). In Romania, the influence of the slope steepness and the slope length upon the sheet erosion was established with the help of the runoff plots, which had lengths ranging between 20 and 40 m and values of the slope steepness ranging between 6 and 32%. Other methods were also used: the reference point method for slope lengths of about 200 m (St nescu, 1960) and soil profile method, reconstituted for the arable lands (Luca, 1971). The critical slope length, for which sheet erosion is significant in the conditions from Romania, is 10 m, while the slope steepness is 3% (the rain wash process changes into rill wash, erosion becoming sheet erosion) (Mo oc, Sevastel, 2002). The effect of slope length is estimated with the aid of a function of the Lm type, in which m=0.3 or m=0.4. The m exponent, present in the formula, is estimated to have the value of 0.4 for slope lengths of more than 100 m, while the value of 0.3 is attributed to a slope length less than 100 m. The variability of the slope length factor is presented in a table on page 45 in Mo oc and Sevastel’s study (Mo oc, Sevastel, 2002).When using GIS, the slope length factor is calculated with the aid of the Digital Elevation Model, with a 10-metre resolution, by applying the above-mentioned values for the m exponent. The corresponding value is introduced in the calculus formula proposed by Desmet and Govers, for calculating the L factor (Desmet, Govers, 1996): {[(flow accumulation)*resolution]/(22.1)0.3}; where (22.1)0.3 represents a GIS
calculus parameter. For the area corresponding to the Motru Mining Basin, the spatial distribution of the slope length factor is presented in Figure 2.
5. 3. The slope steepness factor - in
Geographia
Napocensis
Anul II, nr.1/2008
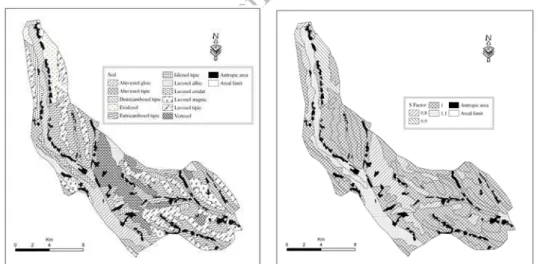
This equation is subsequently introduced in GIS, the result being represented in Figure 3.5. 4. The soil erodibility factor - S
The layer of the topsoil generally consists of slightly cohesive materials (soils and surface deposits), a fact which determines a high susceptibility to erosion. The soil erodibility factor represents the resistance of the soil layer or of the rock to the impact of the raindrops or of the microcurrents generated during the meteoric water runoff. For the quantitative estimation of the soil erodibility factor, the intrinsic properties of the soil were taken into consideration (texture, humus contents, permeability, and hydrical stability of the structure).
The researches made by Eppink L.J. (1985); Nearing M. A. (1988); Mo oc M. (2000), etc. demonstrate that erodibility has a seasonal variability, depending on the climatic conditions, soil works, vegetation structure, etc.
Unlike the U.S.L.E. model, in the Romanian model, ROMSEM, erodability is a non-dimensional parameter, established on the basis of the determinations carried out on the runoff plots. Sandy loam soils were used, characterized by a very strong erosion, whose maximum value was considered 1 (at Perieni station) and loamy clay soils, slightly erodible, rich in humus, with a stable structure and a maximum erodibility of 0.6 (at Câmpia Turzii station). The interpolation between these values for other soils was made on the basis of the determinations carried out with the aid of
Fig.2. The map of the slope length factor (Lm) spatial distribution
Geographia
Napocensis
Anul II, nr.1/2008
the sprinkler infiltrometer (Luca, 1971). As soils with a greater erodibility than the sandy loam ones were also identified, the maximum value of the pedo-lithological erodability index was identified as being 1.2. Usually, the method for estimating the soil erodibility factor is based on the Indicator 186, used in the study entitled “The Methodology of Elaborating Pedological Studies” published by I.C.P.A. Bucharest in 1987. Indicator 186 establishes the classes of erodibility by taking into consideration the genetic type of the land cover, its degree of erosion, and its texture. This coefficient is found in the Romanian literature in the form of some tables and appears in the studies of the following authors: Mo oc et.al (1975) (Table no.2.5), Dârja et al. (2002) (Table no. 13,), Mo oc, Sevastel M. (2002) (Table no.3), etc. As far as the problem of soil erodibility is concerned, and implicily that of the manner of calculating the S factor, M. Mo oc and V. Mor rescu, in their study published in 2000, tackled the main deficiencies of this methodology of estimation.The value of the soil erodibility factor is determined by introducing the value parameters into GIS. This operation implies the transformation of the soil distribution from analogous format into digital format (Fig. 4.), a process followed by the attribution of the coefficients estimated by I.C.P.A.. The result consists in the spatial representation of the soil erodibility factor, depending on the edaphic typology of the Motru Mining Basin (Fig. 5.).
Fig. 4. The soil map of the Motru Mining Basin. (Source: Târgu Jiu Sheet 1979 and
Orşova Sheet 1988)
Geographia
Napocensis
Anul II, nr.1/2008
5. 5. The cover-management factor - C
Vegetal cover represents the main erosion control factor. Thus, the crown influences erosion by intercepting the raindrops before their contact with the land surface, and thus, by dissipating their kinetic energy; trunks contribute to the increase of land rugosity, by reducing the runoff speed and by stopping the formation of the concentrated currents; and the roots fix the soil, favour the accumulation of the organic substances and enhance the hydrical stability of the soil structure. The replacement of the natural ecosystems with agroecosystems determines the modification of the soil protection capacity accomplished by the plants. The natural ecosystems (forests and grasslands) have a small spatial variability; they differentiate zonally, depending on the climate, or regionally, depending on the edaphic conditions. The temporal variability of the cultivated plants depends on the vegetation phases and the applied agricultural techniques.
The cover-management factor expresses the influence of the vegetation over the erosional process. The indicators that assess the soil protection capacity offered by the plants are the dimension of the plants, their height, the volume of the vegetal mass, etc. The concordance between the aggressiveness of the precipitations and the protection degree offered by the plants has also a great importance. In Romania, the critical season of erosion is between May 1st and August 31st (Mo oc, Sevastel 2002).
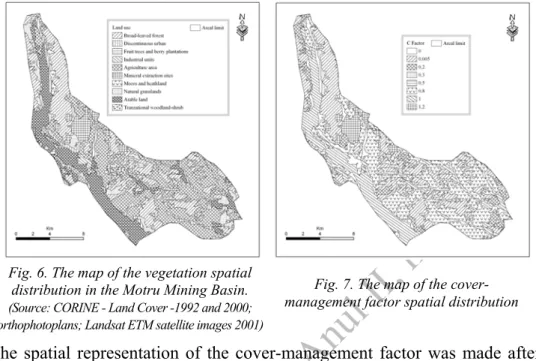
The delimitation of the plots on categories of land use, and implicitly the identification of the different vegetal associations within the Motru Mining Basin, were carried out in conformity with the Corine – Land Cover 2000 and Corine – Land Cover 1992 database, with several corrections made in conformity with the 2003-2005 orthophotoplans and with the Landsat ETM satellite images dating from 2001 (Fig.6).
Geographia
Napocensis
Anul II, nr.1/2008
The spatial representation of the cover-management factor was made afterintroducing into GIS the values present in the cartogram of the use and of the stipulations regarding the productive land structure (Fig.7).
As can be seen from the map, the lowest values appear in the urbanized and forested zones, while the agricultural lands, the degraded lands, or the perimeters with mining exploitations record the highest values.
5. 6. The supporting practices factor - CS
The result of the field research carried out in Romania with regard to the antierosional efficiency and the frequently used methods for soil preservation underlies the determination of the supporting practices factor. For the zones in which there is soil erosion land management or for those in which land reclamation is to be projected (vegetation land management and hydrological land management), the antierosional influence has been determined (Dârjaet al. 2002, Table no.15). In case the protection works of the layer of topsoil lack, such as in the Motru Mining Basin, Cs factor has the recommended value of 1.
6. Results and discussions
In order to assess the opportunity of carrying out some works for preserving the soil, the guiding values of the erosion from the studied area
Fig. 6. The map of the vegetation spatial distribution in the Motru Mining Basin. (Source: CORINE - Land Cover -1992 and 2000; orthophotoplans; Landsat ETM satellite images 2001)
Geographia
Napocensis
Anul II, nr.1/2008
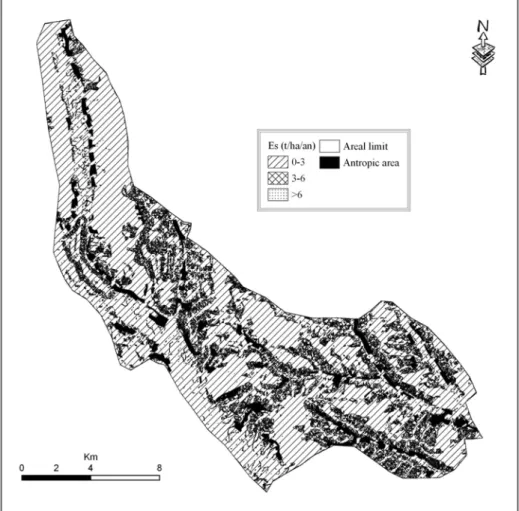
must be known. Our study has in view both the quantitative estimation of the soil loss and the spatial distribution of the pluviometrically- induced sheet erosion.The calculation of the estimative quantities of the soil losses determined by sheet erosion implies the insertion of the value of the previously mentioned factors in the relation proposed by the ROMSEM model. The final result of the GIS application consists in the creation of a thematic map that represents the territorial repartition of the quantity of dislocated material due to the sheet erosion, as a weighted average for each homogenous land unit from the Motru Mining Basin (Fig. 8).
Geographia
Napocensis
Anul II, nr.1/2008
The general accepted limit value of the tolerable sheet erosion is 3 tones per hectare, as an average established for a calendar year. The estimative quantities of the annual average critical erosion expressed in tones/ha/year can be found in the table created by Mo oc M. et al (1973).Within the Motru Mining Basin, we individualized three classes of values for the sheet erosion: 0-3 t/ha/year, 3.1-6 t/ha/year and more than 6 t/ha/year. The analysis of the sheet erosion thematic map indicates that more than 70% of the studied area presents tolerable values of erosion (Es<3t/ha/year), the respective zones being characterized by a low degree of anthropization, a good vegetation coverage (especially trees and shrubs), and slopes that rarely exceed 30% (Iorm neşti Hill, B z vani Hill, the natural meadow of the Motru river, Slivileşti Hill, etc.).
The areas with high sheet erosion values are represented by open pit mines or micro-open pit mines (Lupoaia, Roşiuta, Steic, Ştiucani, etc.), characterized by a slope steepness which can get up to 90%, by the lack of the protective vegetal cover and by a friable lithology; mine damps, with a high degree of looseness, lack of a firm vegetation cover and the presence of some steep slopes and protosoils susceptible to erosion; high values also appear in the immediate proximity of localities, where the arable land predominates and the agricultural techniques are not adapted to the morphological and soil conditions.
7. Conclusions
Geographia
Napocensis
Anul II, nr.1/2008
BIBLIOGRAPHYDÂRJA, M. (2000), Combaterea eroziunii solului, Edit. Risoprint, Cluj-Napoca. DÂRJA, M., BUDIU V., TRIPON D., P CURAR I., NEAG V. (2002), Eroziunea
hidricăşi impactul asupra mediului, Edit. Risoprint, Cluj-Napoca.
EVANS, K. G., LOCH, R. J. (1996), Using the RUSLE to identify factors
controlling erosion rates of mine soils, Journal of Land Degradation and
Rehabilitation Vol. 7, Edited; John Wiley & Sons.
MITASOVA HELENA., MITAS L. (1999), GIS-based erosion and deposition
modeling for complex terrain,. Online tutorial.
MO OC, M. (1983), Ritmul mediu de degradare erozională a solului în RSR, Buletinul Inf. ASAS, Nr.2, Bucureşti.
MOTOC, M. (1984), Participarea proceselor de eroziune şi a folosin elor terenului la diferen ierea trensportului de aluviuni în suspensie pe râurile
din România, in Buletinul Info. ASAS, 13, Bucureşti.
MO OC, M. (2000), Sistemul sol, teren şi procese de degradare, Revista Român de Mediu, ianuarie-aprilie, Bucureşti.
MO OC, M., MUNTEANU, S., B LOIU, V., ST NESCU, P., MIHAI, GH. (1975), Eroziunea solului şi metode de combatere, Edit. Ceres, Bucureşti. MO OC, M., ST NESCU, P., TALOIESCU, LUMINI A (1979), Modele de
estimare a eroziunii totale si efluente pe bazine hidrografice mici, Buletin
ICPA, Bucuresti.
MO OC, M., SEVASTEL, M. (2002), Evaluarea factorilor care determină riscul eroziunii hidrice în suprafaă, Edit. Bren, Bucureşti.
RENARD, K. G. (1985), Rainfall simulation and USDA erosion research: History,
perspective, and future, In: Proc. Rainfall Simulator Workshop, Jan. 14-15,
1985. Soc. For Range Management.
RENARD, K. G., FOSTER, G. R., WEESIES,G. A., MCCOOL, D. K., YODER, D. C. (1997), Predicting soil erosion by water: A guide to conservation planning with the Revised Universal Soil Loss Equation (RUSLE),
Agriculture Handbook. No. 703. U.S. Department of Agriculture, Gov. Print. Office, Washington.
SEVASTEL, M. (2003), Eroziunea în adâncime, Edit. Bren, Bucureşti.
ST NESCU, P., TALOIESCU, IULIANA., GR GAN, LIVIA. (1969),
Contribu ii în studierea unor indicatori de evaluare a erozivităii pluviale,
Anuarul I.C.P.A.vol. 11 (XXXVI), Bucureşti.
WISCHMEIER, W. H. (1976), Use and misuse of the Universal Soil Loss
Equation, Journal of Soil and Water Conservation, v. 31, no.1.
WISCHEMEIER, W. H., SMITH,D. D. (1978), Predicting rain fall erosion losses
- a guide to conservation planning, Department of agriculture, Handbook
Geographia
Napocensis
Anul II, nr.1/2008
WISCHEMEIER, W. H., SMITH,D. D. (1965) Predicting rainfall-erosion loosesfrom Cropland East of the Rocky Mountains. Guide for selection practices
for soil land water conservations, US Department of Agriculture in
cooperation with Purdue Agricultural Experiment Station, Agriculture Handbook No. 282.
ZINGG, A. V. (1940) Degree and leght of land slope as it affects soil loss in runoff, Agr. Ing., no. 21.