www.biogeosciences.net/3/147/2006/ © Author(s) 2006. This work is licensed under a Creative Commons License.
Biogeosciences
Biological control of the terrestrial carbon sink
∗
E.-D. Schulze
Max Planck Institute for Biogeochemistry, Jena, Germany
∗This paper is based on the Vernadsky Medal Lecture 2004
Received: 15 July 2005 – Published in Biogeosciences Discuss.: 1 September 2005 Revised: 10 November 2005 – Accepted: 16 January 2006 – Published: 29 March 2006
Abstract.This lecture reviews the past (since 1964 when the International Biological Program began) and the future of our understanding of terrestrial carbon fluxes with focus on pho-tosynthesis, respiration, primary-, ecosystem-, and biome-productivity.
Photosynthetic capacity is related to the nitrogen concen-tration of leaves, but the capacity is only rarely reached under field conditions. Average rates of photosynthesis and stom-atal conductance are closely correlated and operate near 50% of their maximal rate, with light being the limiting factor in humid regions and air humidity and soil water the limit-ing factor in arid climates. Leaf area is the main factor to extrapolate from leaves to canopies, with maximum surface conductance being dependent on leaf level stomatal conduc-tance. Additionally, gas exchange depends also on rooting depth which determines the water and nutrient availability and on mycorrhizae which regulate the nutrient status. An important anthropogenic disturbance is the nitrogen uptake from air pollutants, which is not balanced by cation uptake from roots and this may lead to damage and breakdown of the plant cover.
Photosynthesis is the main carbon input into ecosystems, but it alone does not represent the ecosystem carbon bal-ance, which is determined by respiration of various kinds. Plant respiration and photosynthesis determine growth (net primary production) and microbial respiration balances the net ecosystem flux. In a spruce forest, 30% of the assimi-latory carbon gain is used for respiration of needles, 20% is used for respiration in stems. Soil respiration is about 50% the carbon gain, half of which is root respiration, half is mi-crobial respiration. In addition, disturbances lead to carbon losses, where fire, harvest and grazing bypass the chain of respiration. In total, the carbon balance at the biome level is only about 1% of the photosynthetic carbon input, or may
in-Correspondence to:E.-D. Schulze
deed become negative. The recent observed increase in plant growth has different reasons depending on the region of the world: anthropogenic nitrogen deposition is the controlling factor in Europe, increasing global temperatures is the main factor in Siberia, and maybe rising CO2the factor controlling the carbon fluxes in Amazonia. However, this has not lead to increases in net biome productivity, due to associated losses. Also important is the interaction between biodiversity and biogeochemical processes. It is shown that net primary pro-ductivity increases with plant species diversity (50% species loss equals 20% loss in productivity). However, in this ex-trapolation the action of soil biota is poorly understood al-though soils contribute the largest number of species and of taxonomic groups to an ecosystem.
The global terrestrial carbon budget strongly depends on areas with pristine old growth forests which are carbon sinks. The management options are very limited, mostly short term, and usually associated with high uncertainty. Unmanaged grasslands appear to be a carbon sink of similar magnitude as forest, but generally these ecosystems lost their C with grazing and agricultural use.
Extrapolation to the future of Earth climate shows that the biota will not be able to balance fossil fuel emissions, and that it will be essential to develop a carbon free energy sys-tem in order to maintain the living conditions on earth.
1 Introduction
Human population
Size Resource use
Human activities
Agriculture Industry Recreation International commerce
Land transformation Land clearing Forestry Grazing Intensification Invasion Hunting Fishing Impact on habitats
Biotic changes Global biogeochemistry Carbon Nitrogen Water Synthetic chemicals Other elements Trace gases Aerosols Land cover
Extinction of species and populations Loss of ecosystems Climate change biological diversityLoss of
Socio-economic conditions
Fig. 1. Schematic presentation of the interactions between the
hu-man population and Global Change (Schulze, 2000).
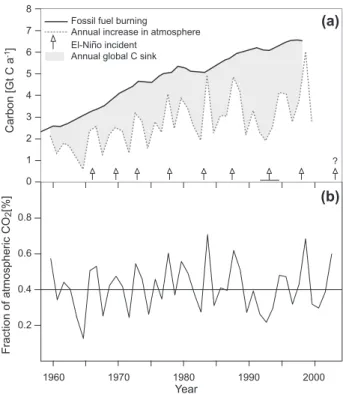
trade. All these activities lead to land transformations, such as forest clearing, to changes in biogeochemistry, such as the global carbon cycle, and to biotic changes, such as invasion and extinction of species. These changes affect global cli-mate as well as biological diversity, and both feed back on the global biogeochemical cycles on the one hand, and on the hu-man population on the other. This latter feedback, however, strongly depends on the socio-economic conditions, which, in contrast to the physical climate system, are difficult to pre-dict for the future. The overall effect of human activity on global biogeochemistry is most obvious from the rise in car-bon dioxide (CO2)as measured since the 1960s on Mauna Loa in Hawaii, and in a global network of stations since the 1970s. The difference between the annual fossil fuel con-sumption and the annual change of the rise in atmospheric CO2 is caused by the activity of the surfaces of marine and terrestrial environments to assimilate CO2, the so-called car-bon sink (Fig. 2a). Despite large year-to-year variation, the sink activity has increased since 1960 (Prentice et al., 2001), and the variation in the global carbon sink is to a large ex-tent related to the occurrence of El Ni˜no events. This has been interpreted as evidence for a strong biological regula-tion of the global carbon sink (Prentice et al., 2001). At the same time, Heimann (pers. communication) points out that the fraction of fossil fuel CO2that remains in the atmosphere has been constant since 1960 (Fig. 2b), which suggests that there might also be a strong physical control of this frac-tion. Since atmospheric oxygen measurements have been used to partition the total global carbon sink into activities of the ocean and the terrestrial surface (Keeling et al., 1996), it has become clear, that the variation of the increase in at-mospheric CO2 is strongly related to processes at the land surface. Therefore, in the following I will discuss (1) the processes that cause changes of the natural sources and sinks
8 7 6 5 4 3 2 1
Carbon [Gt C a
-1]
Fraction of atmospheric CO
2
[%]
Fossil fuel burning
Annual increase in atmosphere
?
1960 1970 1980 1990 2000
0.2 0.4 0.6 0.8 0 (a) (b) Annual global C sink
El-Nino incident~
Year
Fig. 2. (a)The annual change of fossil fuel burning and the
in-crease in atmospheric CO2concentration. The difference between the two lines represents the global carbon sink. The variation is to a large extent related to El Ni˜no events (Prentice et al., 2002),(b) The fraction of fossil fuel C that remains in the atmosphere over time (M. Heimann, personal communication).
on land, and (2) the effects of natural and anthropogenic dis-turbances as basis for a variable activity of the land surface. (3) At the end of this paper I will add some thoughts about the future of fossil fuel emissions. This overview does not cover all topics, but instead is a selection of mainly personal observations from the past decades. It is a summary of the Vernadsky Medal Lecture presented at the 2004 EGU meet-ing.
2 Natural sinks: CO2assimilation
Natural sinks in terrestrial systems result from photosynthe-sis by plants, and this process has attracted eco-physiologists since the International Biological Program (IBP), which brought together individual scientists from around the globe to study the performance of plants in different climatic re-gions (Schulze and Caldwell, 2000). In fact, in a historical perspective, it was the IBP which started field ecology and methodology in a coherent manner (Trebon, 1970).
(
a
)
(
b
)
(
c
)
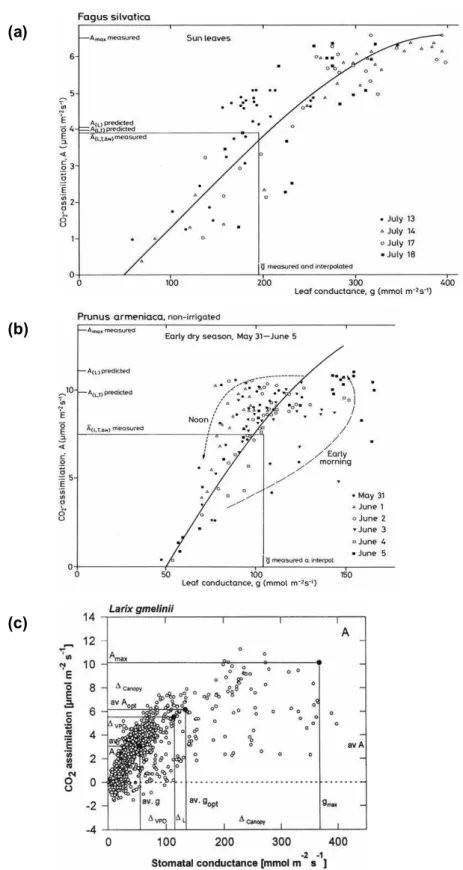
Fig. 3.CO2assimilation as related to leaf conductance for(a)Fagus sylvaticain the temperate deciduous forest of Germany (Schulze, 1970),
Fig. 4. CO2-assimilation of leaves in different vegetation types as
related to leaf nitrogen concentration (Field and Mooney, 1986).
their maximum leaf conductance (gmax). Different climatic factors cause this down-regulation: it is mainly insufficient light in temperate regions (clouds, dawn, dusk), and it is the combination of light, temperature and air humidity in semi-arid regions, and it is mainly air humidity in a borealLarix
forest of Siberia.
It was a surprise to find that CO2-assimilation was not re-lated to the activity of the CO2fixing enzyme, Rubisco. It is possible to down-regulate Rubisco by 50% before it affects photosynthesis (Stitt and Schulze, 1993). Obviously Rubisco has more physiological functions than just fixing CO2. It is the enzyme that reduces CO2to carbohydrates, it protects the photosynthetic apparatus against damaging light through its demand for electrons in CO2 reduction, and it is a storage product for nitrogen. Despite these diverse functions, Amax (per gram dry weight) is linearly related to leaf nitrogen con-centration (gN g−1dw) in a broad range of leaf types (Fig. 4, Field and Mooney, 1986).
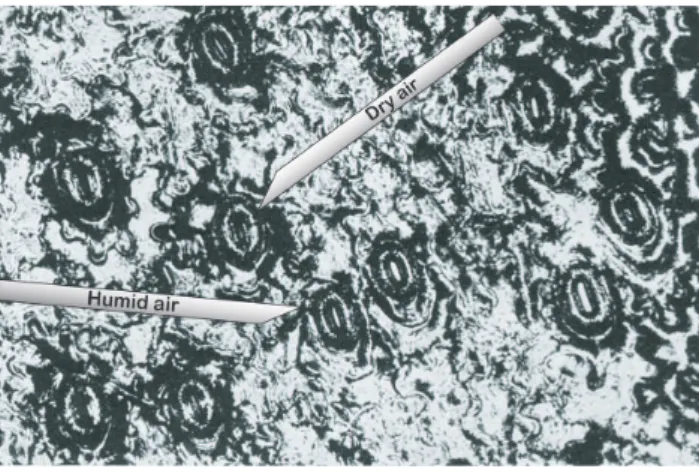
The strong effect of air humidity on CO2uptake, which is shown in Fig. 3c, results mainly from an effect of stomatal closure, which may even cause a secondary down-regulation of photosynthesis. Stomata operate in this case independent of CO2assimilation. Individual stomata can be opened and closed when exposing them to moist or dry air (Fig. 5, Lange et al., 1971).
The effect of plant water stress on leaf conductance and CO2 assimilation remained for a very long time an area of uncertainty. Leaf water potential was initially thought to
con-Fig. 5. Individual stomata ofPolypodium vulgarerespond to dry
and humid air. In this case, the epidermis had been pealed from the leaf and exposed on a water surface, maintaining a small air bubble below few stomata, to simulate the sub-stomatal cavity. The response is reversible, i.e. the closed stomata open with humid air and the open stomata close with dry air (Lange et al., 1971).
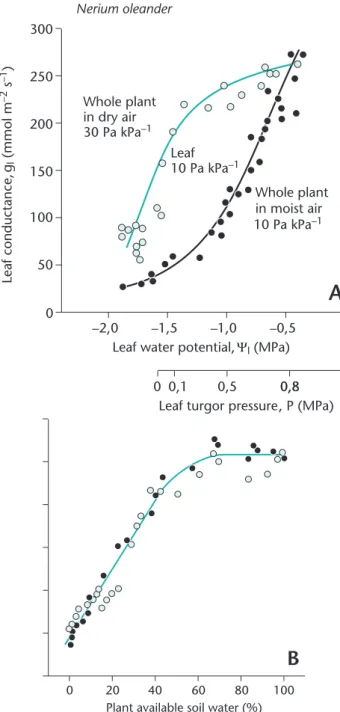
trol leaf performance, but the plant regulation of water stress is more complicated. As a general principle, plants have es-tablished many internal feedback mechanisms, but with re-spect to responses towards changing environment, feedback responses may be too slow and thus too late. Damage may have already occurred before the feedback response reduces the stress. Thus, plants have developed also a multitude of feed-forward responses, such as the opening response of stomata at blue light, or their closure in dry air. The response to water stress is also such a feed-forward response. It is the root tip which senses drought in the soil, and it sends a chem-ical signal (abscisic acid) to the shoot to close the stomata. Leaf water potential can be shifted more than 1 MPa, by ex-posing the whole plant to dry or moist air, but stomata close independent of the water potential in the leaf by a response to dry soil (Fig. 6, Schulze, 1986; Schulze et al., 1988).
The physiology of plant water relations has experienced a complete re-interpretation in recent years. Since Slatyer’s book on plant water relations (Slatyer, 1967) it was a dogma that water moves along a water potential gradient in a soil-plant-atmosphere continuum. However, since then it became apparent that water does not move across membranes along a physico-chemical gradient, but that water movement is phys-iologically regulated by water channels (Tyermann et al., 1999), a unifying concept of plant water relations is being re-generated at molecular level (Schulze et al., 2005).
Leaf water potential, Ψl (MPa)
Leaf conductance,
gl
(mmol m
–2
s
–1)
300
0 0
–2,0 250
200
150
100
50
–1,5 –1,0 –0,5 Whole plant in moist air 10 Pa kPa–1
Whole plant in dry air 30 Pa kPa–1
Leaf 10 Pa kPa–1
Leaf turgor pressure, P (MPa) 0,8 0,8 0,5
0,1 0
Nerium oleander
A
B
Plant available soil water (%) 100
0 20 40 60 80
A
B
Fig. 6.Leaf conductance as related(A)to leaf water potential and
(B)to plant available soil water. The whole plant was exposed either to dry or to moist air, which shifted the leaf water potential by 1 MPa because of differences in whole plant transpiration in dry versus moist air. In both situations, a single leaf was maintained at constant air humidity, in order to avoid stomatal closure. Then, then the plant was dried out, and the panels (A) and (B) show the traces of the dry out cycle. In both situations (exposure to dry and humid air) the plant responds to the common signal of plant available soil water (Turner et al., 1985; Schulze, 1986).
Fig. 7. Maximum canopy conductance (dashed line) and surface
conductance (solid line) as related to leaf area index. The differ-ence between canopy and surface conductance is a measure of the contribution of the soil surface (Kelliher et al., 1993).
on the sum of plant transpiration and evaporation, becomes important at low leaf area indices, where evaporation from the soil surface may become dominant. At bare soils surface conductance increases again. It is interesting to note, that a minor plant cover can reduce surface conductance signifi-cantly.
Fig. 8. (A)Maximum stomatal conductance as related to leaf nitrogen concentration,(B)maximum surface conductance as related to stomatal conductance, and(C)maximum CO2assimilation as related to maximum surface conductance for leaves from different vegetation
types (Schulze et al., 1994).
We may conclude with respect to the control of CO2 as-similation that natural environments are always stressful. Amaxis basically never achieved. The operational point (50% of maximum performance) gives the greatest possible control in a variable environment. In fact, many enzyme systems op-erate at about 50% of their maximum performance in order to allow for a maximum range of regulation under variable conditions (Stitt, 1993).
Historically, it is interesting to note, that photosynthesis research collapsed in the mid 1980s, because all leaf types
Fig. 9. The annual balance of net ecosystem exchange as related to latitude at 26 stations of the Euroflux network (Valentini et al., 2000).
3 Respiration
Respiration entered into the photosynthesis-centered re-search of ecophysiologists following the breakthrough of technology when the eddy covariance methodology was de-veloped by micrometeorologists (Swinbank, 1951). Sud-denly it became possible to quantify the net flux of a whole canopy. The exchange of CO2, water vapor and heat is mea-sured by analyzing the content of air packages entering and leaving the ecosystem.
The surprising observation of the Euroflux network (Valentini et al., 2000) was, that the annual ecosystem bal-ance of assimilation and respiration, decreased with latitude (Fig. 9, uptake is denoted as negative number, because it is a depletion of the atmosphere by CO2). Since growth stud-ies did not support this result, the target of research became respiration. The full explanation and interpretation of this re-sult is still under debate (Van Dijk et al., 2005) because of the difficulties to quantify respiration. Ecosystem respiration contains several components, and only few examples exist in which the partitioning of respiration has been untangled. Ecosystem respiration consists of (1) respiration by leaves or needles, (2) respiration by woody stems, which may con-tain the largest amount of biomass in forests but the main part of which is dead, and of (3) carbon losses from the soil which includes root respiration, microbial respiration, and CO2release from weathering rocks. It still remains unclear if leaves respire during photosynthesis or if respiratory CO2 is immediately re-assimilated in leaves (Loreto et al., 1999), just as much as soil respiration is being re-assimilated by the canopy or the under-story during the day. Figure 10a shows
(a)
0 50 100 150 200 250
Respiration (g C m
-2)
Apr May Jun Jul Aug Sep Oct Nov Dec Jen Feb Mar Apr May Jun Jul Aug Sep Oct Nov Dec Jen Feb Mar Apr May Jun Jul Aug Sep Oct Nov Dec
Month Rsoil Rwood Rfoliage TER-comb., LT TER-MM
1997 1998 1999
(b)
** ** ** ** ** ** ** ** * ** * * ** ** ** * * * 0.0 1.0 2.0 3.0 4.0 5.0 6.0 7.0 8.0 01.04. 2002 01.05. 2002 01.06. 2002 01.07 .2002 01.08. 2002 01.09. 2002 01.10 .2002 01.11 .2002 CO 2 fl ux [ µ mo l m
-2 s -1]
soil
prim in g
litte r roots
girdling litte r place m e n t
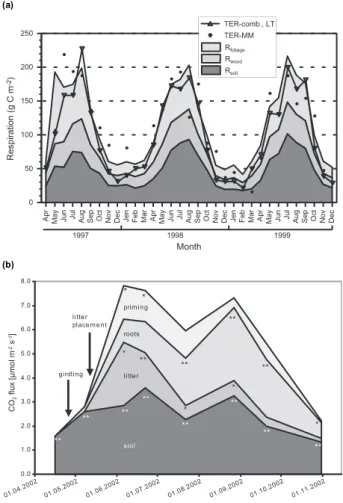
Fig. 10. (a)Ecosystem respiration as measured by eddy covariance
(TER-MM) and modelled by temperature (TER-comb) and the par-titioning into respiration of needles, wood and soil as related to sea-son at the Waldstein site (Rebmann, 2004).(b)Components of soil respiration in a girdled and un-girdled forest at the Wetzstein site. This figure also shows the effect of adding litter on soil respiration (Buchmann, in Schulze, 2003).
an example of the partitioning of ecosystem respiration for a spruce forest in Germany, where needles contribute about 30%, woody stems contribute about 20%, and the soil almost 50% to ecosystem respiration. There is also a distinct sea-sonal and inter-annual variation.
Fig. 11. Comparison of the phylogenetic contribution in protein pools derived from a natural and a girdled spruce forest. Area and number next to the pie charts represent the number of proteins (W. Schulze, 2004).
this experiment for spruce in Germany (Fig. 10b) where the difference between girdled and un-girdled stands is taken as a measure for the contribution of roots. It was estimated, that 40% of soil respiration originates from plant roots. Combin-ing this information with Fig. 9, it is clear that plants con-tribute about 75% to total ecosystem respiration. In contrast to the distinct seasonal course in root respiration, the season-ality in microbial respiration is smaller, and this seems to be true also in other ecosystems. At this moment it is unclear if this is due to the buffered climate conditions in forest soils or due to acclimation of soil organisms (Lange and Green, 2005). The latter would mean that using a constant temper-ature response function of respiration for predicting future behaviour of soils under various scenarios of temperature rise may just be questionable. To my knowledge, this detail of partitioning is presently available only for forests, more specifically for European spruce forest, and it may be dif-ferent in grasslands, particularly in C4-dominated communi-ties. Although the experimental approach to separate plant and microbial respiration by girdling the trees appears very elegant, it has also its problems. W. Schulze (2004) identified the existing organismic community using proteomics finger-printing (Fig. 11). In the healthy control stand there was a wealth of organismic groups present, in total 9. However, in the girdled stand only 4 organismic groups remained. This demonstrates for the first time, how many compartments in an ecosystem directly depend on carbohydrates from the tree. It is more than just the root and its mycorrhiza. Second, the analysis shows that the change in respiration was not repre-senting just the activity of plant roots, but it represents the respiration of a whole group of associated organisms. Third, this analysis shows that it is impossible to carry out a manip-ulative experiment without changing the soil biota, and that it appears impossible to maintain the soil biota constant. Fi-nally, any manipulative experiment should follow closely the activity of the organismic community as a whole.
Investigating roots and soils has become a priority research (Science, 2004), but many aspects remain unclear. Where does a root end? Figure 12a shows the root system (orange part) and the associated mycorrhizal system (white hyphae) of a spruce seedling. Obviously, the plant’s range of action is significantly enlarged by the mycorrhizal fungus, and it re-mains unclear to what extent this fungus contributes to soil respiration, if it is strictly autotrophic or heterotrophic, and how much C is gained or lost by the plant through mycor-rhizae. According to Read (Schulze, 2003) soil respiration decreases about 30% if roots and mycorrhizae are excluded. Julou et al. (2005) showed that there are plants that make use of the carbohydrate flow from the root to the mycorrhizae and tap this flow as parasites. Orchids seem to be especially capable of doing this as a basis for survival in the shade. Al-though microbial carbon turnover is important research for the future and is required to understand carbon immobliza-tion is soils, I will not be able to cover this field in this review (see Meyer, 1993).
Roots do not only extend into the microbial community by fungal associations but extend the active zone of biological activity also in terms of soil depth. Most ecosystem stud-ies end at about 0.3 m soil depth, while roots explore soils in all ecosystems to a depth of more than 1 m and may reach maximum measured depth at 50 to 70 m (Canadell et al., 1996). They may extend to about 100 m in arid climates. This part of ecosystems has remained largely unstudied so far (Fig. 12b), but the activity would be captured in the eddy covariance measurement.
It is only recently that we have become aware that the net canopy flux (NCF) as measured by eddy covariance is not the net flux of the ecosystem (NEE). There are lateral trans-ports by thermal gradients and associated advection (Aubinet et al., 2003; Marcolla et al., 2005), and there are losses to the groundwater by dissolved organic carbon (DOC). The fate of both fluxes are important at a landscape scale. The lat-erally transported C will emerge elsewhere in the landscape. The DOC may be mineralized in the anaerobic zone of the profile and emerge as methane, or contribute to the forma-tion of dissolved inorganic C (DIC). Thus, the C balance of ecosystems remains unresolved. It is also beyond the scope of this paper to discuss in depth C-stocks in soils, which are determined not only by soil properties (clay content) and mi-crobial activity (see Schulze et al., 2005, p. 430 ff) but mainly by land-use history.
4 The ecosystem approach
(a)
(b)
boreal fo rest
agricult ure
desert scleroph yll
tempera te
tempera te
tempera te grass
lands
tropical deciduo
us fores t
tropical eve
rgreen forest
trop. gra ssland/s
avanna
tundra bushlan
d/forest
conifero us fores
t
deciduo us fores
t
Maximum rooting depth (m)
Fig. 12. (a)The distribution of biomass in a seedling ofPicea abiesgrowing in a Petri dish into aboveground biomass, roots and mycorrhizae
(by courtesy of D. Read),(b)Maximum rooting depth in different biomes (Canadell et al., 1996).
it was shown that photosynthesis was independent of the S concentration in the leaf (Fig. 13, Lange et al., 1989). The mass balance of sulphur indicated (K¨ostner et al., 1998) that the main fraction of sulfate in leaves originates from uptake by roots from the soil and not via uptake of SO2 from the atmosphere. Clearly, the high sulphate content in European soils originates from atmospheric air pollution. This finding underlined the necessity to link photosynthesis research with whole plant ecology and ecosystem science.
Fig. 13. The relation between photosynthetic capacity, as related to dry weight, and sulphur concentration of healthy and damaged needles (Lange et al., 1989).
or NH3. Ammonia may also co-deposit with SO2 on leaf surfaces, mainly catalyzed by Mn, and then enter in liquid form as ammonium cation or nitrate anion into the plant. Even sulfate may enter via this route. The ionic uptake is not regulated as in roots, but it is associated with an ex-change of protons or cations from the inside of the leaf, well known as canopy leaching (Ulrich, 1987). To my knowl-edge, the different pathways have not yet been measured in-dependently and directly. There are only estimates that the wet deposition to ecosystems as measured in rain (on aver-age 10 to 20 kg ha−1yr−1)may increase by factor 2 to 3 if aboveground uptake of N into biomass is being considered (Harrison et al., 2000).
With respect to forest decline it emerged that the visi-ble symptoms of yellow needles results from an interaction of unregulated N-uptake from the air under conditions of a limitation of available cations in soils which in turn results from a sulfate induced soil acidification. The experiment that demonstrated this interaction was surprisingly simple (Fig. 15a). Since N uptake affects primarily growth, the hy-pothesis was that if one would stop growth then cation uptake could balance the demand, and needles would not become yellow. Therefore, buds were clipped off or left for growth of new shoots on opposite twigs of the same branch (Lange et al., 1987). At high cation supply, clipping of buds had no vis-ible effect, but under conditions of cation limitation needles became yellow. Clipping buds and avoiding growth restored the cation balance and lead to a re-greening of the shoot. In general terms, inhibiting growth affected the following chain of processes (Fig. 15b): if we consider two levels of cation supply (healthy green and yellow plants), and if both plants grow in relation to the amount of available nitrogen, cation re-allocation takes place in the plant from old to young nee-dles in order to support the new growth. This may lead to old needles reaching a threshold at which they start to turn yellow or die if the respective cation is limiting in the soil.
This phenomenon is most clearly expressed with respect to Mg, but in principle the same processes are involved with Fe, K, Mn and other cation deficiencies.
In the last two decades of acid rain had a very signif-icant effect on ecosystem science. In fact it was the start of an interdisciplinary approach to biogeochemistry in con-trast to the “trophic level” approach of earlier ecosystem re-search. In addition, it was the acid rain research, which in-duced the awareness that research must go beyond ecosys-tems and even beyond national boundaries. The cross bound-ary transport of air pollutants (FBW, 1989), and the concept of critical loads (Schulze et al., 1989) lead to European and global research networks, and the start of the International Geosphere-Biosphere Program (IGBP) with GCTE (Global Change and Terrestrial Ecosystems) as an important compo-nent (Walker and Steffen, 1996). In the last 2 decades IGBP-GCTE had been the driving force to create global networks (e.g. the CO2- and flux-networks) and to concentrate interna-tional research along continental transects. These networks are the foundation for our research even today, e.g. the Eu-ropean Integrated project CarboEurope-IP emerged from an IGBP-type research organization.
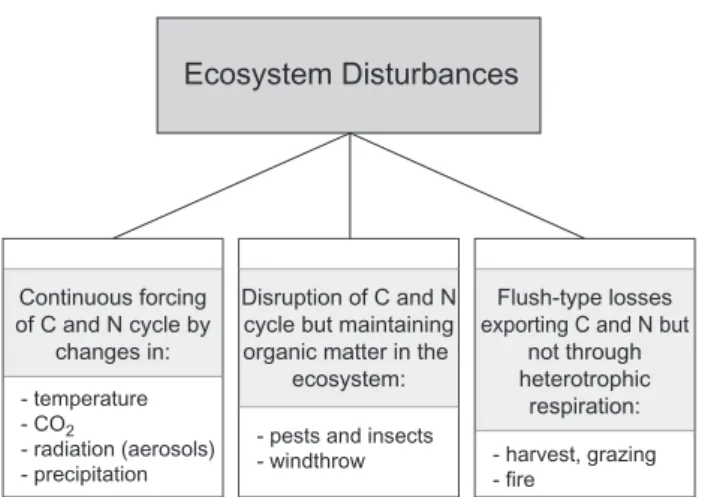
5 The role of disturbance
Ecosystems loose carbon not only in a regular response to carbohydrate supply and climate but also by events and forces that may be irregular in time, called disturbances. Thus with respect to the carbon balance, disturbance is not only the event of destruction, but also the regular change as imposed by global temperature change that continu-ally stresses an ecosystem. One may classify disturbances (Fig. 16) as (1) continuous forcing of the C and N cycle, e.g. by temperature or CO2increase, which could result in acclimation as ecosystem response, or (2) as disturbances that may act as disruption of the C and N cycle, e.g. by wind throw, where all plant material may remain on site if it is not extracted by forest management, or (3) as disturbances where C and N are exported from the ecosystem. In the case of fire and harvest, the ecosystem C-loss bypasses the het-erotrophic chain of respiration. In this case, the oxidation of biomass into CO2may occur in a totally different place than the original ecosystem, e.g. in a city incinerator. Thus, the global carbon cycle must consider the fate of products in future. In the case of fire and harvest the ecosystem has to re-generate resources such as cations and nitrogen. Fire and harvest emerge as the dominating forms of disturbances, considering the fact that 30% of the terrestrial surface of the globe is used by agriculture,>30% are about used by graz-ing, and 20 to 30% are used by forestry, and the largest frac-tion of forest fires is human induced.
Fig. 14.Pathways of uptake of ammonia and nitrate through aboveground biomass of leaves and stem surfaces (Harrison et al., 2000).
Month
M
agnesium concentration
(µ
mo
l g
-1)
20
10
5
O M
M 0 15
J J
A A S
25 30
green
yellowing
Concentration at beginning of growing season
Threshold for yellowing
Cation re-allocation during
growing season
increasing Mg concentration
Concentration at end of growing season
Re-allocation
Nitrogen concentration
undamaged,
without growth undamaged,with growth
damaged, with growth damaged,
without growth
M
g
conc.
Mg
conc
.
M
g
conc.
Threshold for yellowing (b)
(a)
Fig. 15. (a)The response of needles with respect to magnesium concentration after clipping of buds and thus inhibiting growth and on intact
Ecosystem Disturbances
Continuous forcing of C and N cycle by
changes in:
- temperature
- CO2
- radiation (aerosols) - precipitation
Disruption of C and N cycle but maintaining organic matter in the
ecosystem:
- pests and insects - windthrow
Flush-type losses exporting C and N but
not through heterotrophic
respiration:
- harvest, grazing - fire
Fig. 16. A carbon-related classification of ecosystem disturbances
(Schulze et al., 1999).
new SOM Soil Organic Matter
CO2 CO2
Net Ecosystem Productivity
Black C
CO2
Litter
Rh (Litter) Rh (SOM)
active
passive Rh (BC)
M o rta lity Ha rve s t CO2CO2 Fire
Net Biome Productivity
Wood-products
Carbon losses of
f site CO2 CO2 Gross Primary Productivity PS-products
Growth RespirationPlant
Biomass new
old
Net Primary Productivity
Heterotrophic Respiration
Fig. 17. A conceptual scheme of the carbon flow through
ecosys-tems, with input by photosynthesis (Gross primary productivity) and C-losses plant respiration. The balance describes plant growth (Net primary productivity, NPP). At the same time, plants shed biomass that reaches the soil and which is decomposed by microor-ganisms and a microbial respiratory C-loss. The balance of CO2
-assimilation and all respiratory processes is defined as Net ecosys-tem productivity (NEP). However, besides respiratory losses, there are carbon losses that bypass respiration. These are by fire, har-vest and grazing. The total carbon balance, including respiratory and non-respiratory losses, is termed Net Biome Productivity (NBP) (Schulze and Heimann, 1998; Schulze et al., 2000).
carbon accumulations and losses take place which bypass respiration, requires a new terminology (Fig. 17, Schulze and
Years after glaciation
Soil carbon at fen (kg C m
-2) 120 20 60 6300 0 40 80 100 0 10 20 30 40 50 5950 5600 5250 4900 4550 4200 3840 3500 3150 2800 2450 2100 1750 1400 1050 700 350 0
Soil carbon in pine and spruce forest (kg C m
-2)
Manitoba, Canada
Picea mariana 10 – 20 kg C
Pinus banksiana high fire frequency moderate fire frequency Fen 100 kg C low fire frequency
Fig. 18.Soil carbon accumulation in boreal forest ecosystems with
low and high fire frequency (Harden et al., 2000).
Heimann, 1998). Gross primary production, GPP, denotes the CO2assimilation as discussed before. Net primary pro-duction, NPP, would be the balance between GPP and plant respiration. It is approximated by the growth rate of plants. It is the target for agriculture and forestry. Net ecosystem productivity, NEP, includes heterotrophic soil respiration. It is this quantity that may be measured by eddy covariance methodology. In most ecosystems studies so far NEP were indicating a C sink. However, eddy covariance does not cover the export of carbon that bypasses respiration, mainly by harvest and by fire, and it does not cover advective trans-port and losses to ground water. Harvest for food and fiber is the main target of human land management. The combined process, including carbon losses off site and respiration has been termed Net biome productivity, NBP.
(1) GPP=CO2 Assimilation (assuming that respiration in the light equals dark respiration)
(2) NPP=GPP−Ra(Rabeing respiration by the autotrophic
plant)
(3) NEP=NPP−Rh (Rh being the respiration of the
het-erotrophes)
(4) NBP=NEP – (non-respiratory fluxes)
(a)
Fig. 19. A summary of existing data of NPP, NEP and NBP over(a)Western Europe,(b)Siberia and(c)Amazonia. NPP components are
coarse roots, fine roots, stems, twigs and branches, leaves. F.I.: forest inventories. Models: four global models HRBM, IBIS, LPJ, TEM from left to right prescribed with rising CO2, climate variability and rising CO2, climate variability and rising CO2and crop establishment.
Eddy fluxes: up-scaled Euroflux towers using satellite and gridded climate fields. Inverse: atmospheric inversions are “forest NBP” obtained from subtraction of cropland and pasture fluxes (Ciais, 2005).
added the term NECB, which is the Net Ecosystem Carbon Balance. NECB would be the same as NBP but restricted to the ecosystem level.
NBP and NECB would contribute to the fraction of CO2 assimilation that accumulates in the ecosystem and landscape over very long time, this is, the carbon pool of ecosystems. It would be the actual long-term C-sequestration by ecosys-tems that the atmosphere “sees”. It turns out, that the mea-surement of NBP is difficult, because we are dealing with slow uptake process accumulating C over very long time, and very fast, short-term C-losses. K¨orner (2003) characterized this behaviour as “slow in, fast out”-system, where a balance is difficult to assess. Probably it can only be quantified over large areas, such as a biome. The long-term effects of the non-respiratory, “fast out” C-losses may be dramatic for the C-pool. A model example is shown in Fig. 18, where bo-real ecosystems are disturbed by fire in different frequency, and the total C accumulation after 6000 years differs by fac-tor 10 between frequent and low fire events. The total C-accumulation is in this case neither related to respiration nor to CO2-assimilation but instead related to the drain of C by fire.
Disturbances by land use change are particularly long-lasting. The carbon loss by change of forest into agriculture is detectable in forest soils, even after several hundreds of years of forest (Wirth et al., 2004).
The existing data of NBP were reviewed by Schulze et al. (2002). In a modeling exercise Ciais et al. (2005a) inves-tigated why NEP and NBP are positive (i.e. never reaching an equilibrium) (Fig. 19). It turns out that most continents are carbon sinks but for different reasons. It is increasing CO2 that accelerates NEP in the Brazilian rain forest increasing temperature that enhances growth in Siberia, and deposition of nitrogen that accelerates NEP and NBP in Europe. How-ever, recent accelerations of climate disturbances via drought and fire may again consume this sink (Ciais, 2005b).
6 The global carbon budget
(b)
(c)
and 13% from Russia. On a global average, about 48% of the emissions are re-assimilated by vegetation. However, the terrestrial surface is also a source due to land use change. Thus, the global average sink shrank to 22% of the emissions. Looking at the Euro-Siberian continent, it becomes appar-ent, that the total emissions of West Europe and Russia of 1.9 Gt C yr−1were balanced by a net carbon sink of 1.7 Gt C yr−1over Europe and Siberia. Obviously, the Siberian boreal forest balanced almost 90% of the Eurosiberian emissions.
This observation is remarkable, because the boreal forest of Siberia is to a large extent still a pristine forest that has not been managed by wood extraction. Obviously, un-managed pristine forest is not in some kind of equilibrium of assimi-lation and respiration in the sense of Odum but continues to accumulate carbon. This is despite the natural fires occurring in that region. The result has been confirmed by eddy correla-tion measurements (Schulze et al., 2000; R¨oser et al., 2002), and a closer analysis of the tropospheric inversion models in-dicate (Ciais et al., 2005a) that the Siberian sink results from the temperature rise in that region. In contrast, if we used the Siberian forest for timber and fiber, and if this forest would be logged or burnt within a short period of time, the data of Schulze et al. (2000) suggest that this region could turn into a carbon source, and the fossil fuel emissions of boreal Eurasia would remain in the atmosphere with unpredictable consequences for global climate.
The results of Siberian forest indicate, that land-use and land-use-change can affect global climate significantly, and the preservation of carbon stocks, and the maintenance of previously un-managed regions may be just as important as the reduction of fossil fuel emissions in view of global cli-mate (WBGU, 1995). The Kyoto protocol does not allow accounting of this natural sink, and even encourages its de-struction by stating in the preamble that “the mere presence of carbon stock be not accountable”.
However, besides this scenario of immediate destruction, it must also be considered that forests can be managed in a sustainable way. The Euroflux project (Fig. 9) is based on managed forests only, and all tower stations indicate a sink, but this does not account for the export of C by harvest which takes place every 10 years by thinning and every 100 years by final harvest. Thus the net carbon sink of Europe appears to be very small, mainly due to emissions from agriculture (Janssens, 2003). In a variegated landscape of forest and fields the emissions by agriculture are scubbed by forests. Maybe, in future, the farmer has to pay the forester for this job.
It remains a task to separate management effects from en-vironmental change, because the Kyoto protocol in its Ar-ticle 3.4 will only allow an accounting of human induced changes. At present there is no consensus how to separate the different driving factors. The management effect can only be estimated by modeling. Using the Biome-BGC-model, Wirth et al. (2004) compared inventory and model simula-tions which indicate, that 22 to 37% of the observed change
Table 1. The global carbon budget of fossil fuel emissions and of
the terrestrial regional C sink (Schimel et al., 2001).
(Gt C a−1) (%)
Fossil fuel emissions 6.3±0.4
USA 1.6 25
EU-15 1.1 17
Russia 0.8 13
Germany 0.3 4.8
Atmospheric CO2increase 3.2±0.1
Net uptake of the oceans 1.7±0.5
Net uptake of the continents 1.4±0.7
Emissions due to land-use change 1.6±0.8
Assilmilation by vegetation 3.0
USA 0.8 27
Europe 0.4 13
Siberia 1.3 43
Tropics 0.5 17
in carbon stocks of the state forest of Thuringia were the result of management (Vetter et al., 2005). However, since German forest management operates at a high level of car-bon stocks, the options for a further increase in stocks are very limited, and the high carbon stocks are not account-able since they existed before 1990. The forest sink could be increased by large scale harvest and the associated unac-counted C-loss. Model calculations show that fast growing plantations would reduce the inventory stocks. Extending the rotation time would be a mechanism to “buy for time”, i.e. it would delay emissions, but it would not increase the stocks in a sustainable way. The expected increase from changing softwood into hardwood is limited, and it would start to take place after about a half rotation period (50 years). Selective cutting systems would have limited effects, but protection of forest from wood extraction would have a long-lasting and surprisingly large effect, but it is not accountable in the Ky-oto context, i.e. one is not entitled to sell this carbon on the stock market. Thus, the management options to increase the terrestrial carbon sink are very limited, mostly restricted to short time periods and/or associated with many uncertainties.
7 Biodiversity effects
(a)
Aboveground biomass in monoculture > 3cm (g m-2)
0 200 400 600 800 1000 1200 1400
Abo
v
egroun
d b
io
m
ass i
n
m
ixture
>
3
c
m
(
g
m
-2)
0 200 400 600 800 1000 1200 1400
Aboveground biomass in monoculture > 3cm (g m-2)
0 200 400 600 800 1000 1200 1400
2-species mixtures
Aboveground biomass in monoculture > 3cm (g m-2)
0 200 400 600 800 1000 1200 1400
Abo
v
egroun
d b
io
m
ass i
n
m
ixture
>
3
c
m
(
g
m
-2)
0 200 400 600 800 1000 1200 1400
Jena, May 2003 Main experiment
4-species mixtures 8-species mixtures
(b)
Fig. 20. (a)The Jena Biodiversity experiment. 440 plots differing in their diversity between 1 and 60 species were established. A part of the
plots combined the most dominant species (Roscher et al., 2004).(b)The relation between hay yield and plant biodiversity in experimental fields across Europe (Hector et al., 1999).
where experimental plots with variable biodiversity were es-tablished as grassland across Europe (Fig. 20a). It emerged, that plant biodiversity had an effect in all climatic regions of Europe. Loosing half of the plant species would decrease productivity by 20% (Fig. 20b). However, this result is de-batable. It may hold only for early successional stages while in later successions the relation may reverse (Thompson et al., 2005).
Biodepth focused on plant species, which is not enough for understanding the value of biodiversity, but we are only beginning to detect biodiversity across all heterotrophes. A new approach was introduced by W. Schulze et al. (2004) us-ing proteomics to show the presence of organismic groups in ecosystems and their response to environmental change (Fig. 21). In fact, the plant cover contributes very little to the total ecosystem biodiversity, which is dominated by
micro-bial organisms. Although we must admit that we do know very little about the functional effect of this diversity, pro-teomics give us an initial tool to detect the origin of a num-ber of key extracellular enzymes such as laccases, cellulose or peroxidase. Based on this type of information, we hope that we can link the biological control of C sinks to the ef-fects of specific species or functional groups in future.
8 The future C cycle
bacteria bacteria bacteria bacteria archaea plantae plantae plantae plantae mammals amphibia insects general nema-toda nematoda fungi fungi fungi fungi algae unicellular eukaryota unicellular eukaryota insects insects amphibia amphibia archaea insects archaea archaea nematoda mammals mammals general general viruses mammals 45 74 28 148
soil water 5 cm 10 cm 20 cm
Hainich
Lake Hohloh
surface water
viruses
viruses
Fig. 21.Identification of phylogenetic groups in a lake and in soil water of a diverse deciduous forest (W. Schulze, 2004).
0 12.000 24.000 36.000 48.000 60.000 72.000 84.000 96.000 108.000 120.000
0 5.000 10.000 15.000 20.000 25.000 30.000 35.000
Income (GDP) [US-$ per capita and year]
Developed countries Threshold country Developing countries Singapore USA Australia France Germany Japan Hong Kong South Korea Argentina Brasilia Mexico Venezuela Malaysia South Africa a China b Indonesia c Nigeria d Benin Saudi Arabia Transformation countries 1 Ukraine 2 Belarus 3 Kazakhstan 4 Uzbekistan 5 Russia
Energy consumption per capita
[kWh per capita and year]
1 3 2 4 5 Uruguay a b c d
Fig. 22.Energy consumption per capita versus income per capita in various nations (WBGU, 2004).
expected that the underdeveloped world will request its fair share in energy supply in the future. This will be amplified by the increase of population in these countries. Global human population is expected to reach 9 Billion in 2050. Thus, it is expected, that the total energy use will increase from about 400 EJ yr−1 (about 6 Gt C yr−1)in 2004 to reach possibly more than 1700 EJ yr−1 (about 25 Gt C yr−1)in 2050. We are certain that biology will not be able to compensate such an increase in emissions, if this energy was produced from fossil fuels.
If the energy would be produced from fossil fuel, and if renewable energy came into place only after real short-age of fossil fuel becomes visible, then temperatures are expected to rise 3 to 4 K and to reach a maximum change of 0.4 K/decade. Clearly, this would damage many ecosys-tems independent of management (IPCC-WG2, 2002). It
could endanger the food supply to mankind. If one would try to maintain temperatures in a tolerable window of about 2 K change at a rate of maximal 0.2 K/decade, then dramatic changes in the energy production are required immediately. Figure 23 shows the traces of global temperature change as predicted by the A1 scenario of IPCC and the observed rate of global climate change. Presently global change exceeds the most aggressive scenario of IPCC.
Rate of temperature change [
°C/decade]
Temperature change [ °C]
0 1 2 3 4 5
0.0 0.1 0.2 0.3 0.4 0.5
BAU path
UmBAU path WBGU
climate window
2004
Fig. 23. Rate of temperature change and absolute change in
tem-perature for an energy production without change in energy source (Business as usual BAU-path) or with change in energy source towards renewable energies (UmBAU-path) according to WBGU (2004).
the only viable energy source that could be developed to an extend to meet the demand, but it remains to be seen, if the energy required to build these systems will drop to the level required to turn these systems to a net energy source.
The total energy requirement of fossil fuel is estimated to reach 25 Gt yr−1. This large number is small when compared to the carbon pools that are still stored in soils and biomass (about 2100 Gt). If only 50% were activated through land use and land use change over the next 50 years then an ad-ditional 21 Gt yr−1could potentially be emitted. This would be almost as much as the peak energy requirement in 2050, and this would undermine all attempts to solve the world’s problems with renewable energy. Thus, trying to solve the problem of global climate change without protecting terres-trial global carbon pools, and neglecting the biology of the carbon cycle will most likely fail.
9 Conclusions
I hope that this lecture will stimulate the reader to think about the significance of natural systems in the global carbon cycle. The present attempts to mitigate climate change by developing a carbon-free economy is needed, but trying to solve the problem of global climate change without protecting terrestrial global carbon pools, and neglecting the biology of the carbon cycle will most likely fail.
Edited by: T. W. Lyons
References
Aubinet, M., Heinesch, B., and Yernaux, M.: Horizontal and ver-tical CO2advection in a sloping forest, Boundary-Layer
Meteo-rol., 108(3), 397–417, 2003.
Canadell, J., Jackson, R. B., Ehleringer, J. R., Mooney, H. A., Sala, O. E., and Schulze, E.-D.: Maximum rooting depth of vegetation types at the global scale, Oecologia, 108, 583–595, 1996. Chapin III, F. S., Woodwell, G. M., Randerson, J. T., Rastetter, E.
B., Lovett, G. M., Baldocchi, D. D., Clark, D. A., Harmon, M. E., Schimel, D. S., Valentini, R., Wirth, C., Aber, J. J., Cole, M. L., Goulden, M. L., Harden, J. W., Heimann, M., Howarth, R. W., Matson, P. A., McGuire, A. D., Melillo, J. M., Mooney, H. A., Neff, J. C., Houghton, R. A., Pace, M. L., Ryan, M. G., Run-ning, S. W., Sala, O. E., Schlesinger, W. H., and Schulze, E.-D.: Rconciling Carbon-Cycle concepts, terminology, and methods, Ecosystems, in press, 2006.
Ciais, P., Janssens, I., Shvidenko, A., Wirth, C., Malhi, Y., Grace, J., Schulze, E.-D., and Heimann, M.: The potential for rising CO2to account for the observed uptake of carbon by tropical,
temperate and boreal forest biomes, in: The Carbon Balance of Forest Biomes, edited by: Griffiths, H. J. and Jarvis, P. G., Taylor and Francis, Milton Park, p. 109–150, 2005a.
Farquhar, G. D., von Cammerer, S., and Berry, J. A.: A biochem-ical model of photosynthetic CO2assimilation in leaves of C3 species, Planta, 149, 78–90, 1980.
FBW: Forschungsbeirat Waldsch¨aden/Luftverunreinigungen 3. Bericht, Kernforschungszentrum Karlsruhe, 611 pp., 1989. Field, C. and Mooney, H. A.: The photosynthesis-nitrogen
rela-tionship in wild plants, in: On the economy of plant form and function, edited by: Givnish, T. J., Cambridge University Press, Cambridge, p. 25–56, 1986.
Harden, J. W., Trumbore, S. E., Stocks, B. J., Hirsch, A., Gower, S. T., O’Neill, K. P., and Kasischke, E. S.: The role of fire in the boreal carbon budget, Global Change Biol., 6, 174–184, 2000. Harrison, A. F., Schulze, E.-D., Gebauer, G., and Bruckner, G.:
Canopy uptake and utilization of atmospheric pollutant nitrogen, Ecol. Studies, 142, 171–188, 2000.
Hector, A., Schmid, B., Beierkuhnlein, C., Caldeira, M. C., Diemer, M., Dimitrakopoulos, P. G., Finn, J. A., Freitas, H., Giller, P. S., Good, J., Harris, R., H¨ogberg, P., Huss-Danell, K., Joshi, J., Jumpponen, A., K¨orner, C., Leadley, P. W., Loreau, M., Minns, A., Mulder, C. P. H., O’Donovan, G., Otway, S. J., Pereira, J. S., Prinz, A., Reas, D. J., Scherer-Lorenzen, M., Schulze, E.-D., Sia-mantziouras, A.-S. D., Spehn, E. M., Terry, A. C., Troumbis, A. Y., Woodward, F. I., Yachi, S., and Lawton, J. H.: Plant diversity and productivity experiments in European grasslands, Science, 286, 1123–1127, 1999.
H¨ogberg, P., Nordgren, A., Buchmann, N., Taylor, A. F. S., Ekblad, A., H¨ogberg, M. N., Nyberg, G., Ottosson-L¨ovenius, M., and Read, D. J.: Large-scale forest girdling shows that current pho-tosynthesis drives soil respiration, Nature, 411, 789–792, 2001. IPCC: Climate Change 1995: The Science of Climate Change,
Cambridge University Press, Cambridge, 567 pp., 1996. IPCC: Climate Change 2001: The Scientific Basis, Cambridge
Uni-versity Press, Cambridge, 879 pp., 2002.
Janssens, I. A., Freibauer, A., Ciais, P., Smith, P., Nabuurs, G. J., Folberth, G., Schlamadinger, B., Hutjes, R. W. A., Ceule-mans, R., Schulze, E.-D., Valentini, R., and Dolman, A. J.: Eu-rope’s terrestrial biosphere absorbs 7 to 12% of European anthro-pogenic CO2emissions, Science, 300, 1538–1542, 2003.
Julou, T., Burghardt, B., Gebauer, G., Berveiller, D., Daminsin, C., and Selosse, M. A.: Mixotrophy in orchids: insight from a com-parative study of green individuals and nonphotosynthetic indi-viduals ofCephalanthera damadonium, New Phytologist, 166, 639–653, 2005.
Keeling, R. F., Piper, S. C., and Heimann, M.: Global and hemi-spheric CO2sinks deduced from changes in atmospheric O2
con-centration, Nature, 381, 218–221, 1996.
Kelliher, F. M., Leuning, R., and Schulze, E.-D.: Evaporation and canopy characteristics of coniferous forests and grasslands, Oe-cologia, 95, 153–163, 1993.
K¨orner, C.: Slow in, rapid out – Carbon flux studies and Kyoto targets, Science, 300, 1242–1243, 2003.
K¨ostner, B., Schupp, R., Schulze, E.-D., and Rennenberg, H.: Or-ganic and inorOr-ganic sulphur transport in the xylem sap and the sulfur budget ofPicea abies trees, Tree Physiology, 18, 1–9, 1998.
Lange, O. L. and Green, T. G. A.: Lichens show that fungi can acclimate their respiration to seasonal changes in temperature, Oecologia, 142, 20–27, 2005.
Lange, O. L., Heber, U., Schulze, E. D., and Ziegler, H.: Atmo-spheric pollutants and plant metabolism, Ecol. Studies, 77, 238– 276, 1989.
Lange, O. L., L¨osch, R., Schulze, E.-D., and Kappen, L.: Responses of stomata to changes in humidity, Planta, 100, 76–86, 1971. Lange, O. L., Zellner, H., Gebel, J., Schramel, P., K¨ostner, B., and
Czygan, F. C.: Photosynthetic capacity, chloroplast pigments and mineral content of previous year’s spruce needles with and with-out the new flush: analysis of the forest-decline phenomenon of needle bleaching, Oecologia, 73, 351–357, 1987.
Last, F. T. and Watling, R. (Eds.): Acidic deposition: its nature and impacts, Proc. Royal Soc. Edinburgh, 97, 1991.
Loreto, F., Delfine, S., and DiMarco, G.: Estimation of photorespi-ratory carbon dioxide recycling during photosynthesis, Austr. J. Plant Physiol., 26, 733–736, 1999.
Meyer, O: Functional groups of micoorganisms, Ecological Studies, 99, 67–96, 1993.
Odum, H. T.: Primary production in flowing waters, Limnol. Oceanogr., 2, 85–97, 1956.
Marcolla, B., Cescatti, A., Montagnani, L., Manca, G., Ker-schbaumer, G., and Minerbi, S.: Importance of advection in the atmospheric CO2exchange of an alpine forest, Ag. Forest
Mete-orol., 130, 193–206, 2005.
Oren, R. and Schulze, E.-D.: Nutritional disharmony and forest de-cline: A conceptual model, Ecol. Studies, 77, 425–444, 1989. Prentice, I. C., Farquhar, G. D., Fashham, M. J. R., Goulden, M.
L., Heimann, M., Jaramillo, V. J., Kheshgi, H. S., LeQu´er´e e, C., Scholes, R. J., Wallace, D. W. R., et al.: The carbon cycle and atmospheric carbon dioxide, Climate Change 2001: The scien-tific basis, Cambridge University Press, Cambridge, p. 183–238, 2002.
Rebmann, C., Anthoni, P. M., Falge, E., Goeckede, M., Mangold, A., Subke, J. A., Thomas, C., Wichura, B., Schulze, E.-D., Tenhunen, J., and Foken, T.: Carbon budget of a spruce
for-est ecosystem, in: Biogeochemistry of forfor-ested catchments in a changing environment: A German case study, edited by: Reb-mann, C., Anthoni, P. M., Falge, E., Goeckede, M., Mangold, A., Subke, J. A., Thomas, C., Wichura, B., Schulze, E.-D., Ten-hunen, J., Foke, T., and Matzner, E., 172, 143–159, 2004. R¨oser, C., Montagnani, L., Schulze, E.-D., Mollicone, D., Kolle,
O., Meroni, M., Papale, D., Marchesini, L. B., Federici, S., and Valentini, R.: Net CO2exchange rates in three different succes-sional stages of the “Dark Taiga“ of central Siberia, Tellus B – Chemical and Physical Meteorology, 54, 642–654, 2002. Roscher, C., Schumacher, J., Baade, J., Wilcke, W., Gleixner, G.,
Weisser, W., Schmid, B., and Schulze, E.-D.: The role of bio-diversity for element cycling and trophic interactions: an exper-imental approach in a grassland community, Basic and Applied Ecology, 5, 107–121, 2004.
Schimel, D. S., House, J. I., Hibbard, K. A., et al.: Recent patterns and mechanisms of carbon exchange by terrestrial ecosystems, Nature, 414, 169–172, 2001.
Schulze, E.-D.: Der CO2-Gaswechsel der Buche (Fagus silvatica
L.) in Abh¨angigkeit von den Klimafaktoren im Freiland, Flora, 159, 177–232, 1970.
Schulze, E.-D.: Carbon dioxide and water vapor exchange in re-sponse to drought in the atmosphere and in the soil, Ann. Rev. Plant Physiol., 37, 247–274, 1986.
Schulze, E.-D.: Der Einfluss des Menschen auf die biogeochemis-chen Kreisl¨aufe der Erde, Max Planck Forschung JV/2000, 77– 89, 2000.
Schulze, E.-D.: Forcast: Forest Carbon-Nitrogen Trajectories, EU Project EVK2-CT 1999-00035, Final Report, http://www. bgc-jena.mpg.de/bgc-processes/ceip/products/publica fr.htm, 2003.
Schulze, E.-D. (Ed.): Flux Control in Biological Systems, Aca-demic Press, 594 pp., 1994.
Schulze, E.-D., Beck, E., and M¨uller Hohenstein, K.: Plant Ecol-ogy, Springer Verlag, Heidelberg, 702 pp., 2005.
Schulze, E.-D. and Caldwell, M. M. (Eds.): Ecophysiology of pho-tosynthesis, Ecol. Studies, 100, 576 pp., 2000.
Schulze, E.-D. and Hall, A. E.: Stomatal responses, water loss and CO2assimilation rates of plants in contrasting environments, in:
Encyclopedia of Plant Physiology, edited by: Lange, O. L., No-bel, P. S., Osmond, C. B., and Ziegler, H.: Physiological Plant Ecology II, vol. 12B, Water relations and photosynthetic produc-tivity, Berlin, Heidelberg, p. 181–230, 1982.
Schulze, E.-D. and Heimann, M.: Carbon and water exchange of terrestrial systems, in: Asian change in the context of global change, edited by: Galloway, J. N. and Melillo, J., Cambridge University Press, Cambridge, 145–161, 1998.
Schulze, E.-D., Kelliher, F. M., K¨orner, Ch., Lloyd, J., and Leun-ing, R.: Relationships among maximum stomatal conductance, carbon assimilation rate, and plant nitrogen nutrition: A global ecology scaling exercise, Ann. Rev. Ecol. System, 25, 629–660, 1994.
Schulze, E.-D., Steudle, E., Gollan, T., and Schurr, U.: Response to Dr. P. J. Kramer’s article, “Changing concepts regarding plant water relations”, 11, 7, 565–568, Plant, Cell, Environ., 11, 573– 576, 1988.
Schulze, E.-D., Lange, O. L., and Oren, R. (Eds.): Forest decline and air pollution, Ecol. Studies, 77, 475, 1989.
Schulze, E.-D., Wirth, C., and Heimann, M.: Managing forests after Kyoto, Science, 289, 2058–2059, 2000.
Schulze, E.-D., Wirth, C., and Heimann, M.: Carbon fluxes of the Eurosiberian region, Environment Control in Biology, 40, 249– 258, 2002.
Schulze, W. X.: Environmental proteomics – what proteins from soil and surface water can tell us: a perspective, Biogeosciences Discuss., 1, 195–218, 2004.
Schulze, W. X., Gleixner, G., Kaiser, K., Guggenberger, G., Mann, M., and Schulze, E.-D.: A proteomic fingerprint of biodiver-sity, Oecologia, 142, 335–343, doi:10.1007/s00442-004-1698-9, 2004.
Science: Soils: The final frontier, Special Issue, 304, 1614–1637, 2004.
Slatyer, R. O.: Plant-water relationships, Academic Press, London, 366 pp., 1967.
Stitt, M.: Flux control at the level of the pathway: Studies with mutants and transgenic plants having a decreased activity of en-cymes involved in photosynthetic partitioning, in: Flux control in biological systems; From Enzymes to populations and ecosys-tems, edited by: Schulze, E.-D., Academic Press, San Diego, p. 13–36, 1993.
Stitt, M. and Schulze, E.-D.: Plant growth, storage, and resource allocation: From flux control in a metabolic chain to the whole-plant level, in: Flux control in biological systems; From En-zymes to populations and ecosystems, edited by: Schulze, E.-D., Academic Press, San Diego, p. 57–118, 1993.
Swinbank, W. C.: The measurement of vertical transfer of heat and water vapor by eddies in the lower atmosphere, J. Met., 8, 135– 145, 1951.
Thompson, K., Askew, A. P., Grime, J. P., Dunnett, N. P., and Willis, A. J.: Biodiversity, ecosystem functioning and plant traits in ma-ture and immama-ture communities, Functional Ecology, 19, 355– 358, 2005.
Trebon: Prediction and measurement of photosynthetic productiv-ity, Proceedings of the IBP/PP technical meeting, Trebon, 14–21 September 1969, Pudoc, Wageningen, 632 pp., 1970.
Turner, N. C., Schulze, E.-D., and Gollan, T.: The responses of stomata and leaf gas exchange to vapour pressure deficits and soil water content. II, in: the mesophytic herbaceous species He-lianthus annuus, Oecologia, 65, 348–355, 1985.
Tyermann, S. D., Bohnert, H. J., Maurel, C., Steudle, E., and Smith, J. A.: Plant aquaporins: their molecular biology, biophysics and significance for plant water relations, J. Exp. Bot, 50, 1055– 1072, 1999.
Ulrich, B.: Stability, elasticity, and resilience of terrestrial ecosys-tems with respect to matter balance, Ecol. Studies, 61, 11–49, 1987.
Valentini, R., Matteucchi, G., Dolman, H., Schulze, E.-D., Reb-mann, C., Moors, E. J., Granier, A., Gross, P., Jensen, N. O., Pilgaard, K., Lindroth, A., Grelle, A., Bernhofer, C., Gr¨unwald, T., Aubinet, M., Ceulemans, R., Kowalski, A. S., Vesala, T., Ran-nik, ¨U., Berbigier, P., Lousteau, D., Gudmundsson, J., Thorgairs-son, H., Ibrom, A., Morgenstern, K., Clement, R., Moncrieff, J., Montagnani, L., Minerbi, S., and Jarvis, P. G.: Respiration as the main determinant of carbon balance in European forests, Nature, 404, 861–865, 2000.
VanDijk, A. I. J. M., Dolman, A. J., and Schulze, E.-D.: Radia-tion, temperature, and leaf area explain ecosystem carbon fluxes in boreal and temperate European forests, Global Biogeochem. Cycles, 19, GB2029, doi:10.1029/2004GB002417, 2005. Vetter, M., Wirth, C., B¨ottcher, H., Churkina, G., Schulze, E. D.,
Wutzler, T., Weber, G.: Partitioning and indirect human-induced effects on carbon sequestration of managed coniferous forests using model simulations and forest inventories, Global Change Biology, 11, 810–827, 2005.
Vygodskaya, N. N., Milukova, I., Varlagin, A., Tatarinov, F., Sor-gachev, A., Kobak, K. I., Desyatkin, R., Bauer, G., Hollinger, D. Y., Kelliher, F. M., and Schulze, E.-D.: Leaf conductance and CO2 assimilation ofLarix gmelinii growing in an eastern Siberian boreal forest, Tree Physiol., 17, 607–615, 1996. Walker, B. and Steffen, W.: Global Change and terrestrial
ecosys-tems, IGBP Book Series vol 2, Cambridge University Press, Cambridge, 619 pp., 1996.
WBGU: World in transition: Towards sustainable energy systems, German Advisory Council on Global Change (WBGU), Earth-scan, London, 242 pp., 2004.