AbstrAct: This study aimed to evaluate the effect of the high and low molecular weight glutenin subunits on the grain traits of sixteen Brazilian wheat genotypes. Grain hardness index, milling traits, physicochemical and rheological properties of the flour, and specific volume and firmness of the bread were evaluated. Physicochemical properties of the flour were not influenced by glutenin subunits. Genotypes with subunits at the Glu-B1 (17+18 or 7+8), Glu-D1 (5+10), and Glu-A3 (b) were associated with strong flours and bread with high specific volume and low firmness. The subunits at the Glu-A1 and Glu-B3 had no effect on the rheological properties of the dough
bAsic AreAs -
Article
Effect of glutenin subunits on the baking
quality of Brazilian wheat genotypes
Mariana Souza Costa1*, Maria Brígida dos Santos Scholz2, Martha Zavariz Miranda3, Célia Maria
Landi Franco4
1. Universidade Estadual Paulista “Júlio de Mesquita Filho” - Departamento de Engenharia e Tecnologia de Alimentos - São Paulo (SP), Brazil.
2. Instituto Agronômico do Paraná - Londrina (PR), Brazil. 3. Embrapa Trigo - Passo Fundo (RS), Brazil.
4. Universidade Estadual Paulista “Júlio de Mesquita Filho” - Departamento de Engenharia e Tecnologia de Alimentos - São José do Rio Preto (SP), Brazil.
*Corresponding author: [email protected]
Received: Dec. 15, 2015 – Accepted: Mar. 28, 2016
and bread quality, while the subunit 2+12 at Glu-D1 negatively affected the resistance to extension, and specific volume and firmness of the bread. Specific volume and firmness of the bread were influenced by the rheological properties of the dough, while the flour protein content was not important to define wheat quality. The identification of glutenin subunits at different loci along with the rheological tests of the flour are fundamental in estimating the potential use of different materials developed in wheat breeding.
iNtrODUctiON
The wheat storage proteins (gliadin and glutenin) are the main components of gluten and determine the technological characteristics of different bakery products (Li et al. 2010). Glutenin can be separated into high-molecular-weight (HMW-GS) and low-molecular-weight (LMW-GS) subunits. HMW-GS are encoded by Glu-A1, Glu-B1, and Glu-D1 loci on the long arms of chromosomes 1A, 1B, and 1D, respectively, while LMW-GS are encoded by Glu-A3, Glu-B3, and Glu-D3 loci on the short arms of chromosomes 1A, 1B, and 1D, respectively (Payne et al. 1987). It has been noted that allelic differences in the composition of HMW-GS and LMW-GS induce changes in the structure and properties of the glutenin polymers and, consequently, the baking quality (Payne et al. 1987; Shewry et al. 2003). The wheat genes that encode HMW-GS constitute 5 to 10% of the grain storage proteins and are related to the strength and elasticity of the dough (Shewry et al. 2003; Blechl and Vensel 2013).
Several studies have reported the effect of HMW-GS on the wheat quality characteristics. The Glu-D1 locus has been reported as the one that has the greatest effect on the rheological properties and baking quality of the flour. The 5+10 alleles at this locus have been associated with flours with more suitable viscoelastic properties for bread making and that also result in bread with higher volume (Payne et al. 1987; Luo et al. 2001; Liang et al. 2010; Li et al. 2010; Hernández et al. 2012; Blechl and Vensel 2013). Vázquez et al. (2012) reported that 1 and 2* alleles at Glu-A1 are also associated with greater gluten strength and good baking quality, while Peña et al. (2005) found that 17+18 and 7+8 alleles at Glu-B1 are also associated with high bread volume, especially the 17 allele, which has a positive effect on the rheological properties of the flour.
For the LMW-GS, several authors have observed that Glu-A3d, Glu-B3b and Glu-B3g subunits also stand out for their positive effect on baking quality (Luo et al. 2001; Branlard et al. 2003; Liang et al. 2010). In breeding programs, these subunits would also be desirable when selecting wheat with high gluten strength.
At the early stages of the breeding programs, rapid and specific tests (sedimentation volume, sedimentation index, and gluten protein subunits) are used to evaluate the physicochemical and genetic characteristics of wheat. However, a better characterization of wheat flour is achieved by evaluating the visco-elastic properties of the dough.
The effect of HMW-GS and LMW-GS on the grain physicochemical characteristics of the 16 Brazilian wheat genotypes was evaluated in a previous study (Costa et al. 2013). Among the genotypes evaluated those that had subunits 1 at Glu-A1, 5+10 at Glu-D1, c at Glu-A3, and b or
g at Glu-B3 stood out from the others because they resulted in a superior grain quality for bread making. Generally, these subunits are preferred in breeding programs for developing new materials with adequate gluten strength and extensibility for bread. The aim of this study was to evaluate the effect of the high and low molecular weight glutenin subunits on the physicochemical wheat grain traits, the rheological characteristics and the baking quality of the flour for 16 Brazilian wheat genotypes.
MAteriAL AND MetHODs
Four wheat cultivars (IAPAR 78, IPR 85, IPR 130, and IPR Catuara TM) and 12 advanced lines (LD 101108, T 081099, T 091006, T 091008, T 091015, T 091027, T 091028, T 091031, T 091033, T 091056, T 091069, and T 091088) from the 2010 harvest obtained from cross blocks from the experimental station at the Paraná Agricultural Institute (IAPAR) in Londrina, Paraná, Brazil, were used. Each experimental plot consisted of 5 rows each 6 m long and with 0.17 m between rows, giving a total area of 5.1 m2.
Granular fertilizer (350 kg∙ha−1, N-P-K, 04-30-10) was
used at sowing. Controls for pests, diseases and weeds were performed when necessary. The harvest was carried out when the grains reached physiological maturity (stage 11.4, Feekes scale) and the grains were stored at 13% moisture content. For the laboratory experiment, 6 kg of grains of each material were separated and stored in a cold chamber at 4 °C until the moment of use.
The identification of HMW-GS and LMW-GS in these same genotypes has been performed and described previously (Costa et al. 2013). In HMW-GS, 4 allelic variations were observed at Glu-A1 [subunits 2* (43.8%), 1 (37.5%), Null (12.5%), and 1/2* (6.2%)], 5 at Glu-B1 [subunits 7+9 (50.0%), 7+8 (37.5%), and 17+18 (12.5%)], and 4 at Glu-D1 [subunits 5+10 (81.3%), 2+12 (18.7%)]. In LMW-GS, 3 allelic variations were observed at Glu-A3 [c (56.3%), d (25.0%), and b (18.7%]) and 5 at Glu-B3 [b (33.3%), h (25.0%), e (16.7), f (16.7%), and
in the IAPAR 78 cultivar. The total score of the genotypes, calculated based on the identification of HMW-GS (Payne et al. 1987), varied between 5 and 10.
Grain hardness index and wheat milling
The grain hardness index was analyzed using the Single Kernel Characterization System (model 4100, Perten Instruments, Hägersten, Sweden) according to the Approved Method 55-31 of the American Association of Cereal Chemists (AACC 2000). All dockage was removed from the samples using a seed cleaner and 20 g of seed was used for analysis. The moisture content of the grains ranged from 9.3 to 10.6%. Grain hardness was classified from extra hard to extra soft (AACC 2000).
Grains were conditioned for 16 h until reaching 16% moisture and milled in a Chopin mill (model CD1, Chopin Technologies, Villeneuve-la-Garenne, France) following the manufacturer instructions. The flour yield was calculated according to the AACC method 26-10 (AACC 2000).
Physicochemical and rheological characterization of the flour
The protein content (N% × 5.7) was evaluated using the Kjeldahl method according to the AACC method 46-30 (AACC 2000) and damaged starch content was determined using the Chopin SDmatic (Chopin Technologies, Villeneuve-la-Garenne, France) according to the AACC method 76-33 (AACC 2000).
The CIELAB system was used to determine the flour color using a colorimeter (Chromo Meter CR-400, Konica Minolta, Tokyo, Japan). The equipment was calibrated with the standard provided by the manufacturer and adjusted for measuring the luminosity (L*) and the chromatic components green/red (a*) and blue/yellow (b*).
The solvent retention capacity (SRC) test was performed according to the AACC method 56-11 (AACC 2000). Samples of 5 g of wheat flour were suspended in 25 g of 5% sodium carbonate (Na2CO3)solution, 25 g of 50% sucrose (C12H22O11) solution, and 25 g of 5% lactic acid (C3H6O3)solution. The samples were stirred for 25 min and centrifuged at 1,000 g for 15 min. The precipitates were weighed and the SRC was calculated as the sum of the precipitate weight less the original flour weight divided by the original flour weight multiplied by 100. Units were expressed as %.
Farinograph analysis was performed using a 300 g (14% moisture basis) Farinograph (Brabender OHG, Duisburg, Germany) according to the AACC method 54-21 (AACC 2000). The water absorption rate (%), dough development time (min), dough stability (min), and mixing tolerance index (Brabender units — BU) were determined. Extensograph analysis was performed using an Extensograph (Brabender OHG, Duisburg, Germany) according to the AACC method 54-10 (AACC 2000). The dough resistance to constant deformation after 50 mm stretching (BU), extensibility (mm), and maximum resistance (BU) were determined at 45, 90, and 135 min.
Bread making
Bread dough was formulated with the following ingredients: dry yeast (Saccharomyces cerevisae) (2%), salt (1.5%), sugar (4%), hydrogenated vegetable fat (3%) and water (60%) following the procedure described by Oliveira et al. (2014). The weight of ingredients was based on the weight of the flour. Flour, sugar and fat were mixed for 1 min in a planetary mixer (model BP-12SL, Lieme, Caxias do Sul, Brazil). Yeast and most of the water (90%) were then added to the dough and mixed for 1 min. Finally, the salt diluted with the remaining water was added to the dough, mixed for approximately 15 min for gluten development. The dough was left to set for 15 min at 32 °C and 80% relative humidity, divided into 100 g portions and then left to set for another 15 min before being rolled and mechanically shaped (MQ, Universo, São Paulo, Brazil) and placed in baking pans (15 × 8 cm). The dough was then proofed at 32 °C for 1 h and baked at 180 °C in an industrial oven (Pasiani, Itajobi, Brazil) for 15 min. After baking, the loaves were cooled for 2 h at room temperature before analysis.
The bread volume was measured using rapeseed displacement according to the AACC method 10-05 (AACC 2000). The specific volume of the bread was calculated as the ratio between the volume and the weight of the bread (cm3∙g−1). Six replicates of each sample were
needed to compress a bread crumb sample to 40% of its original height using a probe that was 25 mm in diameter and at 5 s intervals between compressions. Ten replicates of each sample were analyzed.
Statistical analysis
The experimental design for the physicochemical and rheological analyses was completely randomized and three or more repetitions were carried out according to specific methodology. Analysis of variance (ANOVA) and Tukey’s test (p < 0.05) were used for comparison of means (Statistica 7.0, STATSOFT 2007). Pearson’s correlation among different parameters of quality of grain, flour and bread was performed from the standardized means (Statistica 7.0). Principal component analysis (PCA) and cluster analysis were performed using XLstat, version 2010. The data for the central point were taken to be the means of the analysis. The PCA was performed with a correlation matrix and without factor rotation. The means of the physicochemical and rheological characteristics of the flour, and specific volume and firmness of the bread were fixed in columns (variables) and the different genotypes in rows (cases), and the data were standardized before analysis.
resULts AND DiscUssiON
Grain hardness index and wheat milling
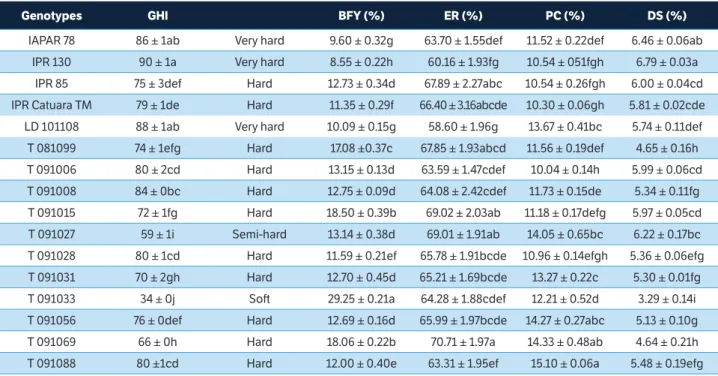
The grain hardness index (GHI) of the different genotypes varied from 34 to 90 (Table 1). Most of the genotypes (87.5%) were found to have hard and very hard textures except for the T 091027 and T 091033 lines, which were found to have semi-hard and soft textures, respectively. The hardness of wheat is affected mainly by starch and protein contents and their ordering in the endosperm of the grain (Pomeranz and Williams 1990). According to Pauly et al. (2013), the presence and functionality of the puroindoline a (PINA) and b (PINB) proteins together with polar lipids determine the wheat endosperm texture. The level of hardness determines the wheat milling conditions because it indicates the grain resistance to fracturing and reducing to flour (Kaur et al. 2013). Harder texture grains require greater force to be disintegrated and thus provide flour with heavier, larger, and more homogeneous particles, whereas soft texture grains result in flour with lighter particles and irregular fragments stuck to each other (Hrušková and Švec 2009). The extraction rate of flour (ER) ranged from 58.6 to 70.7% for LD 101108 and T 091069 lines, respectively, while the break flour yield (BFY) ranged from 8.5 to 29.2% among
Genotypes GHi bFY (%) er (%) Pc (%) Ds (%)
IAPAR 78 86 ± 1ab Very hard 9.60 ± 0.32g 63.70 ± 1.55def 11.52 ± 0.22def 6.46 ± 0.06ab
IPR 130 90 ± 1a Very hard 8.55 ± 0.22h 60.16 ± 1.93fg 10.54 ± 051fgh 6.79 ± 0.03a
IPR 85 75 ± 3def Hard 12.73 ± 0.34d 67.89 ± 2.27abc 10.54 ± 0.26fgh 6.00 ± 0.04cd
IPR Catuara TM 79 ± 1de Hard 11.35 ± 0.29f 66.40 ± 3.16abcde 10.30 ± 0.06gh 5.81 ± 0.02cde
LD 101108 88 ± 1ab Very hard 10.09 ± 0.15g 58.60 ± 1.96g 13.67 ± 0.41bc 5.74 ± 0.11def
T 081099 74 ± 1efg Hard 17.08 ±0.37c 67.85 ± 1.93abcd 11.56 ± 0.19def 4.65 ± 0.16h
T 091006 80 ± 2cd Hard 13.15 ± 0.13d 63.59 ± 1.47cdef 10.04 ± 0.14h 5.99 ± 0.06cd
T 091008 84 ± 0bc Hard 12.75 ± 0.09d 64.08 ± 2.42cdef 11.73 ± 0.15de 5.34 ± 0.11fg
T 091015 72 ± 1fg Hard 18.50 ± 0.39b 69.02 ± 2.03ab 11.18 ± 0.17defg 5.97 ± 0.05cd
T 091027 59 ± 1i Semi-hard 13.14 ± 0.38d 69.01 ± 1.91ab 14.05 ± 0.65bc 6.22 ± 0.17bc
T 091028 80 ± 1cd Hard 11.59 ± 0.21ef 65.78 ± 1.91bcde 10.96 ± 0.14efgh 5.36 ± 0.06efg
T 091031 70 ± 2gh Hard 12.70 ± 0.45d 65.21 ± 1.69bcde 13.27 ± 0.22c 5.30 ± 0.01fg
T 091033 34 ± 0j Soft 29.25 ± 0.21a 64.28 ± 1.88cdef 12.21 ± 0.52d 3.29 ± 0.14i
T 091056 76 ± 0def Hard 12.69 ± 0.16d 65.99 ± 1.97bcde 14.27 ± 0.27abc 5.13 ± 0.10g
T 091069 66 ± 0h Hard 18.06 ± 0.22b 70.71 ± 1.97a 14.33 ± 0.48ab 4.64 ± 0.21h
T 091088 80 ±1cd Hard 12.00 ± 0.40e 63.31 ± 1.95ef 15.10 ± 0.06a 5.48 ± 0.19efg
table 1. Grain hardness index, break flour yields, extraction rate, protein content and damage starch of the flours from different genotypes*.
the different genotypes (Table 1). The wheat genotypes that had a very hard texture (IAPAR 78, IPR 130, and LD 101108) produced a low BFY. There was a strong negative correlation (r= −0.89, p < 0.05, Table 2) between BFY and GHI of the different genotypes. These results indicate that the soft texture of the grains was determinant for the higher BFY.
Physicochemical and rheological characteristics of the wheat flours
The protein content (PC) of the wheat flours varied from 10.04 to 15.10%. An interesting fact to highlight is the high PC (> 14%) for the T 091056, T 091069, T 091027, and T 091088 lines (Table 1). Although there was a large variation in flour protein contents for different genotypes, there was no correlation between PC and GHI or between PC and ER. The damaged starch (DS) content varied significantly among the samples, with values between 3.29 and 6.79% (Table 1). During milling of the grains the endosperm is reduced to small particle size, and some starch granules are mechanically damaged. This damage influences the physicochemical and rheological characteristics of the dough
(Hrušková and Švec 2009). As expected, the grains classified as having hard and very hard textures (GHI > 65) produced more DS (r = 0.79, p < 0.05, Table 2). According to Pomeranz and Williams (1990) and Hrušková and Švec (2009), the texture of the grain affects the particle size distribution and damaged starch content and thus alters the quality of the final product. Hard texture grain flour contains larger amount of damaged starch. The presence of DS is desirable up to a certain amount (about 8%) for bread making, especially in recipes without added sugar. DS is susceptible to amylolytic enzymes, thus providing fermentable sugars to the yeast in sufficient amounts to maintain the fermentation (Pauly et al. 2013).
The flours from T 081099, T 091006, T 091027, and T 091033 lines were found to have the lightest colors (L* > 94), and the flours from IAPAR 78 and T 081099 genotypes, the highest b* values (> 10) (Table 3). There were positive and negative weak correlations between L* and BFY (r = 0.54, p < 0.05, Table 2) and between L* and GHI (r = −0.62, p < 0.05, Table 2), respectively. However, there was no correlation between the color parameters and ER or between the color parameters and PC. These results suggest
Variables GHi bFY er Pc Ds L* b* Na2cO3 src suc src LA src
GHI 1.00*
BFY -0.89* 1.00*
ER -0.43 0.37 1.00*
PC -0.23 0.08 0.07 1.00*
DS 0.79* -0.90* -0.29 -0.28 1.00*
L* -0.62* 0.54* 0.07 -0.11 -0.47 1.00*
b* 0.28 -0.24 -0.17 0.27 0.04 -0.07 1.00*
Na2CO3SRC 0.26 -0.51* -0.31 -0.08 0.68* -0.02 -0.05 1.00*
Suc SRC 0.49 -0.64* -0.38 0.03 0.73* -0.45 -0.02 0.81* 1.00*
LA SRC -0.07 -0.09 0.08 0.40 0.13 -0.11 -0.17 0.06 0.22 1.00*
TS -0.06 -0.10 0.24 0.14 0.12 -0.24 -0.49 0.21 0.35 0.24
WA 0.75* -0.81* -0.46 0.08 0.78* -0.58* 0.19 0.60* 0.74* -0.05
DT 0.32 -0.29 -0.09 0.26 0.18 -0.26 -0.04 0.02 0.32 0.42
ST 0.23 -0.24 -0.25 0.31 0.12 -0.10 0.35 0.17 0.20 0.21
MTI -0.20 0.32 0.02 -0.38 -0.26 0.02 -0.01 -0.12 -0.12 -0.43
RE -0.24 -0.01 0.24 0.14 0.15 0.27 -0.38 0.54* 0.39 0.26
MR -0.27 0.11 0.28 0.17 -0.07 -0.10 -0.34 0.16 0.36 0.50*
EXT 0.10 0.13 0.08 -0.10 -0.27 -0.30 -0.06 -0.64* -0.44 -0.04
SV -0.33 0.18 0.36 0.26 -0.17 -0.06 -0.39 0.00 0.19 0.37
FB -0.46 0.28 0.14 -0.07 -0.26 0.62 -0.18 -0.16 -0.40 0.39
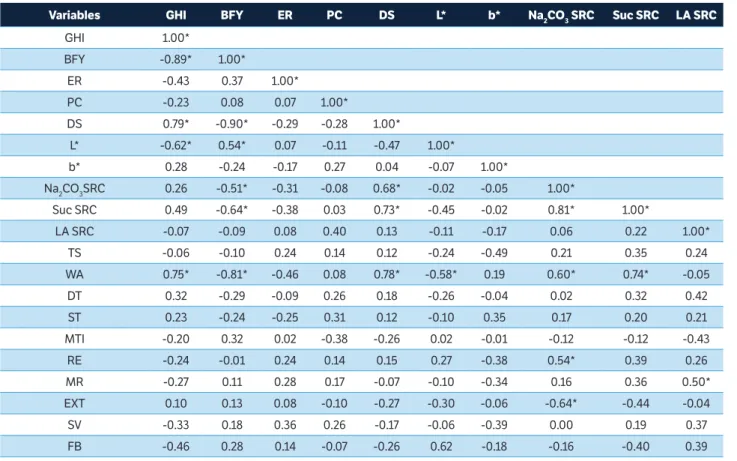
table 2. Pearson correlation between grain, flour, and bread characteristics.
that the color of the flour was mainly influenced by the degree of ordering of starch and protein in the grain.
The solvent retention capacity profile allows evaluating the functional contribution of each wheat flour component. The sodium carbonate retention capacity (Na2CO3 SRC) is associated with the DS level of the flour, while the sucrose retention capacity (Suc SRC) helps to evaluate the functional contribution of arabinoxylans on the quality of the final product (Guttieri et al. 2001). The Na2CO3 SRC ranged from 68.4 to 95.6% (Table 3). A comparison between these data and the DS contents revealed that the materials that had a higher Na2CO3 SRC content also exhibited a higher DS content (r= 0.68, p < 0.05, Table 2). The Suc SRC ranged from 74.5 to 91.1% (Table 3) and had a positive correlation with DS (r = 0.73, p < 0.05, Table 2) and a weak negative correlation with BFY (r = −0.64, p < 0.05, Table 2). Arabinoxylans, present mainly in the wheat grain aleurone layer, are incorporated into the flour during the milling process. When combined with DS, they increase the amount of water that can be absorbed by the flour. This increase in water absorption up to a certain limit is a desirable feature for bread making (Kweon et al. 2011). Lactic acid retention capacity (LA SRC) is associated with the glutenin fraction of gluten proteins. The LA SRC ranged from 101.8 to 159.9% (Table 3), values which indicate high variability in gluten strength among the different studied wheat genotypes.
Water absorption (WA) is influenced by the components of flour, particularly by proteins, damaged starch, and arabinoxylans (Kweon et al. 2011). In this study, the wheat flours had WA values between 56.4 and 70.2% (Table 4).
There was no correlation between WA and PC; however, WA was positively correlated with DS content (r = 0.78, p < 0.05, Table 2), with Na2CO3 SRC (r = 0.60, p < 0.05), and with Suc SRC (r= 0.74, p < 0.05). The dough development time (DT) ranged from 2.3 to 9.5 min (Table 4). The IPR 85, LD 101108, and T 091088 genotypes had the highest DT. Flour stability (ST) varied from 3 to 44 min, while the mixing tolerance index (MTI) varied from 40 to 120 BU. ST was negatively correlated with the MTI (r = −0.66, p < 0.05, Table 2) and was positively correlated with DT (r = 0.76, p < 0.05). Resistance to extension (RE) varied from 284 to 847 BU, while extensibility (EXT) varied from 131 to 221 mm (Table 4). The IPR 130, IPR 85, IPR Catuara TM, T 091015, T 091031, and T 091088 genotypes had more elastic flours (RE > 500 BU). The flours from IPR 130 cultivar and T 091088 and T 091015 lines had the lowest EXT. The maximum resistance (MR) of the samples ranged from 360 to 950 BU, with the exception of the IPR 85 cultivar and T 091015 line that had MR higher than 1000 BU (Table 4).
The PC did not affect the rheological characteristics of the dough (Table 2), indicating that, in the case of the Brazilian genotypes studied, the protein quality was more important than the protein content itself. Vázquez et al. (2012) studied the effect of genotype, environment, and the interaction between them on the quality of wheat produced in Latin America. These authors did not find any correlation between the protein content and quality parameters of the grain and flour in Brazilian wheat genotypes, either.
Variables ts WA Dt st Mti re Mr eXt sV Fb
TS 1.00*
WA 0.03 1.00*
DT 0.51* 0.02 1.00*
ST 0.25 0.01 0.76* 1.00*
MTI -0.20 -0.07 -0.71* -0.66* 1.00*
RE 0.63* -0.08 0.39 0.39 0.38 1.00*
MR 0.75* -0.21 0.47 0.20 -0.01 0.58* 1.00*
EXT -0.23 -0.08 -0.15 -0.43 0.30 -0.73* -0.16 1.00*
SV 0.60* -0.29 0.53* 0.20 -0.33 0.66* 0.75* -0.22 1.00*
FB -0.20 -0.55* -0.16 -0.13 -0.08 0.06 0.05 -0.06 0.05 1.00*
table 2. Continuation...
Genotypes cieLAb color parameters Na2cO3 src (%)
suc src (%)
LA src
(%) ts
L* a* b*
IAPAR 78 93.64 ± 0.01def -0.54 ± 0.01i 10.93 ± 0.06a 91.6 ± 0.8a 88.8 ± 0.2ab 101.8 ± 1.4i 5
IPR 130 93.72 ± 0.03de -0.63 ± 0.01e 8.90 ± 0.06d 93.5 ± 0.6a 91.1 ± 0.3a 121.1 ±1.6fg 9
IPR 85 93.59 ± 0.06ef +0.26 ± 0.00b 7.72 ± 0.04g 85.2 ± 0.1bc 88.9 ± 1.4ab 130.9 ± 4.3de 10
IPR Catuara TM 93.75 ± 0.02de +0.28 ± 0.02b 7.76 ± 0.03g 81.8 ± 1.0bcd 84.6 ± 1.1bcde 125.9 ± 2.0ef 10
LD 101108 93.41 ± 0.01g -0.14 ± 0.01f 9.34 ± 0.03c 85.5 ± 0.6b 88.2 ± 0.3ab 138.2 ± 0.1c 9
T 081099 94.56 ± 0.04c -0.99 ± 0.01j 10.87 ± 0.05a 68.4 ± 0.1g 74.5 ± 0.4h 111.8 ± 0.1h 7
T 091006 94.68 ± 0.04b -0.22 ± 0.01g 8.34 ± 0.04e 79.1 ± 0.1de 78.7 ± 1.0fgh 133.0 ± 0.2i 7
T 091008 93.80 ± 0.03d +0.06 ± 0.01d 7.86 ± 0.04g 76.3 ± 0.1ef 82.0 ± 0.5def 159.9 ± 0.6a 5
T 091015 93.22 ± 0.06h +0.28 ± 0.02b 8.14 ± 0.02f 79.9 ± 0.0de 85.6 ± 2.1bcde 111.7 ± 1.8cd 10
T 091027 95.04 ± 0.08b -0.35 ± 0.00h 7.37 ± 0.05h 95.6 ± 4.7a 85.9 ± 3.0bcd 117.0 ± 0.0b 10
T 091028 92.94 ± 0.01i +0.04 ± 0.01d 9.44 ± 0.04c 79.6 ± 0.4de 81.4 ± 0.5efg 117.6 ± 0.0h 9
T 091031 93.20 ± 0.06h +0.50 ± 0.02a 7.38 ± 0.02h 75.9 ± 0.3ef 83.5 ± 0.4cde 157.8 ± 0.8b 9
T 091033 95.42 ± 0.06a -0.56 ± 0.01i 7.69 ± 0.10g 76.1 ± 0.6ef 77.3 ± 0.2gh 126.8 ± 0.5gh 7
T 091056 93.20 ± 0.02h -0.24 ± 0.00g 9.83 ± 0.03b 78.9 ± 1.0de 83.6 ± 0.0cde 117.6 ± 0.6g 7
T 091069 93.54 ± 0.01fg -0.04 ± 0.01e 8.85 ± 0.02d 73.1 ± 0.4fg 80.0 ± 0.5fg 126.8 ± 0.5e 9
T 091088 93.39 ± 0.14g +0.12 ± 0.03c 8.39 ± 0.18e 80.3 ± 0.0cde 87.4 ± 0.3abc 135.3 ± 0.2cd 10
table 3. Color parameters, solvent retention capacity and total score of the flours from different wheat genotypes*.
*Average of 3 replicates ± standard deviation. Different letters in the same column are significantly different (p ≤ 0.05). L* = Luminosity; a* = Chromaticity coordinate of red/green (red positive and green negative); b* = Chromaticity coordinate of yellow/blue (yellow positive and blue negative); Na2CO3 SRC = Sodium carbonate retention capacity; Suc SRC = Sucrose retention capacity; LA SRC = Lactic acid retention capacity; TS = Total score.
Genotypes WA
(%)
Dt (min)
st (min)
Mti (bU)
re (bU)
Mr (bU)
eXt (mm)
sV** (cm3∙g−1)
bF*** (N)
IAPAR 78 70.2a 2.3 ± 0.0i 7.2 ± 0.2gh 100 ±
0ab 300 ± 13hi 360 ± 14e 166 ± 8hi 3.13 ± 0.10i 2.98 ± 0.05c
IPR 130 67.8b 6.9 ± 0.1cd 12.9 ± 0.3def 80 ± 0bc 555 ± 19c 768 ± 37b 156 ± 16i 4.52 ± 0.12a 1.93 ± 0.08efg
IPR 85 64.8f 9.5 ± 0.7a 23.5 ± 0.5c 50 ± 14de 690 ± 34b >1000 170 ± 8ghi 4.07 ± 0.11bc 1.71 ± 0.01fg
IPR Catuara
TM 61.8j 8.2 ± 0.2b 43.8 ± 2.1a 60 ± 0cde 510 ± 20cd 910 ± 33a 185 ± 7efg 3.70 ± 0.06defg 3.01 ± 0.06c
LD 101108 67.8b 9.0 ± 0.0ab 40.0 ± 1.0a 60 ± 0cde 460 ± 0def 770 ± 42b 189 ± 8cdefg 3.77 ± 0.10bcdefg 1.69 ± 0.06fg
T 081099 58.2k 7.2 ± 0.2c 43.8 ± 2.3a 65 ± 0cde 420 ± 16fg 550 ± 14c 172 ± 6fghi 3.60 ± 0.13fgh 3.11 ± 0.07c
T 091006 63.6h 3.0 ± 0.0hi 2.7 ± 0.5h 110 ± 14a 338 ± 15h 450 ± 17cd 203 ± 8bd 3.69 ± 0.18dfg 4.48 ± 0.08a
T 091008 65.4e 7.2 ± 0.2c 16.1 ± 0.1de 40 ± 0e 333 ± 12hi 510 ± 23c 215 ± 7ab 3.29 ± 0.13hi 4.23 ± 0.20a
T 091015 63.6h 6.0 ± 0.0e 9.2 ± 1.2fg 120 ± 0a 847 ± 31a >1000 131 ± 5j 4.02 ± 0.07bcde 2.08 ± 0.12de
T 091027 66.0d 6.3 ± 0.0cde 31.1 ± 0.4b 40 ± 0e 410 ± 14fg 915 ± 38a 184 ± 2efgh 3.60 ± 0.15gh 3.60 ± 0.20b
T 091028 64.2g 4.0 ± 0.0g 3.0 ± 0.4h 70 ± 14cd 284 ± 9i 432 ± 13de 207± 10abcd 3.76 ± 0.01cdefg 2.35 ± 0.12d
T 091031 63.0i 5.0 ± 0.0f 10.4 ± 1.7fg 100 ± 0ab 507 ± 12cd 950 ± 37a 191 ± 8cde 3.81 ± 0.16bcdefg 3.833 ± 0.20b
T 091033 56.4l 3.4 ± 0.1gh 9.4 ± 0.5fg 100 ± 0ab 475 ± 19de 720 ± 30b 173 ± 7fghi 3.96 ± 0.13bcdef 3.61 ± 0.18b
T 091056 64.8f 6.2 ± 0.2 de 18.2 ± 0.1de 80 ± 0bc 445 ± 19ef 728 ± 29b 187 ± 5cdef 4.12 ± 0.14b 1.99 ± 0.07ef
T 091069 63.6h 7.2 ± 0.2c 11.5 ± 3.5efg 50 ± 14de 396 ± 17g 718 ± 22b 221 ± 9a 3.95 ± 0.13bcdef 1.62 ± 0.04g
T 091088 67.4c 9.2 ± 0.2a 32.5 ± 0.7b 40 ± 0e 560 ± 28c 720 ± 17b 156 ± 9i 4.02 ± 0.18bcd 2.18 ± 0.12de
table 4. Flour rheological parameters, bread specific volume, and bread firmness from different wheat genotypes*.
*Average of 3 replicates ± standard deviation. Different letters in the same column are significantly different (p ≤ 0.05); **Average of 6 replicates; ***Average of 10
Baking quality
The loaves from different genotypes exhibited specific volumes (SV) that ranged from 3.13 to 4.52 cm3∙g−1 for IAPAR
78 and IPR 130 cultivars, respectively (Table 4). SV was positively correlated with DT (r = 0.53, p < 0.05, Table 2), RE (r = 0.66, p < 0.05), and MR (r = 0.75, p < 0.05). According to Williams et al. (1988), the most suitable farinograph parameters for bread were found to be: DT (8 – 10 min), ST (10 – 15 min), and MTI (0 – 49 BU). Furthermore, suitable extensograph parameters were found to be: RE (250 – 350 BU) and EXT (140 – 180 mm). In this study, the bread obtained from flours whose rheological parameters were within these ranges had higher SV. There was no correlation between SV and flour PC (Table 2); however, the variation of protein subunits probably influenced SV (Table 5). Bread firmness (BF) showed significant variation among the different genotypes (Table 4). The bread obtained from wheat flour of the T 091069 line had the lowest BF (1.62 N), while that made with wheat flour of the T 091006 line the highest BF (4.48 N). In a similar study, Barak et al. (2013) observed
that the gliadin and glutenin contents were negatively correlated with BF and were positively correlated with SV. These correlations show the importance of determining the balance between these proteins for evaluating the bread quality of flours of different wheat varieties.
Effect of glutenin subunits on the flour rheological characteristics and bread
Branlard et al. (2003) reported that the allelic variation at HMW-GS and LMW-GS and environmental conditions are important factors that influence the wheat flour quality parameters. Alleles encoded at the Glu-A1 had no effect on color, dough rheological characteristics, and bread quality (Table 5). Oury et al. (2010) also reported that 1 and 2* subunits had no significant effects on alveograph parameters and baking properties. However, these subunits were associated with a higher loaf volume compared to the Null subunit (Peña et al. 2005; Vázquez et al. 2012). Glu-B1 alleles had an effect on SV (p < 0.05). The flours containing 17+18 and 7+8 subunits produced breads with higher SV
Locus subunit Dt (min) st
(min)
Mti (bU)
re (bU)
Mr (bU)
eXt
(mm) L* b*
sV (cm3∙g−1)
bF (N)
Glu-A1
1 6.3a 11.7a 85a 454a 753a 198a 93.47a 8.16a 3.90a 2.61a
2* 6.3aª 26.9a 68a 516a 778a 170a 94.23a 8.88a 3.83a 2.73a
1/2* 9.2a 32.5a 40a 560a 720a 156a 93.39a 8.39a 4.02a 2.18a
N 4.7a 11.6a 70a 319a 405a 185a 94.16a 9.64a 3.41a 3.73a
Glu-B1
17+18 8.2a 18.1a 65a 600a 955a 176a 97.63a 7.74a 4.29a 1.82a
7+8 6.3a 23.8a 74a 542a 778a 168a 94.39a 9.83a 3.92a 2.80a
7+9 5.7a 16.8a 74a 385a 615a 193a 94.10a 8.98a 3.61b 3.00a
Glu-D1 5+10 6.8a 22.1a 70a 504a 440a 179a 94.04a 9.64a 3.92a 2.52b
2+12 4.2a 8.6a 83a 324b 783a 195a 94.16a 8.34a 3.37b 3.90a
Glu-A3
b 6.3a 29.7a 65a 462a 744a 171a 94.44a 9.05a 3.66a 2.80a
c 7.0a 19.0b 69a 467a 734a 185a 93.81a 8.99a 3.89a 2.64a
d 4.4a 13.4b 88a 485a 665a 182a 94.31a 7.92a 3.76a 3.07a
Glu-B3
b 7.6a 9.2a 78a 566a 907a 176a 93.69a 8.13a 4.04a 2.29a
e 5.6a 20.9a 70a 566a 716a 169a 93.20a 8.14a 3.89a 2.22a
f 6.0a 21.3a 85a 397a 640a 202a 93.41a 9.34a 3.50a 3.62a
g 7.2a 11.5a 50a 396a 718a 221a 93.54a 8.84a 3.95a 1.62a
h 6.8a 17.2a 50a 436a 695a 181a 94.86a 7.86a 3.77a 3.42a
1B/1R No 1B/1R 6.8a 11.5a 68a 490a 762a 184a 93.91b 8.22b 3.85a 2.73a
1B/1R 4.6a 19.3a 86a 410a 590a 175a 96.40a 9.83a 3.70a 2.92a
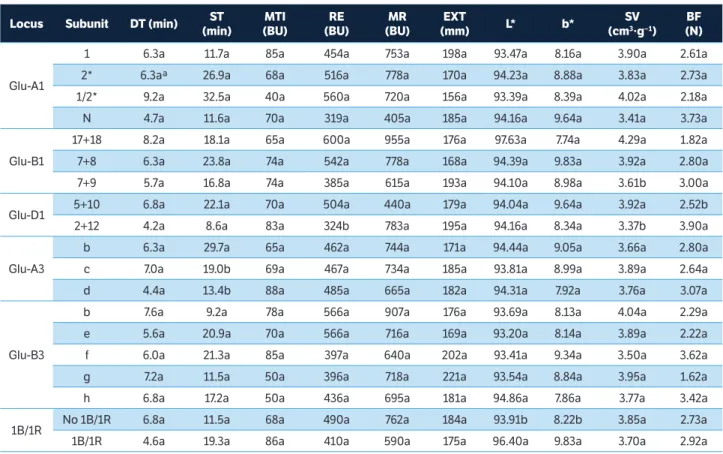
table 5. Allelic frequencies and statistical analysis of the effects of HMW-GS and LMW-GS on flour and bread quality parameters*.
than those with 7+9 subunits (Table 5). Liang et al. (2010) also reported that 7+9 subunits are associated with low baking quality, whereas 17+18 and 7+8 subunits are associated with good baking characteristics. The allelic variations at the Glu-D1 locus had an effect on RE, SV, and BF (p < 0.05). The flours containing 5+10 subunits, which are associated with good baking quality (Peña et al. 2005; Vázquez et al. 2012), had higher RE, higher SV, and lower BF (Table 5). The allelic variation of the Glu-A3 locus had an effect on the ST (p < 0.05) and flours that contained b subunit had higher ST. Li et al. (2010) reported that the b allele at Glu-A3 showed positive effects for all mixograph parameters mainly mixing tolerance. Glu-B3 subunits had no effect on the rheological properties of the dough or on the bread quality mainly due to large genetic variability of the genotypes. The rye translocation 1B/1R has been described as a factor that negatively affects baking quality by decreasing gluten protein quality and worsening the technological properties of the bread (Vázquez et al. 2012). In this study, the 1B/1R did not influence the rheological properties of the dough, SV, or BF, but had an effect on the color of the flour. The presence of the 1B/1R allele was associated with lighter (higher L*) and more yellow (higher b*) flours (Table 5).
Scores from 1 to 4 were calculated for each HMW-GS, and the Total Score (TS) was represented by the sum of the
scores of Glu-A1, Glu-B1, and Glu-D1 (Payne et al. 1987). The TS was positively correlated with the DT (r = 0.51, p < 0.05, Table 2), RE (r = 0.63, p < 0.05), and MR (r= 0.75, p < 0.05). These results suggest that subunits with higher scores are associated with greater gluten strength. There was also a positive correlation between TS and SV (r = 0.60, p < 0.05, Table 2). The 17+18 and 7+8 subunits at Glu-B1 and 5+10 at Glu-D1 stood out, indicating wheat genotypes with higher baking quality.
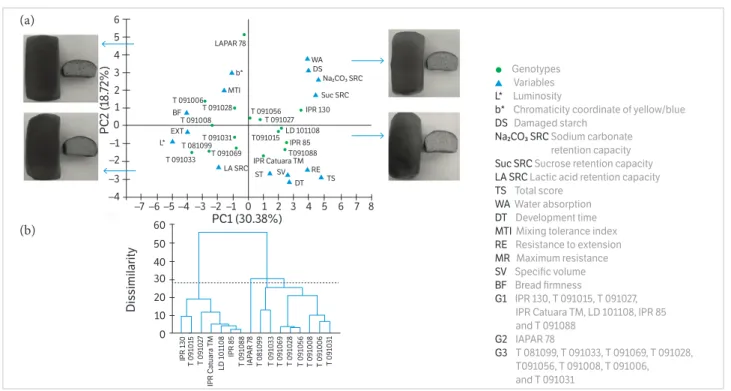
The principal component analysis (PCA) was applied in order to verify the relationship between samples and variables. The rheological characteristics of the flour, SRC, color, SV, BF, and TS were used to describe samples with a number of components smaller than those of the original variables. Thus, the first two components retained 49.10% of the variability between the samples. The first component (PC1) was formed by WA, DS, RE, EXT, L*, Na2CO3 SRC, Suc SRC, SV, BF, and TS, which explained 30.38% of the initial variability between the samples, while DT, ST, and b* variables largely made up the second component (PC2). The other variables made a smaller contribution to the formation of these components. The dispersion of the genotypes in the space formed by PC1 and PC2 is shown in Figure 1a. These components (PC1 and PC2) allowed for the separation of the samples according to their physicochemical and rheological characteristics.
Figure 1. (a) Principal component analysis of the physicochemical and rheological properties of the flour, bread characteristics, and HMW-GS of the wheat genotypes. (b) Dendrogram of the 16 wheat genotypes based on the physicochemical and rheological properties of the flour, bread characteristics, and evaluation of HMW-GS.
PC2 ( 18. 72%) Dis similarity IPR 1 3 0 T 09 101 5 T 09 10 2 7 LD 101 108 IPR 85 T 09 1088 IAP AR 7 8
T 081099 T 09
10 3 3 T 09 106 9 T 09 10 2 8 T 09 105 6 T 09 1008 T 09 1006 T 09 10 3 1 IPR C atuar a T M 6 LAPAR 78 b* L* MTI TS RE SV ST DT BF EXT WA DS Suc SRC IPR 130 LD 101108 IPR 85 T091088 T091015
IPR Catuara TM T 091027 T 091056 T 091006 T 091028 T 091008 T 091031 T 091033 T 081099 T 091069 LA SRC Na₂CO₃ SRC 5 4 3 2 1 0 –1 –2 –3 –4 60 50 40 30 20 10 0
–7 –6 –5 –4 –3 –2 –1 0 PC1 (30.38%)
1 2 3 4 5 6 7 8
Genotypes Variables
L* Luminosity
b* Chromaticity coordinate of yellow/blue
DS Damaged starch
Na₂CO₃ SRC Sodium carbonate retention capacity
Suc SRC Sucrose retention capacity
LA SRC Lactic acid retention capacity
TS Total score
WA Water absorption
DT Development time
MTI Mixing tolerance index
RE Resistance to extension
MR Maximum resistance
SV Specific volume
BF Bread firmness
G1 IPR 130, T 091015, T 091027, IPR Catuara TM, LD 101108, IPR 85 and T 091088
G2 IAPAR 78
G3 T 081099, T 091033, T 091069, T 091028, T091056, T 091008, T 091006, and T 091031
(a)
PC2 was responsible for the separation or discrimination of genotypes in the horizontal direction of the biplot. In this projection, the genotypes that had high values of WA, DS, RE, Na2CO3 SRC, Suc SRC, SV, and TS are located on the right side. The IPR 130, IPR 85, IPR Catuara TM, T 091015, T 091088, and LD 101108 genotypes, which had high GHI and bread with very good quality, are in this position. The genotypes that had soft grain, high L*, extensible flour, and high MTI are in the opposite position (PC1 negative side). The T 091006, T 091008, T 081099, and T 091033 lines are in this position and their flours are associated with low baking quality. The T 091056, T 091031, T 091069, and T 091027 lines are associated with characteristics of intermediate quality. Although IAPAR 78 cultivar typically is associated with intermediate quality, its flour had low ST and DT and resulted in loaves with small SV (Table 4).
Another approach to finding groups in a sample population is a cluster analysis. This analysis aims to classify the samples into a small number of mutually exclusive groups based on similarities or dissimilarities between the genotypes of the sample population.
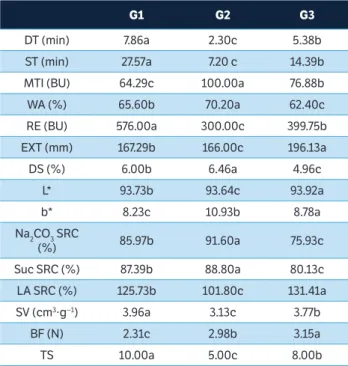
The representative dendrogram of the cluster analysis (Figure 1b) classified the genotypes into 3 groups (G1, G2, and G3) according to their baking qualities. G1 stood out from the others because the flours in this group have characteristics associated with superior baking quality, especially DT, MTI, ST, RE, and EXT (Table 6). These flours also have a lower intensity of yellow chromaticity, intermediate levels of DS, WA, and Suc SRC, and their breads had higher SV and lower BF. The flours from this group had the highest TS (10).
As verified through the PCA, the IAPAR 78 cultivar stood out from the others because of its very poor baking quality. This cultivar was also the only one to be classified in G2 through the cluster analysis. Its flour was found to have the lowest DT and ST, and also a high MTI. The amount of DS was greater than that found in the G1 group genotypes, and the Na2CO3 SRC was higher than that of the G1 and G3 groups (Table 6). In addition, the flour color was found to be more yellow. These features resulted in loaves with low SV and intermediate BF. The flour from this cultivar had the lowest TS (5.0). The cultivars grouped in G3 had lower DS and low WA, Na2CO3 SRC, and Suc SRC, despite high LA SRC (Table 6). Despite having an intermediate SV, the loaves were quite firm. The flours from G3 received intermediate grades of TS (8.0).
However, when observing TS of each genotype grouped in G3, it was found that the T 091028, T 091031, and T 091015 lines had high TS (9-10) due to the presence of the 5+10 subunits at the Glu-D1. These subunits are associated with increased gluten strength and SV (Liang et al. 2010; Hernández et al. 2012).
The genotypes that had rye translocation (Costa et al. 2013) were grouped in G3 (except IAPAR 78 cultivar). Although the rye translocation negatively affects baking quality, when in the presence of subunits from A, B, and D chromosomes this effect is decreased, as observed for flours from T 081099, T 091033, and T 091056 lines that had intermediate baking quality. Comparing the results obtained in this study with those presented in a previous study (Costa et al. 2013), it was possible to observe that for some samples, the results from the physicochemical and rheological analysis of the flour did not confirm those from the grain physicochemical analysis and some genotypes that were previously classified as of low and intermediate qualities had their classification changed to intermediate and high, respectively in this study. These
G1 G2 G3
DT (min) 7.86a 2.30c 5.38b
ST (min) 27.57a 7.20 c 14.39b
MTI (BU) 64.29c 100.00a 76.88b
WA (%) 65.60b 70.20a 62.40c
RE (BU) 576.00a 300.00c 399.75b
EXT (mm) 167.29b 166.00c 196.13a
DS (%) 6.00b 6.46a 4.96c
L* 93.73b 93.64c 93.92a
b* 8.23c 10.93b 8.78a
Na2CO3 SRC
(%) 85.97b 91.60a 75.93c
Suc SRC (%) 87.39b 88.80a 80.13c
LA SRC (%) 125.73b 101.80c 131.41a
SV (cm3∙g−1) 3.96a 3.13c 3.77b
BF (N) 2.31c 2.98b 3.15a
TS 10.00a 5.00c 8.00b
table 6. Rheological parameters, color parameters, SCR values, specific volume, bread firmness, and total score of the wheat genotypes in the group obtained from cluster analysis*.
results suggest that the HMW- and LMW-glutenin subunits associated with good dough rheological properties and good baking quality prevailed over those associated with grain physicochemical characteristics.
cONcLUsiON
The HMW-GS and LMW-GS have influence on the baking quality of the wheat. The Glu-D1 locus is the most significant in affecting the rheological characteristics of the flour and bread quality parameters. The 5+10 allele
is associated with the best characteristics for bread making, while the 2+12 one is associated with weak flours. The Glu-D1 locus is very important at the first stages of breeding programs for selecting wheat lines for different products.
AcKNOWLeDGeMeNts
The authors thank the Brazilian National Council for Scientific and Technological Development (CNPq) for financial support.
American Association Cereal Chemists (2000). Approved Methods of the American Association of Cereal Chemists. 10. ed. Saint Paul: Approved Methods Committee.
Barak, S., Mudgil, D. and Khatkar, B. S. (2013). Relationship of gliadin and glutenin proteins with dough rheology, flour pasting and bread making performance of wheat varieties. LWT- Food Science and Technology Journal,51, 211-217. http://dx.doi.org/10.1016/j.lwt.2012.09.011.
Blechl, A. E. and Vensel, W. H. (2013). Variant high-molecular-weight glutenin subunits arising from biolistic transformation of wheat. Journal of Cereal Science, 57, 496-503.http://dx.doi.org/10.1016/ j.jcs.2013.02.005.
Branlard, G., Dardevet, M., Amiour, N. and Igrejas, G. (2003). Allelic diversity HMW and LMW glutenin subunits and Omega-gliadins in French bread wheat (Triticum aestivum L.).Genetic Resources and Crop Evolution, 50, 669-679. http://dx.doi. org/10.1023/A:1025077005401.
Costa, M. S., Scholz, M. B. S. and Franco, C. M. L. (2013). Effect of high and low molecular weight glutenin subunits, and subunits of gliadin on physicochemical parameters of different wheat genotypes. Ciência e Tecnologia de Alimentos, 33, 163-170. http:// dx.doi.org/10.1590/S0101-20612013000500024.
Guttieri, M. J., Bowen, D., Gannon, D., O’Brien, K. and Souza, E. (2001). Solvent retention capacities of irrigated soft white spring wheat flours. Crop Science, 41, 1054-1061. http://dx.doi:10.2135/ cropsci2001.4141054x.
Hernández, Z. J. E., Figueroa, J. D. C., Rayas-Duarte, P., Martínez-Flores, H. E., Arámbula, G. V., Luna, G. B. and Peña, R. J. (2012).
reFereNces
Influence of high and low molecular weight glutenins on stress relaxation of wheat kernels and the relation to sedimentation and rheological properties. Journal of Cereal Science, 55, 344-350. http://dx.doi.org/10.1016/j.jcs.2012.01.009.
Hrušková, M. and Švec, I. (2009). Wheat hardness in relation to other quality factors. Czech Journal of Food Sciences,27, 240-284.
Kaur, A., Singh, N., Ahlawat, A. K., Kaur, S., Singh, A. M., Chauhan, H. and Singh, G. P. (2013). Diversity in grain, flour, dough and gluten properties amongst Indian wheat cultivars varying in high molecular weight subunits (HMW-GS). Food Research International, 53, 63-72. http://dx.doi.org/10.1016/j.foodres.2013.03.009.
Kweon, M., Slade, L. and Levine, H. (2011). Solvent retention capacity (SRC) testing of wheat flour: principles and value in predicting flour functionality in different wheat-based food processes and in wheat breeding — A Review. Cereal Chemistry, 88, 537-552. http:// dx.doi.org/10.1094/CCHEM-07-11-0092.
Li, Y., Zhou, R., Branlard, G. and Jia, J. (2010). Development of introgression lines with 18 alleles of glutenin subunits and evaluation of the effects of various alleles on quality related traits in wheat (Triticum aestivum L.). Journal of Cereal Science, 51, 127-133. http:// dx.doi.org/10.1016/j.jcs.2009.10.008.
Luo, C., Griffin, W. B., Branlard, B. and Mcneil, D. L. (2001). Comparison of low- and high molecular-weight wheat glutenin alleles effects on flour quality. Theoretical and Applied Genetics,102, 1088-1098. http://dx.doi.org/10.1007/s001220000433.
Oliveira, D. S., Telis-Romero, J., Silva, R. and Franco, C. M. L. (2014). Effect of a Thermoascus aurantiacus thermostable enzyme cocktail on wheat bread quality. Food Chemistry, 143, 139-146. http://dx.doi. org/10.1016/j.foodchem.2013.07.103.
Oury, F., Chiron, H., Faye, A., Gardet, O., Giraud, A., Heumez, E., Rolland, B., Rousset, M., Trottet, M., C, G. and Branlard, G. (2010). The prediction of bread wheat quality: joint use of the phenotypic information brought by technological tests and the genetic information brought by HMW and LMW glutenin subunits. Euphytica, 171, 87-109. http://dx.doi.org/10.1007/s10681-009-9997-1.
Pauly, A., Pareyt, B., Fierens, E. and Delcour, J. A. (2013). Wheat
(Triticum aestivumL. and T. turgidumL. ssp. durum) kernel hardness:
II. Implications for end-product quality and role of puroindolines there in. Comprehensive Reviews in Food Science and Food Safety, 12, 427-438. http://dx.doi.org/10.1111/1541-4337.12018.
Payne, P. I., Seekings, J. A., Worland, A. J., Jarvis, M. G. and Holt, L. M. (1987). Allelic variation of glutenin subunits and gliadins and its effect on breadmaking quality in wheat: analysis of F5 progeny from “Chinese Spring” X “Chinese Spring” (Hope 1A).
Journal of Cereal Science, 6, 103-118. http://dx.doi.org/10.1016/ S0733-5210(87)80047-4.
Peña, E., Bernardo, A., Souler, C. and Jouve, N. (2005). Relationship between common wheat (Triticum aestivum L.) gluten proteins and dough rheological properties. Euphytica, 143, 169-177. http:// dx.doi.org/10.1007/s10681-005-3157-z.
Pomeranz, Y. and Williams, P. C. (1990). Wheat hardness: its genetic, structural, and biochemical background, measurements and significance. In: Y. Pomeranz (Ed.), Advances in cereal science and technology (v. 10, p. 471-544). St. Paul: American Association of Cereal Chemistry.
Shewry, P. R., Halford, N. G., Tatham, A. S., Popineau, Y., Lafiandra, D. and Belton, P. S. (2003). The high molecular weight subunits of wheat glutenin and their role in determining wheat processing properties. Advances in Food and Nutrition Research, 45, 219-302. http://dx.doi.org/10.1016/S1043-4526(03)45006-7.
Vázquez, D., Berger, A. G., Cuniberti, M., Bainotti, C., Miranda, M. Z., Scheeren, P. L., Jobet, C., Zúñiga, J., Cabrera, G., Verges, R. and Peña, R. J. (2012). Influence of cultivar and environment on quality of Latin American wheats. Journal of Cereal Science, 56, 196-203. http://dx.doi.org/10.1016/j.jcs.2012.03.004.