Decision Making Process: A Comparison Between the Public and Private Sector Arthur Schuler da Igreja
Igreja, Arthur Schuler da
Decision making process : a comparison between the public and private sector /Arthur Schuler da Igreja. – 2014.
59 f.
Dissertação (mestrado) - Escola Brasileira de Administração Pública e de Empresas, Centro de Formação Acadêmica e Pesquisa.
Orientador: Marco Tulio Fundão Zanini. Inclui bibliografia.
1. Administração de empresas. 2. Processo decisório
3. Liderança. 4. Personalidade e ocupação I. Zanini, Marco Tulio Fundão. II. Escola Brasileira de Administração Pública e de Empresas. Centro de Formação Acadêmica e Pesquisa. III. Título.
3
Acknowledgments
4
“Keep your thoughts positive because your thoughts become your words. Keep your words positive because your words become your behavior. Keep your behavior positive because your behavior becomes your habits. Keep your habits positive because your habits become your values. Keep your values positive because your values become your destiny.”
5
SUMMARY
SUMMARY ... 5
FIGURES LIST ... 7
CHART LIST ... 8
1 INTRODUCTION ... 9
2 THEORETICAL REFERENCE ... 11
2.1 Decision-Making Process ... 11
2.1.1 Thinking Preference and Brain Dominance ... 12
2.2 HBDI – Herrmann Brain Dominance Instrument... 13
2.2.1 Brain Models ... 13
2.2.2 The Whole Brain Model ... 15
2.2.3 Types of profile dominance ... 17
2.2.4 The HBDI for different occupations ... 18
2.2.5 Comparison with other assessment tools ... 20
2.2.6 Validity of the HBDI ... 21
2.2.7 General profile per nationality ... 23
2.3 Heuristics and Biases ... 26
2.4 Diversity ... 28
2.4.1 Diversity in the organizations ... 28
2.4.2 Diversity in the executive education ... 29
3 RESEARCH METHODOLOGY ... 31
3.1 Statistical Validation ... 31
3.1.1 The Cronbach’s Alpha ... 32
4 DATA ANALISYS AND DISCUSSION OF RESULTS ... 36
4.1 Results for the Cohort ... 36
6
4.3 Results per Academic Background ... 41
4.4 Results per Current Job Position ... 43
4.5 Results per Years of Professional Experience ... 45
4.6 Results per Age ... 46
4.7 Results per Functional Area of Management... 48
5 CONCLUSIONS AND RECOMMENDATIONS ... 51
6 BIBLIOGRAPHY ... 52
7
FIGURES LIST
Figure 1: MacLean’s triune brain model ... 14
Figure 2: Whole Brain Model and its Physiological Roots ... 15
Figure 3: The Whole Brain Model ... 16
Figure 4: Pro Forma Profiles Representing the Mentality of Select Occupations... 19
Figure 5: The premise of the HBDI compared to other approaches ... 20
Figure 6: Geert Hofstede’s "Cultures & Consequences" ... 23
Figure 7: Average Profiles of Male CEOs by Country ... 24
Figure 8: Weighted Average Profiles of Male and Female CEOs ... 25
Figure 9: HBDI profile for CIM 1 cohort ... 36
Figure 10: Average profile (blue) and individual profiles (dashed) ... 37
Figure 11: Average profile per quadrant (red line) and individual score (colored lines) ... 38
Figure 12: Histogram per quadrant ... 38
Figure 13: Results per gender ... 39
Figure 14: Male and Female Business Managers ... 41
Figure 15: Results per academic background ... 41
Figure 16: Multidominant Occupational Profile Averages ... 42
Figure 17: Average Profile of Engineering Occupations ... 43
Figure 18: Results per current job position ... 44
Figure 19: Results per years of professional experience ... 45
Figure 20: Paradigm shift in thinking skills required for success ... 46
Figure 21: Results per age ... 47
Figure 22: Results per functional area of management ... 48
Figure 23: Profile for entrepreneurs ... 49
Figure 24: Profile for Bank Managers and Finance Managers ... 49
8
CHART LIST
Chart 1: Clinical and Experimental Evidence of Hemispheric Dominance as of 1976 ... 13
Chart 2: Rank ordering of the top four HBDI Work Elements ... 25
Chart 3: Rank ordering of the bottom four HBDI Work Elements ... 25
Chart 4: Socioeconomic and work experience questions ... 31
Chart 5: Chart with answers for the first question of the HBDI session ... 32
Chart 6: Example of answers of a questionnaire to exemplify the calculation process ... 33
Chart 7: Cronbach’s Alpha for each HBDI’s category... 34
Chart 8: Cronbach’s Alpha reliability scale ... 34
Chart 9: Standard deviation and RSD per HBDI category ... 37
Chart 10: Standard deviation and RSD per genre... 40
Chart 11: Standard deviation and RSD per academic background ... 42
Chart 12: Standard deviation and variance per current job position ... 44
Chart 13: Standard deviation and RSD per years of work experience ... 45
9
Decision Making Process: A Comparison Between the Public and Private Sector
1 INTRODUCTION
The problem of decision making, its mechanisms and consequences is the very core of management, it is virtually impossible to separate the act of manage from this knowledge area. As defined by Herbert Simon [3] – "decision making" as though it were synonymous with "managing".
For [1], Decision making is the most common task of managers and executives. Successful [organizations] "out-decide" their competitors in at least three ways: they make better decisions; they make decisions faster; and they implement decisions more. According to Peter F. Drucker, in [2] – Whatever a manager does, he does through making decisions. Those decisions may be made as a matter of routine. Indeed, he may not even realize that he is making them. Or they affect the future existence of the enterprise and require years of systematic analysis. But management is intrinsically a decision-making process.
We make decisions of every nature all the time, current estimates indicates that an average adult makes 35,000 decisions every day, ranging from trivial and basic matters such the positioning of objects, up to difficult decisions with multi-variable analysis during the definitions of a strategic plan for instance.
As defined in [4], a decision is a selection made by an individual regarding a choice of a conclusion about a situation. This represents a course of behavior pertaining to what must be done or what must not be done. A decision is the point at which plans, policies and objectives are translated into concrete actions.
Since the Pre-Socratic philosophers, and thereafter with the rationalists in the 17th century, the notion of rationality is used to define the very basic essence of the human-being, fully capable of analyze information and using a logical procedure, decide. Nevertheless, we commit several mistaken decisions and it’s crucial to understand what’s behind these mechanisms to improve our assertiveness and competitive edge.
10
The importance of understanding the impact of our thinking preferences and how to improve the effectiveness as a leader of organizations are the main justifications for this thesis; the main problem addressed is the behavioral profile diversity in a selective Master’s cohort formed by students from several different countries.
The research methodology approach has been quantitative, through questionnaire administration using the HBDI (Herrmann Brain Dominance Instrument), a validated framework developed by William "Ned" Herrmann when he was the leader of General Electric's Crotonville facility. This questionnaire has been administered in hundreds of thousands professional, enabling the possibility to establish correlations between a certain group and several historical databases.
The selected group of analysis is the first cohort (23 students) from the CIM (Corporate International Master's), a joint program between Georgetown University (USA), ESADE (Spain) and FGV (Brazil). Besides decision preferences, the obtained profile enables the discussion on leadership style, heuristic's pitfalls and a base to compare with future cohorts. The fundamental research question is: how diverse is the dominant decision-making profile for the CIM students?
11
2 THEORETICAL REFERENCE
2.1 DECISION-MAKING PROCESS
Our daily activities, ranging from elementary and simples tasks up to events that has the potential to define the rest of our life are nothing more than a summation of decisions that we are taking with different levels of consciousness. The practical impact is the importance of understanding the elements that are influencing this ubiquitous process.
During this key moment when we have different options in front of us, we tend to believe that our rationality and awareness are our most valuable characteristic to find the option that will maximize the resultant value among all the available opportunities.
According to [24], a rational procedure is one that pursues logic of consequence. It makes a choice conditional on the answers to four basic questions:
1. The question of alternatives: What actions are possible?
2. The question of expectations: What future consequences might follow from each alternative? How likely is each possible consequence, assuming that alternative is chosen?
3. The question of preferences: How valuable (to the decision maker) are the consequences associated with each of the alternatives?
4. The question of the decision rule: How is a choice to be made among the alternatives in terms of the values of their consequences?
When decision making is studied within this framework, each of these questions is explored: What determines which alternatives are considered? What determines the expectations about consequences? How are decision maker preferences created and evoked? What is the decision rule that is used?
Nevertheless, our cognitive system is far from be impartial, we are under the influence of several cognitive particularities, shaped by elements such as time, availability of resources, physical conditions and our life story, to name a few. In other words, everyone has a limited state and level of consciousness that may create pitfalls during important moments, deciding over an investment or defining our profession career for instance.
12
the understanding of our blind spots is vital to develop a more holistic model that will enable us to potentiate the rationality.
According to [26], researchers have been studying the way our minds function in making decisions for half a century. This research in the laboratory and in the field has revealed that we use unconscious routines to cope with the complexity inherent in most decisions. These routines, known as heuristics, serve us well in most situations. […] Yet, like most heuristics, it is not fool-proof. […] Researchers have identified a whole series of such flaws in the way we think in making decisions. Some, like the heuristic for clarity, are sensory misperceptions. Others take the form of biases. Others appear simply as irrational anomalies in our thinking. What makes all these traps so dangerous is their invisibility. Because they are hard-wired into our thinking process, we fail to recognize them-even as we fall right into them.
For executives, whose success hinges on the many day-to-day decisions they make or approve, the psychological traps are especially dangerous. They can undermine everything from new-product development to acquisition and divesture strategy to succession planning [26].
As defined by the Nobel Prize winner Herbert Simon, there are two ways of studying and understanding the decision-making process: the prescriptive and the descriptive approach. The first is oriented towards models and techniques that may improve the process, seeking the results maximization. The second has fundamentally an empirical approach – must be observable in reality, in the sense defined in [23]. The focus of the present thesis is the second, using a thinking preference framework, the ultimate goal is to observe the results for a particular group and furthermore discuss their decision-making process in terms of diversity and alignment with the organizational expectations nowadays.
2.1.1 Thinking Preference and Brain Dominances
The thinking preference can be defined as the set of characteristics that stand out most of the time or with the greater influence in the decision making process. This set is a result of all experiences taking into account dimensions like: culture, academic background, professional experience, inter-personal relationships, politics and religion.
13
comfortable and in which the reward system is more active. A practical implication of this concept is the natural tendency of energy expenditure reduction, in other words, with time a certain degree of automatism is observed.
However, the observed profile is not fixed or immutable, is more resembling with a frame taken from a video. Practical tests indicate that the change potential when utilized proper methodologies and with the correct motivation from the individual is very promising [12].
2.2 HBDI – HERRMANN BRAIN DOMINANCE INSTRUMENT 2.2.1 Brain Models
The attempt to model the human brain and to correlate specific areas with certain behaviors dates to the 19th century when Pierre-Paul Broca managed to establish an unquestionable relationship with the localization of speech production, nowadays called as Broca’s area.
Broca was the first to establish firmly a specialized region of the higher brain in 1861, based on a patient who suffered from epilepsy. Broca’s patient had lost all ability to speak except the single word "tan". After the patient died, Broca was able to perform an autopsy, finding "damage to the posterior part of the third frontal convolution in the left hemisphere" [13].
During the 1970’s, experiments conducted by the Nobel Prize winner Roger Sperry and by his pupil Michael Gazzanaga focused on split-brain patients reinforced this discussion. They conducted experiments on people whose brain hemispheres were surgically separated in the course of treatment for epilepsy. They showed that, under certain conditions, each hemisphere could hold different thoughts and intentions. This raised the profound question on whether a person has a single "self" [14].
The conclusions at the time pointed that was possible to separate completely the brain functions into this dichotomous model, grouping the functions as seen in the chart 1.
Chart 1: Clinical and Experimental Evidence of Hemispheric Dominance as of 1976
LEFT HEMISPHERE RIGHT HEMISPHERE
14 SEQUENTIAL CONTROLLED INTELLECTUAL DOMINANT WORDLY ACTIVE ANALYTIC READING,WRITING,NAMING SEQUENTIAL ORDERING
PERCEPTION OF SIGNIFICANT ORDER
COMPLEX MOTOR SEQUENCES
SIMULTANEOUS EMOTIONAL INTUITIVE, CREATIVE MINOR (QUIET) SPIRITUAL RECEPTIVE SYNTHETIC, GESTALT FACIAL RECOGNITION SIMULTANEOUS COMPREHENSION
PERCEPTION OF ABSTRACT PATTERNS
RECOGNITION OF COMPLEX FIGURES
Source: [5]
This model has been prominent for several years but was confronted and questioned, furthermore recently as seen in [15] and [16].
The next model that was highlighted was the model developed by Paul MacLean and described in [17], where the author represented the brain into evolutionary sectors, from our very basic and primate functions (the reptilian brain), the mammalian brain, responsible for the limbic system (associated to emotional behavior and divided in two interconnected halves, nestled within each of the cerebral hemispheres) [5] and lastly, the neocortex or neomammalian, divided into 5 different specialized parts, responsible for planning, perception, language, abstraction and the senses.
Figure 1: MacLean’s triune brain model.
15
2.2.2 The Whole Brain Model
The Whole Brain Model developed by Ned Herrmann in General Electric to map the thinking preferences is basically a representation of four different thinking styles somehow derived from Sperry’s and Maclean’s model using these concepts as a base framework from a physiological point of view.
Figure 2: Whole Brain Model and its Physiological Roots.
Source: [5]
16
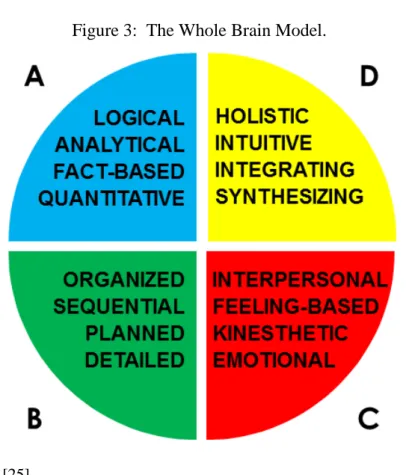
Figure 3: The Whole Brain Model.
Source: [25]
To obtain the results, a standard questionnaire is administered, constituted by 12 questions with total of 120 alternatives, the participant has to choose a predetermined number of answers per question, in the end a total of 40 alternatives should be marked. Each question underlie in one of the 4 quadrants, afterwards it’s only a matter of compute the dominant thinking profile according to the template.
The A quadrant style is logical, analytical, and often bottom-line tough. No decision is made without the facts and reality is now. An A quadrant would require his/her staff to be well versed in the facts and to use logic rather than intuition or gut feelings to make decisions [5].
The B style is very detailed, structured, and solid, down-to-earth with no equivocation and ambiguity. Things are done according to procedure and on time, and delivered as promised. The average B-quadrant manager values following orders, getting the project in on time, a well-organized office, and accurate documentation [5].
17
open and if something doesn’t seem right, standard procedure is to address the problem in a sensitive way [5].
The D style is intuitive, holistic, adventurous, and risk taking. Experimentation is highly valued. And it is normal for a D-quadrant manager to try out several approaches at once. The style is very open one, with very little structure. Seeing into the future and avoiding shortsighted solutions is a common trait [5].
2.2.3 Types of profile dominance
Once the test is administered, the data enable the evaluation of profile dominance in terms of which quadrant is prevalent over the others, as presented in [19], after evaluating a database of more than 500,000 HBDI tests, approximately 7 percent of these are single dominant, 60 percent double dominant, 30 percent triple dominant and about 3 percent quadruple dominant.
The advantage of having a single dominant profile is that the person goes through life with relatively little internal conflict. Perceptions and decision-making processes tend to be harmonious and predictable. The single-dominant person tends to see the world through a consistent set of lenses, and not to see the world through the lenses others uses. Single-dominants often have reduced capability to iterate internally between quadrants, which reduces their abilities for independent creative processing. An environment that celebrates differences would promote external iteration between people of different preferences [19].
People with double dominance within the same hemisphere tend to feel internally integrated. However, like those with single dominant profiles, people with two primaries in the same hemisphere tend more strongly to avoid the modes of the others. When the two primaries occur in the opposing hemispheres directly across from one another, in A and D, or B and C, a new set of advantages and difficulties arises. The advantages are that the person has an expanded ability to iterate – to access major aspects of functioning that relate to left and right hemispheres generally. The disadvantages are that the person now has two quite different options for going about things, and it may take some years to figure out which modes are appropriate for which types of situations [19].
18
dominant preferences in diagonal opposites frequently find themselves caught between decisions based on two entirely different set of values. A good way to integrate diagonally opposed preferences is to enhance abilities in one of the other two quadrants, either of which has direct physiological connections and clear commonalities in functioning with both of the opposing primaries. [19].
Triple dominant profiles have only one quadrant that isn’t primary. The linguistic ability of triple dominant profiles is even more expanded than that of double-dominants, for they can speak to fully three-quarters of the population without strain. The drawbacks to triple dominant profiles are simply that they may take longer than the others to mature, because they incorporate the same decision-making oppositions as the diagonally opposed double dominant profiles [19].
Finally, the quadruple dominant profile expresses primary level preferences for every one of the four modes. This gives the person a unique advantage: it makes iteration between any and all quadrants entirely available. Though their potential is great, people with such profiles experience many of the difficulties other types of profiles have. Like the single-dominants, they see the world in a way that seems quite out of step with the rest of the population [19].
2.2.4 The HBDI for different occupations
The HBDI enables the possibility to identify the thinking preferences that will influence the behavior of the professional. Another important factor is that this preference is directly linked to the activities that will motivate or not each professional, for instance, if a professional with a strong dominance in the B-quadrant (conservative and organized) is working is an environmental with several D-quadrant professionals dealing with flexible agenda, brainstorming sessions and lack of structured procedures, he/she will tend to face difficulties to find joy in such ambience and to fully develop his/her potential.
19
Figure 4: Pro Forma Profiles Representing the Mentality of Select Occupations
Source: [5]
There’s a noteworthy correlations between the encountered profile and the usual
description of the requirements for each profession. Exemplifying: makes sense that an artist presents a double dominance in the right hemisphere, with a stronger dominance in the D quadrant followed by the C quadrant.
20
A reminder is necessary just to point that these are averages and in many cases, many of which stand out, do it exactly because they add a different characteristic in a particular activity like a technical manager with a well-developed C quadrant resulting in differentiated capabilities for relationships.
2.2.5 Comparison with other assessment tools
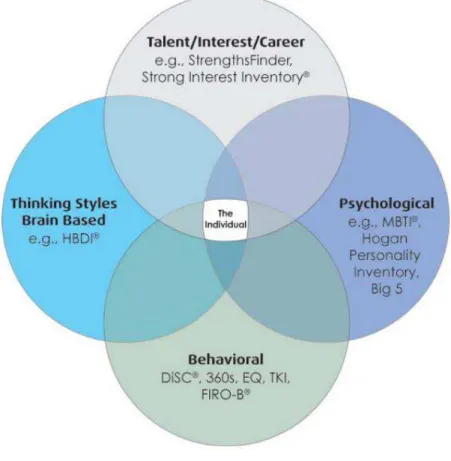
As shown in [25], the HBDI is comparable with different assessment tools weighing up that those different tools uses different premises.
Figure 5: The premise of the HBDI compared to other approaches
Source: [25]
21
Styles models are examples of behavior assessments and finally, a talent/interest/career assessment considers "What are my natural talents and interest?" StrenghtsFinders is an example of this category [25].
2.2.6 Validity of the HBDI
The most complete study on validity for the HBDI was conducted by C. Victor Bunderson, Phd. during the 1980’s. His main interest was on the evaluation of the assumptions developed by Ned Herrmann under the procedural rigor of organizations such the American Educational Research Association, the American Psychological Association, and the National Council on Measurement in Education.
As described in [27] and [19], when Ned Herrmann was head of manager education at GE, the company contracted WICAT Education Institution and later WICAT Systems for a series of studies to determine the construct validity of his instruments and methods. The main phases were:
1. Literature review. A literature review was conducted in 1979 spanning multiple measurement domains, including cognitive aptitudes, personality, thinking styles, learning styles, and learning strategies.
2. External Construct Validation. At the time, the model with the four quadrants was not fully developed, the scoring was based only on 2 hemispheres, and the conclusion of this phase was that the scoring method should be improved.
3. Internal Construct Validation. An item factor analysis of 439 cases, which included both GE and non GE participants in management education workshops, was performed to establish internal construct validity of the existing scores. Ned Herrmann’s holistic scores were found to be valid.
4. External Construct Validation. A second factor analyses used the old instrument but the new scoring procedure and applied to the same data set described in Study 2. It produced evidence of external construct validity.
22
items from about 8,000 HBDI obtained through a variety of workshops conducted by Ned Herrmann and his colleagues during 1984, 1985, and 1986.
The overall conclusions in [27] for this series of studies indicate that the proposed framework is robust and valid; the required wariness needs to be highlighted regarding the fact that the HBDI was not validated for use in clinical or diagnostic testing, nor in medical or psychological classification. It was not validated for use in admissions testing prior to educational or training programs nor for placement at different levels within these programs. It was not validated for use in selection testing for employment, for professional and occupational licensure and certification, nor for making a decision about a person that is beyond the control of that person.
The face validity that was analyzed empirically also resulted in high levels of acceptance; this is one of the main relevant characteristics for an instrument such as the HBDI [27].
Kevin Ho [28], evaluated the HBDI using the test/retest procedure using repeated measures of the same persons, using large data sets, the encountered reliability for the main characteristics of the HBIS is above 0.9.
Another important study was conducted by Lawrence Schkade, Professor and Chairman of the Systems Analysis Department at the University of Texas at Arlington. He used EEG (Electroencephalography) to analyze the brain waves of 12 left brained accounting students and compared with 12 right brained seniors in studio art. He computed the Fourier transforms of the brain waves using the alpha frequency as the main reference. The results confirmed the differences that were encountered in the HBDI with the brain waves. A ratio of the power of the left hemisphere to the right would be 1.0 if both were used equally. The mean power ratio for accounting students was .77 (more alpha from the right, from which we may infer more active processing in the left.) The mean power ratio for art students was 1.2 (more alpha from the left than the right hemisphere). The results were statistically significant with a probability less than .001 that they could have resulted by chance [29].
Nevertheless, as listed in [27], the author considered the two main weak points of the HBDI:
23
2. Preference questionnaires like the HBDI are inherently coachable. Respondents could learn how to produce desirable results, in other words, if someone has any understanding on the mechanism behind the HBDI, he/she could fake the preferences during the process.
2.2.7 General profile per nationality
The HBDI has been used to map the differences in the profiles among persons from several countries over the years. The database exposed in [5] indicated that the typical CEO is multidominant and has at least two, usually three and often four strong primaries and therefore has a wide array of thinking options. As an occupant category, CEOs have four times the number of four-quadrant-balanced profiles than any other occupational group.
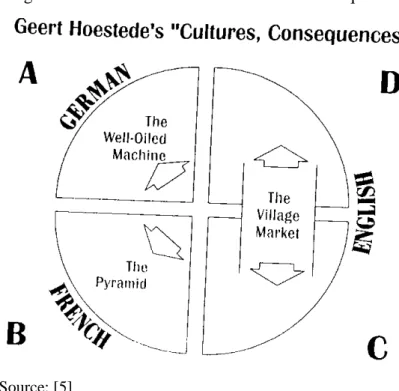
Geert Hofstede, expert in cultural consequences on management, has mentioned in his publications, like in [30] for instance, that the business culture in Germany is like a "well-oiled-machine", England is similar to a "village market" and France with its bureaucracy is like a "pyramid". When interpreted in terms of the HBDI framework, the result can be seen in the Figure 1.
Figure 6: Geert Hofstede’s "Cultures & Consequences"
Source: [5]
24
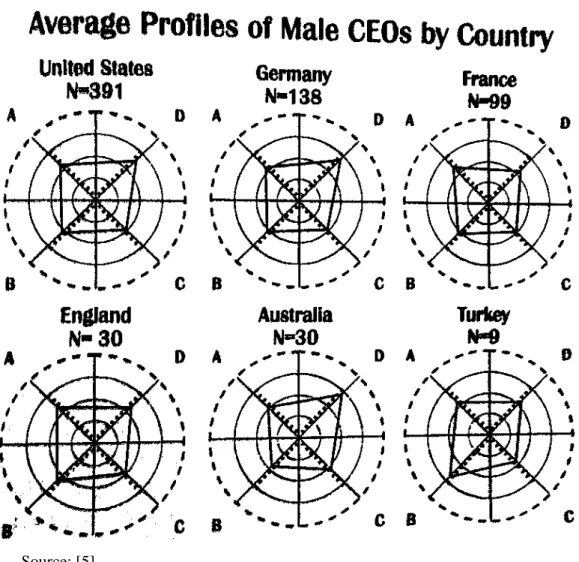
Figure 7: Average Profiles of Male CEOs by Country
Source: [5]
The results indicate the dominance of balanced profiles and it’s possible to see the correlation with Hofstede’s observations: he mentioned that there’s more bureaucracy in France; usually professionals that manage this scenario are related to analytical activities and organized procedures (A and B quadrants). That’s precisely what is observed in comparison with the German profile for instance where the D quadrant is more dominant. The German culture emphasizes the focus on innovation, technology and added values on its products, these characteristics are generally dealt by professionals with a strong D quadrant.
25
Figure 8: Weighted Average Profiles of Male and Female CEOs
Source: [5]
Another interesting finding in this database is the comparison of the rank ordering of the top four and bottom four HBDI work elements for male and female CEOs.
Chart 2: Rank ordering of the top four HBDI Work Elements
697 Male CEOs, Six Countries 76 Female CEOs, Three Countries
1. Problem Solving 1. Organizational Aspects
2. Organizational Aspects 2. Interpersonal Aspects
3. Interpersonal Aspects 3. Problem Solving
4. Conceptualizing 4. Conceptualizing
Source: [5]
Chart 3: Rank ordering of the bottom four HBDI Work Elements
697 Male CEOs, Six Countries 76 Female CEOs, Three Countries
13. Administrative 13. Writing
14. Writing 14. Teaching/Training
15. Teaching/Training 15. Financial Aspects
16. Technical Aspects 16. Technical Aspects
Source: [5]
26
as one of the least focused elements; this can potentially impact on the resource and the focus destined to training programs in the organizations, lack of delegation and also the increasing in the chances of problems during succession.
2.3 HEURISTICS AND BIASES
During the decision-making process, several restrictive factors tend to influence and prevent a more rational evaluation on our judgment. These restrictive mechanisms are the focus of the extensive research of Daniel Kahneman with his colleague Amos Tversky, summarized in [32]. They developed the concept of two different thinking systems; the system 1 is intuitive, fast, automatic, effortlessly, implicit and emotional. We take the majority of our decisions using this system. The system 2 is diametrically different; it’s slow, consistent, striven, demands high level of energy, explicit and logic.
In the majority of the situations, our thinking in the system 1 is sufficient, would not be practical for instance, to think rationally in each choice that we make when we are buying something in the grocery store. But, the logic of the system 2 should be dominant when we have important decisions to make [33].
The model proposed by Kahneman with the 2 systems is convergent with the concepts presented in [34], where the economist Eduardo Giannetti describes the differences in our approach during the evaluation of short and long term situations; our tendency is to evaluate the reward on the utility of the decision using a hyperbolic curve in relation to time, in other words, if the decision appears to generate a high level of utility in the short term, in the majority of the time we prefer this option instead of gingerly prioritize long term gains. This is a typical situation of a decision that is dominantly taken by the reckless system 1.
The heuristics are the simplifications of reality that we generally use to decide. Here is a summarized list of decision biases described in [32] and [33]:
1. Overconfidence: the main characteristic is the over optimism, the person believes that his decisions and his competence to decide are exaggerated. Risks and little considered and the impacts are briefly evaluated. Usually the D-quadrant dominant profile tends to face more problems with this bias.
27
dominant profile tends to face more problems with this bias because is the more conservative. But, the C-quadrant dominant profile may also face this problem. Normally this profile relies on others opinion, if the ones that he/she chooses to consult are the ones that will only confirm the decision with no confrontation, then, the result is also impacted.
3. Anchoring: tendency to overvalue in received information during the early stages of a decision-making process or negotiation. We tend to give too much importance to this first information, generally is hard to move away mentally from this point, which is why it’s called anchoring. The initial offer from a seller can be mentioned as an example of this type of bias. The A-quadrant and B-quadrant are the ones that are more susceptible to face difficulties; when someone receives an anchor, dialogue and the creation of innovative alternatives are the best solutions, characteristics that are more natural for C-quadrant and D-quadrant persons.
4. Representativeness: is the bias related to the attempt to prejudging a certain event only considering the past data from common elements of this event, ignoring the data that could deny this framing tendency. For instance: if someone studied in a renowned University, we have the tendency to quickly conclude that his potential is above the average, avoiding checking the specificities of this particular candidate. The C-quadrant dominant profile is more exposed to this bias considering the fact that this profile is more averse to data analysis, but also the D-quadrant because of the tendency of jumping directly to the conclusions.
5. Availability: bias that is related to the overestimation of recent information, like what is published in the media or the most recent reports of a company. A classic example is the evaluation of an employee that has a consistent performance over a semester and two weeks before the evaluation commits an error; usually the manager will overvalue this last event and decrease the scoring in the evaluation. Once again, the C-quadrant and D-quadrant are more exposed to this bias.
6. Commitment: the attachment to a previous decision, even when becomes clear that this decision is an error. Is the difficulty to admit failures and move on. This is common with bad investments, hires and strategy. More common between A-quadrant and B-quadrant profiles.
28
decisions in the hope of obtaining a model. The A-quadrant with his analytical mindset is more exposed to these conditions.
2.4 DIVERSITY
2.4.1 Diversity in the organizations
The findings of the mentioned studies using the HBDI clearly indicate the specialization of thinking preferences among different professions and in a minor degree between nationalities. During several decades the dominant strategies for organizational architecture were focused exactly in the specialization according to specificities of each sector of an organization.
In such scenario, the professional that "fit" in the prevailing model have more chances of success. As defined in [21], "fit" is related to the interpersonal congruence – the degree to which members’ appraisals of one another are similar to their self-assessments on dimensions relevant to team functioning.
The situation is antagonist with the ones with a different thinking approach; besides the fact that they will potentially face much more difficulties to integrate in the team, their ideas will sound controversial and in the long term the lack of motivation created by this gap may interfere in the productivity and satisfaction.
Unfortunately, team members often cloak their weaknesses, disclose their true self-assessments reluctantly or not at all, feel threatened when others challenge their expertise, and act defensively in the face of such challenges. At the same time, they may be quick to form biased impressions of others, often based on stereotypes that obscure unique talents [21].
The avoidance of diversity in a team or sector has its inherent advantages and disadvantages, exemplifying the advantages: cohesion, agility in the decision-making process and decrease in the occurrence of conflicts. In the other hand, the disadvantages are related to the increase in the needed time to reach consensus, it’s more demanding from a managerial point of view lead a diversified group and ultimately it decreases the potential for innovation.
29
approach could have been useful in the past when the scenario changes used to be gradual and with a slow pace, but the current world demands organizations with high level of creativity and innovation.
But the additional effort certainly pays off; the results presented in [22] confirm this hypothesis. The article describes two forms of diversity: inherent and acquired. Inherent diversity involves traits you are born with, such as gender, ethnicity, and sexual orientation. Acquired diversity involves traits you gain from experience: Working in another country can help you appreciate cultural differences, for example, while selling to female consumers can give you gender smarts.
The result of the research with more than 1,800 professionals and 40 case studies shown that by correlating diversity in leadership with market outcomes as reported by respondents, companies with 2-D diversity out-innovate and out-perform others. Employees at these companies are 45% likelier to report that their firm’s market share grew over the previous year and 70% likelier to report that the firm captured a new market [22].
It’s a mistake to conclude that if a group of professionals with a strong D-quadrant are gathered together the innovation will be increased per se, they only have a stronger tendency to develop a holistic view. Innovation is something that may emerge from procedures and operations (B-quadrant), from a new look on data (A-quadrant) or from brainstorming sessions with strong interpersonal interaction (C-quadrant) for instance.
A much more powerful approach is the sum of all these different capabilities, as described in [31] - diversity is the crucial element for group creativity. Innovation teams tasked with creating new products or technologies or iterating existing ones need tension to produce breakthroughs, and tension comes from diverse points of view. This is the opposite of groupthink, the creativity-killing phenomenon of too much agreement and too similar perspectives that often paralyzes otherwise great teams.
2.4.2 Diversity in the Executive Education
30
Internationalization became a strong trend; with the continuous growth in the level of commercial relations with different countries, the possibility to interact remotely in real-time with teams dispersed all over the globe and with the challenge to understand and address the cultural differences of consumers and suppliers, it’s vital the exposure of the students to environments with diversity.
One of these programs was developed between Georgetown University from the USA, ESADE from Spain and FGV/EBAPE from Brazil. All top universities within their own countries, the developed program consists in four different modules in the USA, Brazil, China and Spain, with academic content and local experiences with visits to companies and interaction with outstanding professionals to discuss the culture, business environment, economics and trends just to name a few.
31
3 RESEARCH METHODOLOGY
The research was conducted using online forms, through the tool "Form" provided by GoogleTM, once the questions are listed, a link is provided in order to forward to all the participants. All the 23 students from the first cohort answered the questionnaire after the last module of the program in Madrid in June of 2014.
Besides the HBDI questions, additional questions regarding socioeconomic aspects and work experience were introduced to enrich the discussion on the results. The additional questions are listed in the chart 4.
Chart 4: Socioeconomic and work experience questions
Question Query Alternatives
1 Do you currently work in an organization of which sector? Private sector
Public sector
2 Name -
3 What’s your age? -
4
Choose the area of your bachelor degree
Engineering, Mathematics and
Science
Health Sciences
Social Sciences
5
What's the level of your current position?
Director
Manager
Supervision/Coordination
Junior
6 How many years of professional experience do you have? -
The complete questionnaire is available in the Appendix A. The advantage of using a framework like the HBDI is the possibility to compare the obtained results for a particular group with different databases, like the most common profile observed among CEO’s or professionals from particular professional segments.
3.1 STATISTICAL VALIDATION
32
achieve these parameters. If only the confidence level changes to 3 points, all the answers would be necessary to meet the requirements.
Nevertheless, the conclusions can only be attested to this particular population or compared with larger populations for validation purposes. It’s not possible to infer any conclusions from this group and extend it to a significant extern population.
As mentioned before, the HBDI has 160 alternatives and the participant should choose exactly 40 of them. Once the results from all the 23 participants were obtained, all the 160 possible alternatives from the HBDI and the 40 marked answers were converted into a 160 x 23 chart for statistical processing; the marked questions were represented as "1" and the non-marked questions as "0", as seen in the Chart 2 for the first question of the HBDI part of the questionnaire.
Chart 5: Chart with answers for the first question of the HBDI session
3.1.1 The Cronbach’s Alpha
According to [6], presented by Lee J. Cronbach in 1951, the Cronbach’s alpha coefficient is one of the reliability estimates for a questionnaire that has been applied in a research. Since all the items of a questionnaire used the same scale of measurement, the alpha coefficient, with alpha between [0,1] is calculated from de variance of the individual items and the covariance between the items using the following equation:
𝛼 =
𝑘−𝑘(1 −
∑= 𝑆𝑖33
Where: k is the number of items in the questionnaire, Si2 is the variance of the item i and St2 is the total variance of the questionnaire.
Thus, the alpha coefficient can be calculated in two steps: first is necessary the calculation of the variance of each column "i", denoted by Si2 and then add all these variances. In the second step, is necessary obtain the total sum of the choices of every participant (elements of the last column of the Chart 3) and calculate the variance of these sums [6].
Chart 6: Example of answers of a questionnaire to exemplify the calculation process
Participant Question 1 Question 2 … Question i Question k Total
1 X11 X12 … X1i X1k X1
2 X21 X22 … X2i X2k X2
3 X31 X32 … X3i X3k X3
4 X41 X42 … X4i X4k X4
… … … … …
N Xn1 Xn2 … Xni Xnk Xn
Source: [7]
Considering that the total variance can be restructured as the sum of the variance of the items added twice to the covariance of these items, the equation (1) can be rewrite in an alternative manner, which according to [8], facilitates the computational processing [6].
𝛼 =
𝑘−𝑘1 −
∑= 𝜎∑= 𝜎
⏟ + ∑ ∑ 𝜎⏟
(2)
In the equation (2), the term "A" represents the sum of variances of the items (the sum of elements in the main diagonal in the covariance matrix). The term "B" represents two times the sum of the covariance of the items, in other words, two times the sum of the elements not belonging to the main diagonal in the covariance matrix [6].
34
category, in other words, the initial matrix with 160 x 23 inputs was divided into 4 different matrices with 40 x 23 answers.
After this step, the software Matlab was used to compute the results, the following code was used to process the data from the input matrix "X":
k=size(X,2); % Calculate the number of items
VarTotal=var(sum(X')); % Calculate the variance of the items' sum
SumVarX=sum(var(X)); % Calculate the item variance
a=k/(k-1)*(VarTotal-SumVarX)/VarTotal; % Calculate the Cronbach's alpha
The result per category is indicated in the chart 4.
Chart 7: Cronbach’s Alphafor each HBDI’s category
Category Cronbach’s Alpha
A Quadrant – Superior Left 0.74 B Quadrant – Inferior Left 0.64 C Quadrant – Inferior Right 0.75 D Quadrant – Superior Right 0.72
According to [6], the reliability of the Cronbach’s Alpha can be summarized according to the Chart 5.
Chart 8: Cronbach’s Alpha reliability scale
Reliability Very Low Low Moderate High Very High
Cronbach’s Alpha α ≤ 0.30 0.30 < α ≤ 0.60 0.60 < α ≤ 0.75 0.75 < α ≤ 0.90 α > 0.90 Source: [6]
According to this data and also considering the information available in [9] that shows that for small groups (smaller than 50 participants), coefficients that are bigger than 0.5 can be considered satisfactory. In the present research, 3 categories are within the most used threshold for social science researches (0.7) and only the B Quadrant is out of this range but still in the valid area as long as the results are evaluated with precaution.
The calculation also is influenced by inherent characteristics of the questionnaire, such as the total number of questions and by some behavioral elements. For instance, if for a particular question all the participants or the majority marks it, the variance is null, impacting in the overall result. For this reason is important to compare the obtained results with other studies which also used the HBDI as the research tool.
35
36
4 DATA ANALISYS AND DISCUSSION OF RESULTS
4.1 RESULTS FOR THE COHORT
The consolidated result for the cohort is shown in the Figure 9: Figure 9: HBDI profile for CIM 1 cohort
The profile indicates dominance from Quadrant D (11.26) followed by the Quadrant A (10.17), followed by Quadrant C (9.61) and lastly the Quadrant B (8.96).
Before jumping into any conclusion and to check if it’s possible to generalize the average profile as a proper representation of the individuals and to support the discussion, the standard deviation and the relative standard deviation (RSD) has been used, according to [18]; the RSD index represents the standard deviation expressed as a percentage of the mean. It is also known as the coefficient of variation (CV) or %SD. This is easily calculated from the standard deviation (s) and the mean (𝑥̅):
𝐷 =
𝑥̅(3)
37
Chart 9: Standard deviation and RSD per HBDI category
Category Standard deviation RSD
A Quadrant – Superior Left 4.41 43.36%
B Quadrant – Inferior Left 3.20 37.71%
C Quadrant – Inferior Right 4.34 45.16%
D Quadrant – Superior Right 4.36 38.72%
The analysis of the outcomes enables the conclusion that it’s not possible to group the individuals into a single profile; the obtained RSD is substantially high, with a clear indication of diversity within the cohort.
Another way to represent the diversity of the individuals in comparison with the average profile is shown in the Figure 10, where the blue profile represents the average profile for the cohort and all the individual profiles are dashed.
Figure 10: Average profile (blue) and individual profiles (dashed)
38
Figure 11: Average profile per quadrant (red line) and individual score (colored lines)
39
The histogram shows a spectral density distribution that is not close to a normal Gaussian curve (quadrant C is the only exception), confirming the previous conclusions.
Considering that the average profile is not statistically representative, the next step is the investigation using the additional socioeconomic data to split the population into clusters; this is the focus of the following sections. The only additional parameter that has been not used for this evaluation was the question where the participant should reply if he/she was working in the public or private sector; among the participants only 3 are currently working on the public sector so the comparison is severely compromised.
4.2 RESULTS PER GENDER
According to [5], the implications for team selection are profound because there are important differences in male and female thinking preferences that would argue for gender-balanced teams as the most effective in general and particularly when creative problem solving is involved.
The results per genre are shown in the Figure 13: Figure 13: Results per gender
40
Chart 10: Standard deviation and RSD per genre
Category Standard deviation (Male) Standard deviation (Female) RSD (Male) RSD (Female)
A Quadrant 4.71 3.90 45.41% 40.16%
B Quadrant 3.48 2.31 40.94% 23.1%
C Quadrant 4.78 3.09 52.41% 28.85%
D Quadrant 4.76 2.88 39.67% 30.09%
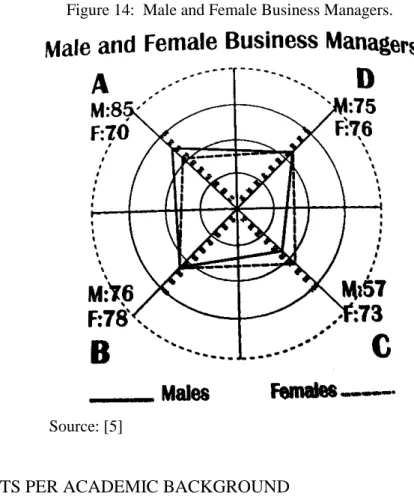
The statistical data reveals an important diversity within the groups, but in all the quadrants the female group presents consistently lower indexes of RSD compared to the male group. The result is consistent with the data available in [5] – Figure 14; where after evaluating professionals in 20 different organizations, predominance in the A quadrant for the male group was perceived in opposition to dominance in the C quadrant for the female group.
This is coherent with the perception that women's are more related to activities that are relationship oriented and men to activities that are more analytical.
However, the author detected at the time a nearly balance in the B and D quadrants, for CIM participants this is not the case. The female group has a clear inclination towards the B quadrant; one possible explanation is the bigger proportion of financiers (3/7) in comparison with the male group (3/16).
41
Figure 14: Male and Female Business Managers.
Source: [5]
4.3 RESULTS PER ACADEMIC BACKGROUND
42
The standard deviation and RSD per academic background is shown in the Chart 11.
Chart 11: Standard deviation and RSD per academic background
Category Standard deviation (Engineering, Mathematics
and Science)
Standard deviation (Social
Science)
RSD (Engineering, Mathematics and
Science)
RSD (Social Science)
A Quadrant 3.39 4.92 29.92% 52.22%
B Quadrant 3.04 3.34 36.49% 35.72%
C Quadrant 2.19 5.25 25.61% 51.02%
D Quadrant 4.60 4.34 38.98% 39.74%
Even with high values of RSD in all the quadrants, the result is still consistent with the results presented in [5], for instance, the typical profiles encountered for active professionals in social science activities is shown in the Figure X.
Figure 16: Multidominant Occupational Profile Averages.
Source: [5]
43
more focus in the humanistic factors instead of focus on details and organization for businesspersons nowadays.
On the engineering, mathematics and science group, also there’s a clear correlation with the profiles obtained with engineers in [5], as shown in the Figure 17.
Figure 17: Average Profile of Engineering Occupations.
Source: [5]
The similarities are noticeable in the dominance of A and D quadrants upon B and C. Taking the profiles exhibited in the Figure 17, the computer software engineer is the one with more similarities. Make sense, considering that several participants in the group have professional experience and academic background in this particular industry.
4.4 RESULTS PER CURRENT JOB POSITION
44
Figure 18: Results per current job position.
The standard deviation and RSD per current job position is shown in the Chart 12.
Chart 12: Standard deviation and variance per current job position
Category Standard deviation (Director) Standard deviation (Manager) Standard deviation (Supervisor) RSD (Director) RSD (Manager) RSD (Supervisor)
A Quadrant 3.76 5.27 5.03 41.04% 47.39% 45.23%
B Quadrant 2.78 3.96 3.05 32.70% 44% 28.61%
C Quadrant 3.02 6.31 1.52 34.87% 56.74% 16.29%
D Quadrant 4.35 2.49 3.21 31.75% 28.45% 38.53%
Starting the analysis by the quadrant A, it’s noticeable the decreasing value in this quadrant, related to the capacity to solve problems using an analytical approach. The possible explanation is that with the career progression, the director or CEO has more personnel available to make preliminary analysis on substantial amount of data and to support him/her during the decisions.
Almost the same evaluation could be extended for the B quadrant, over the career is less required to be directly related to procedures and sequential activities.
45
managerial trends, the directors or CEOs should improve their capacity in this quadrant to increase their communication and humanistic effectiveness.
The quadrant D presents a direct progression towards holistic and integrative approach in relation to career evolution. This conclusion also is consistent; the role of the professionals that guide organizations is to deal with future scenarios and to foster the innovative and entrepreneurial spirit.
4.5 RESULTS PER YEARS OF PROFESSIONAL EXPERIENCE The results per sector are shown in the Figure 19:
Figure 19: Results per years of professional experience.
The standard deviation and RSD per years of work experience is shown in the Chart 13.
Chart 13: Standard deviation and RSD per years of work experience
Category Standard deviation (7-14 years) Standard deviation (14-21 years) Standard deviation (21-28 years) RSD (7-14 years) RSD (14-21 years) RSD (21-28 years)
A Quadrant 4.89 3.53 5.54 52.41% 32.09% 54.31%
B Quadrant 1.92 2.81 4.32 26.59% 26.09% 49.09%
C Quadrant 3.74 3.73 6.59 38.71% 42.53% 59.90%
46
The quadrant A and B confirms the trend of young professionals that are less attached to analytical (A quadrant) and/or sequential processes (B quadrant). The prevalence in terms of concentration in these quadrants is by professionals with more years of work experience.
The quadrant C does not allow any analysis in terms of direct trend, only the observation of differences in the dominance per range of years of experience. On quadrant D, the highlight is the high difference from the young professionals in comparison with the other categories. This is a trend also; the capacity to deal with innovation is becoming more and more dominant considering the increasing dynamics and fast pace changes. This capacity is overcoming the characteristics that are present in the quadrant B, related to formal procedures. The result matches the data available in [19] and shown in the Figure 20, where the author explains the shift in the paradigm of what’s considered the ideal CEO per decade.
Figure 20: Paradigm shift in thinking skills required for success.
Source: [19]
The professionals with more years of experience have a profile that is more related to the dominant trend in the 1970’s while the young professionals are more aligned with the evolutionary trend of more focus on quadrants C and mainly D.
4.6 RESULTS PER AGE
47
with age between 44-55 years old have similarities with the desired profile in the 1970’s as seen in the Figure 20, the professionals with age between 33-44 years old represents the beginning of the shift from the left to the right side and finally the group with age bellow 33 years old indicate a strong predominance in the quadrant D.
The results per age are shown in the Figure 21: Figure 21: Results per age.
The standard deviation and RSD per age is shown in the Chart X:
Chart 14: Standard deviation and RSD per age
Category Standard deviation (>33 years) Standard deviation (33-44 years) Standard deviation (44-55 years) RSD (>33 years) RSD (33-44 years) RSD (44-55 years)
A Quadrant 3.27 5.27 3.61 35.54% 52.7% 31.86%
B Quadrant 1.87 3.39 3.44 23.37% 39.88% 32.27%
C Quadrant 2.12 5.21 3.88 26.5% 50.04% 41.58%
48
4.7 RESULTS PER FUNCTIONAL AREA OF MANAGENT
The results per functional area of management are shown in the Figure 22: Figure 22: Results per functional area of management.
According to [20], capabilities are most often developed in specific functional areas, such as, marketing or operations, or in a part of a functional area, such as, distribution or R&D. It is also feasible to measure and compare capabilities in functional areas.
The author divided organizations into the following capabilities: financial, marketing, operations, personnel, information management and general management.
Using these categories and considering the current job position of the participants, the group is divided in 3 different clusters: General management (n=15), Financial (n=6) and Operations (n=2).
49
Figure 23: Profile for entrepreneurs.
Source: [5]
On the group "Financial Management", it’s possible to establish the correlation with the groups "Bank Manager" and "Bank Manager",
Figure 24: Profile for Bank Managers and Finance Managers.
50
The key factors is the dominance from quadrant A over quadrant D and from quadrant B over quadrant C, this is coherent with the inherent characteristics of this professions, a close relation to data analysis, procedures and regulations.
On the "Operations Management" group, besides the small sample, also the essential characteristics are present, the bigger score in the quadrant A over quadrant D and same from quadrant B over quadrant C. Usually this profile has common elements with the group "Financial Management", a predominant analytical and procedural professional.
Figure 25: Highlight of Operations Manager’s profile.
51
5 CONCLUSIONS AND RECOMMENDATIONS
The conclusion points to the confirmation of the hypothesis that the CIM cohort is a diverse group from the decision-making process and cultural point of view. Considering the purpose of the program into account, this finding is an encouraging factor for the continuity of the program in the coming years as it promotes for each individual the opportunity to meet and learn with a variety of professionals from several different countries, industries and the most important, different mindsets.
The high levels of standard deviation that was observed for the general analysis and even during the evaluation of different clusters indicates two interesting factors: the own evidence of diversity but also the complementarity of the individuals. The general profile is align with the modern trend in management, a more balanced profile but with dominance from quadrants D (holistic and innovative) and C (humanistic). The sum of representatives from several different countries, with different ages and backgrounds was the key factor to obtain this result.
The HBDI questionnaire proves to be a simple and practical tool to identify the decision-making profile and the possibility to compare to robust databases with thousands of professionals facilitate the management of companies, team building and self-diagnosis.
One important recommendation is the possibility to use the inputs from the first cohort and develop a longitudinal research with the coming cohorts in order to improve the
52
6 BIBLIOGRAPHY
1 Mclaughlin, D. (2006). Strengthening executive decision making. Human Resource Management.
2 Drucker, P. (1954). The practice of management. New York: Harper & Row.
3 Simon, H. (1960). The new science of management decision. New York: Harper.
4 Thelma, J. (2007). Business Organisation & Management (For B. Com Couese Of Delhi University). Tata McGraw Hill Education.
5 Herrmann, N. (1996). The whole brain business book. New York: McGraw-Hill.
6 Freitas, A., & Rodrigues, S. (2005). A avaliação da confiabilidade de questionários: Uma análise utilizando o coeficiente alfa de Cronbach.
7 Cronbach, L.J. (2004). My current thoughts on coefficient alpha and sucessors procedures. Educational and Psychologycal Measurement.
8 Peter, J. (1999). Reliability: A Review of Psychometric Basics and Recent Marketing Practices. Journal of Marketing Research.
9 Flanagan, J. C., & Davis, F. B. (1965). Educational Measurements and Their Interpretation.American Educational Research Journal.
10 Khalid Ali Bawaneh, A., Ghani Kanesan Abdullah, A., Saleh, S., & Yin Yin, K. (2011). Jordanian Students' Thinking Styles Based on Herrmann Whole Brain Model. International
Journal of Humanities and Social Science.
53
12 Lumsdaine, M., & Lumsdaine, E. (1995). Thinking Preferences of Engineering Students: Implications for Curriculum Restructuring.
13 Baars, B. (2007). Cognition, brain, and consciousness: Introduction to cognitive neuroscience.
14 Carter, R., & Aldridge, S. (2009). The human brain book. London: DK Pub.
15 Kosslyn, S., & Wayne Miller, G. (2014, January 27). The Theory of Cognitive Modes. Retrieved May 7, 2014, from
http://www.psychologytoday.com/blog/the-theory-cognitive-modes/201401/left-brain-right-brain-wrong
16 Whiteman, H. (2013, August 19). 'No such thing' as left or right brained people. Retrieved June 10, 2014, from http://www.medicalnewstoday.com/articles/264923.php
17 MacLean, P. (1990). The triune brain in evolution: Role in paleocerebral functions. New York: Plenum Press.
18 Boddy, R., & Smith, G. (2009). Statistical methods in practice for scientists and technologists. Chichester, U.K.: Wiley.
19 Herrmann, N. (1989). The creative brain (2nd ed.). Lake Lure, N.C.: Brain Books.
20 Kozami, A. (2002). Business Policy and Strategic Management. Tata McGraw-Hill
Education.
21 T. Polzer, J. (2008). Making Diverse Teams Click. Harvard Business Review.
54
23 Gil, A. (2002). Como elaborar projetos de pesquisa. São Paulo: Atlas.
24 March, J., & Heath, C. (1994). A primer on decision making: How decisions happen. New York: Free Press ;.
25 Comparing Assessments - The Answers Lie in the Premise. (2012, January 1). Retrieved April 14, 2014, from
http://www.herrmannsolutions.com/uploads/100029_practitionersarea/100721.pdf
26 Hammond, J., Keeney, R., & Raiffa, H. (1998). The Hidden Traps in Decision Making.Harvard Business Review, (76).
27 Bunderson, C. (1985). The Validity of the Herrmann Brain Dominance Instrument.
28 T. Ho, K. (1988). The Dimensionality and Occupational Discriminating Power of the Herrmann Brain Dominance Instrument.
29 Schkade, L.L., & Potvin, A.R. (1981). Cognitive style, EEG waveforms and brain levels. Human Systems Management.
30 Hofstede, G. (2001). Culture's consequences: Comparing values, behaviors, institutions, and organizations across nations (2nd ed.). Thousand Oaks, Calif.: Sage Publications.
31 Comstock, B. (2012, May 11). Want a Team to be Creative? Make it Diverse. Retrieved
from http://blogs.hbr.org/2012/05/want-a-team-to-be-creative-mak/
32 Kahneman, D. (2011). Thinking, fast and slow. New York: Farrar, Straus and Giroux.
33 Bazerman, M. (1986). Judgment in managerial decision making. New York: Wiley.
55