Managing Corporate Liquidity of TISCO LTD:
An Empirical Study
Dr. Partap Singh
Head & Asstt. Professor, Deptt. of Management studies, (SDITM)
NC Group of Institutions Israna, Panipat, Haryana
Dr Sanjay Singla
Professor and Head , Deaprtment of CSE IET Bhaddal Technical Campus , Ropar
Abstract - Liquidity is the ability of a company to meet the short term obligations (which mature within one accounting year).It is the ability of the company to convert its assets into cash. Inability of firm to meet the short term liabilities may affect the company’s operations as well as its goodwill. It may lead firm to miss the incentives offered by the suppliers of credit, services, and goods and loss of such incentives may result in higher cost of goods and services that affect the profitability of the firm. The management of TISCO should also try to maintain a definite proportion among different components of working capital in regard to overall current assets to keep and adequate quantum of liquidity all the times. Such proportion can be worked out on the basis of past experience by the management TISCO. The present paper aims to measure the management of liquidity of TISCO Company. It also examines the association between liquidity profitability of the company.
I. INTRODUCTION
Financial flexibility was observed as a vital determinant of investment and performance, mainly during the 1997-1998 crisis. Generally, the firms that are financially flexible prior to the crisis (i) have a superior ability to take investment opportunities, (ii) depend much less on the availability of internal funds to invest, and (iii) perform superior than less flexible firms during the crisis. A liquid firm generally has more financial flexibility to take benefit of new investment opportunities. There is a decline in corporate liquidity on account of mainly limited access to capital structures and an increase in corporate investments. Liquidity is the degree to which an asset or security can be bought or sold in the market without affecting the asset's price. Corporate liquidity concerned with the level of cash held by a company which involves strategic cash gained from profits, as well as cash secured from equity, debt or hybrid securities. There is inverse relationship between profitability and liquidity. Therefore, shareholders may not like high liquidity.
II. OBJECTIVE OF THE STUDY
I. To work out the optimum liquidity position of the company; II. To know the impact of financial crisis on the liquidity of the firm; III. To analyze the association between profitability and liquidity.
III. RESEARCH METHODOLOGY
Where r= Coefficient of Correlation between two samples; n= No. of pairs of observation, and v= degree of freedom= n – 2
To measure the level of corporate liquidity the following financial ratio has been used:
A. Liquidity Ratios: Liquidity is ability of firm to meet its current obligations as and when they become due. The liquidity position of a firm will be satisfactory if current assets are sufficient to pay current liabilities. It can be measured as under:
i. Current Ratio or Working Capital Ratio: It states the relationship between current assets and current liabilities.
A high current ratio represents a good liquidity position of the firm while a low current ratio represents a poor position of liquidity. An increase in the current ratio reflects the improvement in the liquidity position of the firm. On the other hand, a decrease in the current ratio states deterioration in the liquidity position of the firm.
The ideal current ratio is 2:1. It means current assets should be double the current liabilities. It represents the satisfactory liquidity position.
A high current ratio than ideal ratio is better after a point; but shareholders does not like it as it means a huge capital tied up in inventory or debtors. It may be affected by window dressing; so, a firm can’t believe on it fully.
ii. Quick or Acid Test or liquid Ratio: It states the relationship between liquid assets and current liabilities.
Liquid Assets= Current Assets – (Prepaid Expenses +Inventories)
Liquid assets are that assets are converted into cash within a period of short time (usually one year) without any loss in value. A current ratio equal to 1:1 is ideal ratio which represents satisfactory position of liquidity. It means to pay current liabilities; there should be liquid assets equal to current liabilities. But, it may give wrong result, if all debtors can be realized to meet the current needs. . In case of slow moving inventories and slow credit collections, both ratios may give unsatisfactory results regarding liquidity. iii. Absolute liquid Ratio or Cash position Ratio: It represents the relation between absolute liquid
assets and current liabilities. Absolute liquid assets are consists of cash at hand and cash at bank, and temporary investments or marketable securities.
Absolute
An absolute liquid ratio equal to 1:2 is an ideal ratio which represents satisfactory level of inventory. It means half absolute current assets are sufficient to pay current liabilities.
A. Activity or Efficiency Ratios: Activity ratio also known as turnover ratio states the speed with which assets are converted into sales. These consider movement of current assets.
i. Debtor or Receivable Turnover Ratio: It states the relationship between credit sales and average debtors. It states the speed at which cash is received from debtors.
Trade debtors include sundry debtors, Bill Receivable, and Account Receivable.
Average Trade Debtors =
Or
When Credit sale, opening and closing debtors are not given, then it is computed as under:
Debtors Turnover Ratio=
The higher debtors turnover ratio states the high speed of recovery from debtors while Low ratio states low recovery from debtors. There is no ideal ratio for it. So, it can be compared with the ratio in similar business.
ii. Average Collection Period Ratio: It indicates the average number of days required to convert receivable into cash. The shorter the average collection period means speedily payment by debtors.
Average collection period =
iii. Stock Turnover Ratio or Inventory Turnover Ratio: It states the relationship between the costs of goods sold and average inventory at cost. It indicates the speed at which the funds invested in inventories are converted into sale.
Inventory Turnover Ratio=
Where cost of goods sold = Net sales – Gross profit
Average Inventory =
A high stock turnover ratio is good for firm than a low stock turnover ratio.
Iv. Inventory Conversion Period: It indicates the number of days in which the fund invested in inventory is converted into sale.
Formula:
Inventory Conversion Period=
IV. REVIEWOFRELATEDLITERATURES
A brief review of the different efforts of research in the field is presented as under:
Sanger (2001) studied that it should be critical for to a firm to sustain their short term investment since it will ensure the ability of firm in longer period. The crucial part in managing working capital is required maintaining its liquidity in day-to-day operation to ensure its smooth running and meets its obligation.
Ghosh and Maji (2003) studied the efficiency of working capital management of Indian cement companies during 1993 to 2002. They calculated three index values-performance index, utilization index and overall efficiency index to measure the efficiency of working capital management, instead of using working capital management ratios. By using regression analysis and industry norms as a target efficiency level of individual firms, they tested the speed of achieving target level of efficiency by individual firms during the period of study and found that some of the sample firms successfully improved efficiency during these years.
Van Horne and Wachowicz (2004) point out that excessive level of current assets may have a negative effect of a firm’s profitability, whereas a low level of current assets may lead to lowers of liquidity and stock-outs, resulting in difficulties in maintaining smooth operations.
Garcia-Terual et all (2007) collected a panel of 8872 small to medium-sized enterprises from Spain covering the period 1996-2002. They tested the effects of working capital management on SME profitability using the panel data methodology. The results, which are robust to the presence of endogeneity, demonstrated that managers could create value by reducing their inventories and the number of days for which their accounts are outstanding. Moreover, shortening the cash conversion cycle also improves the firms profitability.
Cheakobraty (2009) evaluated the relationship between working capital and profitability of 25 selected companies in the Indian pharmaceutical industry during the period 1996-97 to 2007-08.Inadequacy of working capital may lead to the firm to insolvency, whereas excessive working capital implies idle funds which earns no profits. Therefore, efficient management of working capital is an integral part of the overall corporate strategy to improve corporate profitability. The partial regression coefficients shown in the multiple regression equation of ROCE on CR, ITR and DTR fitted in this study revealed that the liquidity management, inventory management and credit management made positive contribution towards improvement of the corporate profitability.
Mathuva (2009) examined the influence of working capital management components on corporate profitability by using a sample of 30 firms listed on Nairobi Stock Exchange for the periods 1993-2008. He used Pearson and Spearmans correlations, the pooled ordinary least squares and the fixed effects regression models to conduct data analysis. The key findings of his study were that there exists a highly significant negative relationship between the time it takes for firms to collect cash from their customers and profitability, there exists a highly significant positive relationship between the period taken to convert inventories to sales and profitability and there exists a highly significant positive relationship between the time it takes for firms to pay its creditors and profitability.
NANDI (2011) made an attempt to examine the influence of working capital management on corporate profitability. For assessing impact of working capital management on profitability of National Thermal Power Corporation Ltd. during the period of 10 years i.e., from 1999-2000 to 2008-09 Pearson’s coefficient of correlation and multiple regression analysis between some ratios relating to working capital management and the impact measure relating to profitability ratio (ROI) had been computed and applied. An attempt had been undertaken for measuring the sensitivity of return of investment (ROI) to changes in the level of working capital leverage (WCL) of the studying company.
Yadav, R.A., (2011) Attempted to shed light on the empirical relationship between efficiency of working capital management and corporate profitability of selected companies in the Istanbul Stock Exchange for the period of 2005-2009. The companies should focus on working capital management in order to increase their profitability by seriously and professionally considering the issues on their cash conversion cycle which was derived from the number of days accounts payable, the number of days accounts receivable and the number of days of inventories. The findings suggested that it may be possible to increase profitability by improving efficiency of working capital.
Rajesh and Ramana Reddy (2011) studied that Management of working capital in terms of liquidity and profitability management is essential for sound financial recital as it has a direct impact on profitability of the company.
V. PROFILE OF TATA STEEL LTD.COMPANY
Tata Steel Limited (formerly TISCO and Tata Iron and Steel Company Limited) is among the top ten global steel companies. It’s headquartered in Mumbai, India and it is a subsidiary of Tata Group. TISCO was established by Jamsetji Tata in year 1907 and it had largest steel plant in the British empire in 1939. It started expansion plan and established its subsidiary Tata Inc. in New York in 1990 and the company changed its name TISCO to Tata Steel in year 2005. Tata Steel has a presence in around 50 countries with manufacturing operations in 26 countries. It serves customers in these market sectors globally:Automotive, Construction, Consumer goods, Engineering, Packaging, Lifting and Excavation, Energy and Power, Aerospace, Shipbuilding, Rail, Defense and Security. Its major competitors are Arcelor S Mittal, Essar Steel, JSW Steel, SAIL and VISA Steel.
The Tata Steel Group, with a turnover of US$ 22.8 billion in FY '10, has over 80,000 employees across five continents and is a Fortune 500 company. It is the eighth most-valuable Indian brand according to an annual survey conducted by Brand Finance and The Economic Times in 2010. It has also been listed as World's most ethical companies by Forbes.
VI. RESULTS &DISCUSSIONS
x Table 1 reveals that the average current ratio is 1.40 during study period which is not upto the standard of ratio of 2:1. The current ratio of company deteriorated continuously during the study period and was unable to reach the standard ratio of 2:1 in any financial year except the year 2006-07. Therefore, it may be concluded that the liquidity position of the company was not satisfactory. However, it may not be a judicious inference about the liquidity of the company on the basis of current ratio.
Table !: Showing Financial Ratios regarding Liquidity Management of TISCO Ltd.
Ratio / Years
2010-11
2009-10 2008-09
2007-08 2006-07 Average
Current Ratio 1.64 1.15 1.12 0.90 2.18 1.40
Cash ratio 0.56 0.49 0.25 0.12 1.14 0.51
(a)Inventory Turnover ratio
(b) Age of inventory 8.69
42.00
7.93
46.0
8.49
43.0
8.69
42.0
8.49
43.0
8.45
48
Debtor turnover ratio
(b) Age of Debtors
5.00
73
8.00
46
9.00
41
11.0
33
13.00
23
9.02
43 Current assets to total assets 27.03 16.73 15.30 68.81 49.29 35.6
x Table 1 Exhibits that the average cash ratio is 0.51during study period which is not upto the standard of ratio of 1:2. The cash ratio of company deteriorated continuously during the study period and was unable to reach the standard ratio of 1:2 in any financial year except the year 2006-07 & 2010-11. Therefore, it may be concluded that the liquidity position of the company was not satisfactory except the two years while remaining of the years the ability of the company to meet its short-term obligations was not satisfactory; but it may be considered as average. However, it may not be a judicious inference about the liquidity of the company on the basis of cash ratio.
x Table 1 shows that average inventory turnover ratio is 8.45; except the year 2009-10, all the financial years have inventory turnover ratio more than average ratio which may be considered as satisfactory.
x It can be observed from the table 1 that the average age of inventory is 48 days and age of inventory in each year is less than this average age of inventory during study period which is satisfactory.
x It has been found in table 1 that the debtor’s turnover ratio has decreasing trend during the study period from the year 2006-07 to 2010-11 and debtors turnover ratio in entire years except 2006-07less than average debtors turnover ratio which indicates low recovery from debtors. The debtors’ turnover ratio is very critical for 2010-11. Similarly, age of debtors increased during study period from 2006-07 to 2010-11 with an average of 43 days which indicates that payments b debtors are made delayed. The year 2010-11 most critical.
x Current Assets to Total Assets Ratio: It indicates the funds invested for working capital purpose and access the importance of current assets of a firm. It is observed from the table 1 that the ratio decreased continuously except the year 2007-08 with an average ratio 35.6. The average ratio is more than the ratio of 2008-09. 2009-10 and 2010-11. It was maximum in the year 2007-08 and minimum in the year 2008-09.
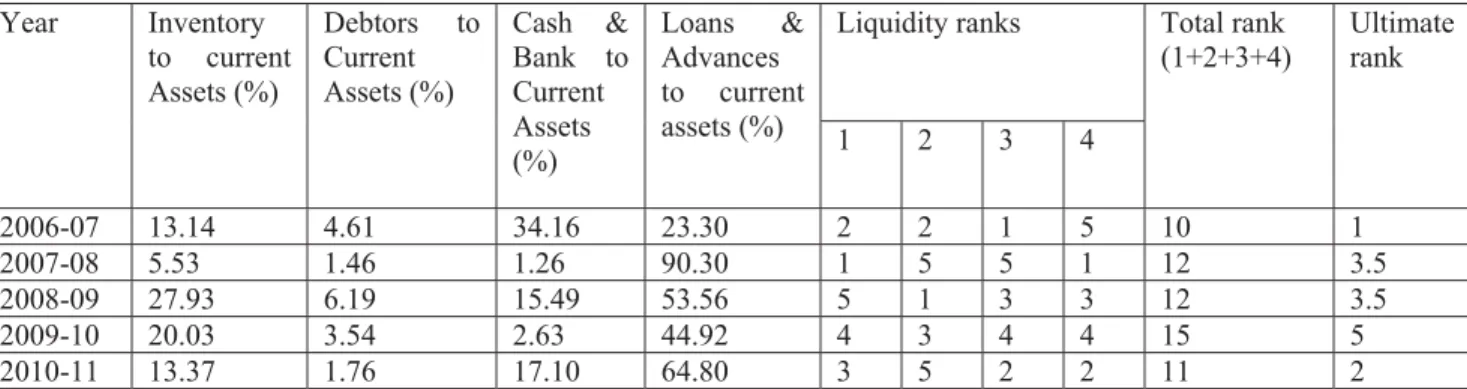
x To study the overall position of company, a system of ranking has been used to measure liquidity in which four ratios (given in table) are combined in a points score. In case of inventory turnover ratio having a low value indicates relatively favorable position and ranking has been made in view of this. On the other hand, in case of debtors to current assets ratio, cash bank to current assets ratio and loans & advances to current assets ratio having high value indicates favorable position of liquidity and ranking has been made in view of this. Further, ultimate ranking was made on the principle that lower the points scored the more favorable the liquidity position and viva-versa.
Table 2: Statement of Ranking in order of Liquidity of TISCO Ltd.
Year Inventory to current Assets (%)
Debtors to Current Assets (%)
Cash & Bank to Current Assets (%)
Loans & Advances to current assets (%)
Liquidity ranks Total rank (1+2+3+4)
Ultimate rank
1 2 3 4
2006-07 13.14 4.61 34.16 23.30 2 2 1 5 10 1
2007-08 5.53 1.46 1.26 90.30 1 5 5 1 12 3.5
2008-09 27.93 6.19 15.49 53.56 5 1 3 3 12 3.5
2009-10 20.03 3.54 2.63 44.92 4 3 4 4 15 5
2010-11 13.37 1.76 17.10 64.80 3 5 2 2 11 2
Source: Computed data from Annual Report 2007-12
Table 2 exhibits that the liquidity position of the company is best in the year 2006-07 and the second position in 2010-11 followed by the years 2007-08, 2008-09, and 2009-10 respectively. The liquidity position has been remained critical in the year 2009-10. There is a high variation in various current assets.
Year Current Assets to Total Assets Ratio
Return on average capital employed
Rank Difference
D= R1-R2
% Rank(R1) % Rank(R2)
2010-11 27.03 3 13.98 4 -1 1
2009-10 16.73 4 5.69 5 -1 1
2008-09 15.30 5 15.57 3 +2 4
2007-08 68.81 1 21.13 2 -1 1
2006-07 49.29 2 23.31 1 1 1
D =8
Source: Computed data from Annual Report 2007-12
The computation of rank correlation (r) between liquidity and profitability by using Spearman’s rank correlation method:
Null Hypothesis (H0): There is no significant correlation between liquidity and profitability.
Alternate Hypothesis (H1): There is significant correlation between liquidity and profitability.
r = 1 - = 1 - = 0.6
There is moderate degree positive correlation correlation between liquidity and profitability
Testing the Significance of an Observed Correlation Coefficient between liquidity and profitability by using t test:
Here, computed value of‘t’ is 1.298 while she critical value of ‘t’ at 5% level of confidence and 3 degree of freedom is 3.18. Spearman’s rank correlation method shows moderate positive relationship between liquidity and profitability. But,‘t’ test states that the computed value(1.298) of ‘t’ is less than the critical value(3.18) of ‘t’ which lead to th the acceptance of null hypothesis; so, the rank correlation coefficient between liquidity and profitability is statistically insignificant at 5 % level of significance.
It means the degree of impact of liquidity on its profitability is low and insignificant. However, there is positive association between liquidity and profitability.
VII. CONCLUSION&SUGGESTIONS
x The company must maintain a significant amount of cash & bank balance in order to meet its short-term commitments and for emergency requirements which will help the company to increase its margin of working capital and also to make adequate arrangement of credit facilities with banks so as to maintain good amount of liquidity.
x Since the average current ratios of the company under study are below the standard norm of 2:1 during the whole of the study period, it may be concluded that the liquidity position of the company was unsatisfactory and therefore, the company should try to maintain adequate amount of current assets to meet its short-term maturing obligations.
x The cash ratio of company deteriorated continuously during the study period and was unable to reach the standard ratio of 1:2 in any financial year except the year 2006-07 & 2010-11. The level of liquidity was found unsatisfactory, so, it is must require to the company to maintain adequate level of cash.
x The average inventory turnover ratio is 8.45; except the year 2009-10. However, inventory turnover ratio was more than average inventory turnover ratio which was considered as satisfactory.
x The debtor’s turnover ratio has decreasing trend during the study period except 2006-07 year which indicates low recovery from debtors and age of debtors indicates that payments debtors are made delayed. So, management should focus on its collection policy.
x Current Assets to Total Assets ratio indicates that the ratio decreased continuously except the year 2007-08 with an average ratio 35.6. So, the company should emphasis on the management of current assets.
x The liquidity position of the company is best in the year 2006-07 and the second position in 2010-11 followed by the years 2007-08, 2008-09, and 2009-10 respectively. The liquidity position has been remained critical in the year 2009-10. There was high variation in various current assets.
x The degree of impact of liquidity on its profitability was found low and insignificant. However, there was positive association between liquidity and profitability. So, management should try to establish optimum level of liquidity.
x Lastly the management of TISCO should also try to maintain a definite proportion among different components of working capital in regard to overall current assets to keep and adequate quantum of liquidity all the times. Such proportion can be worked out on the basis of past experience by the management TISCO.
REFERENCES
[1] Smith. (1980). “Profitability versus liquidity tradeoffs in working capital management, in readings on the management of working capital”, New York, St. Paul: West Publishing Company.
[2] Sanger, J. S. (2001). “Working capital: a modern approach”, Financial Executive, 69.
[3] Ghosh, S. K. and Maji, S. G. (2003). “Working Capital Management Efficiency: A study on the Indian Cement Industry”, The Institute of Cost and Works Accountants of India,
[4] Van Horne, J. C. & Wachowicz, J. M. (2004). “Fundamentals of Financial Management”, (12 ed.).
[5] Garcia-Teruel, P. J., & Martínez-Solano, P. (2007). “Effects of working capital management on SME profitability”, International Journal of Managerial Finance, 3(2), 164-177.
[6] Cheakraborty( 2009). “Liquidity, Risk and Profitability Analysis: A Case Study of Madras Cements Ltd.”. The Management Accountant, Oct. Vol-42, No. 10, pp. 784-789.
[7] Mathuva D, (2009). “The influence of working capital management components on corporate profitability: a survey on Kenyan listed firms”, Research Journal of Business Management, 3: 1-11.
[8] Nandi, K. C (2011), “Impact of Working Capital Management on Profitability, A Case Study of National Thermal Power Corporation Ltd.”, The Management Accountant, January 2011, pp.22-27
[9] Bardia S.C, 2004, “Liquidity Management: A Case Study of Steel Authority of India Ltd. The Management Accountants, June, Vol-39, No.-6, pp. 463-495.
[10] Bardia S.P, (2010) “Liquidity Management: A Case Study of Steel Authority of India Ltd. The Management Accountants, June, Vol-39, No.-6, pp. 463-495.
[11] Singh, R.A., (2011). “Working Capital Management – A Parametric Approach”. The Chartered Accountant, May, 2011 p-952.
[12] Rajesh, M. and N.R.V. Ramana Reddy, 2011. Impact of working capital management on firms’ profitability. Global J. Finan. Manage., 3(1): 151-158.
[13] Bhunia, A. (2010). “A study of liquidity trends on private sector steel companies in India, [14] Asian Journal of Management Research, Volume (6) 1, 620.