0103 - 5053 $6.00+0.00
Article
*e-mail: [email protected]
# Present Address: Centro de Ciências Naturais e Humanas, Universidade
Federal do ABC- UFABC, Rua Santa Adélia 166, Bangu, 09210-170 Santo André – SP, Brazil
Spectroscopic Study of Tb
3+(
β
β
β
β
β
-Diketonate)
3
:
α
α
α
α
α
-Cyclodextrin Inclusion
Compounds in Aqueous Solution
Anderson O. Ribeiro*,# and Osvaldo A. Serra
Departamento de Química da Faculdade de Filosofia Ciências e Letras de Ribeirão Preto, Universidade de São Paulo, Av. Bandeirantes 3900, 14040-901 Ribeirão Preto - SP, Brazil
Neste trabalho descrevemos a síntese de β-dicetonatos de Tb3+ e o aumento de sua solubilidade em água através da formação de compostos de inclusão em α-ciclodextrina (α-CD). Os complexos [Tb(ppa)3(H2O)2] e [Tb(ppa)3(phen)] (ppa=3-fenil-2,4-pentanodiona; phen = fenantrolina) foram sintetizados, caracterizados e a seguir incluídos em α-ciclodextrina. A inclusão foi confirmada por1H NMR e a estequiometria de associação determinada pelo método de Job. Nos espectros de excitação, os comprimentos de onda dos máximos de intensidade dos compostos de inclusão em solução aquosa [Tb(ppa)3(H2O)2]:α-CD e [Tb(ppa)3(phen)]:α-CD apresentaram-se deslocados em 15 e 60 nm, respectivamente, com relação aos comprimentos de onda dos máximos dos complexos não incluídos. Nos espectros de emissão, as bandas características do Tb3+ foram observadas mesmo após a inclusão dos compostos em α-CD.
In this work we describe how the inclusion of Tb3+β-diketonate chelates into the hydrophobic cavity of α-cyclodextrin enhances the solubility of the complexes in aqueous medium and leads to changes in their photophysical properties. To this end, the complexes [Tb(ppa)3(H2O)2] and [Tb(ppa)3(phen)] (ppa=3-phenyl-2,4-pentanedione; phen = phenantroline) were synthesized and characterized, and they were then included into α-cyclodextrin pockets. This inclusion was confirmed by1H NMR spectroscopy and the stoichiometry was determined by means of the Job method. In the excitation spectra, the maximum intensity wavelength of the inclusion compounds [Tb(ppa)3(H2O)2]:
α-CD and [Tb(ppa)3(phen)]:α-CD were displaced 15 and 60 nm respectively when compared with the non-CD starting complexes. The typical Tb3+ emission bands were maintained after inclusion of the complexes into α-CD and their subsequent solubilization in aqueous medium.
Keywords: terbium(III), β-diketonate, α-cyclodextrin, inclusion compound, luminescence
Introduction
Luminescence spectroscopy has been widely employed in the investigation of the properties and functions of biochemical systems.1 Information on the composition,
structure and biological activity of these systems can be obtained by means of the luminescence revealed by a sample. If a system is non-radiative, luminescent molecules or ions can be introduced and function as a luminescent probe.2,3
Some lanthanide ions, or their chelates, display better fluorescence features, like longer lifetime, larger Stoke’s shift, and sharper emission bands, for use as probe if
compared with organic compounds. Among the lanthanides, the most prominent ions are Eu3+ and Tb3+
because they are luminescent in aqueous solution, exhibit multiple emissions in the UV-Vis region by undergoing several eletronic transitions, and they can be determined at very low concentrations (picomolar).4,5
By means of the excitation and emission spectra of Eu3+ or Tb3+ complexes, it is possible to obtain information
about the composition and structure of various compounds. Analyzing changes in the excitation and emission intensities provides information on the ion coordination sphere. Emission lifetimes measurements in H2O and D2O gives information on the number of water molecules at the metal binding site. By using the intensity ratio and observing the structure of the bands, it is possible to draw the complexes conformational properties.6,7
Among the lanthanide chelates, Tb3+β-diketonates are
great stability, hydrophilicity, and biocompatibility.8
However, the fluorescence of a simple terbium β-diketonate chelate in aqueous solution is always too weak for one to achieve high analytical sensitivity. Solubilization of these chelates in water can be achieved by their encapsulation into macrocyclic compounds, which isolates the coordination site from the solvent molecules, thus avoiding non-radiative losses to the medium.9,10
In this work we describe how the inclusion of terbium(III) β-diketonate chelates into the hydrophobic cavity of α-cyclodextrin enhances the solubility of the complexes in aqueous medium and leads to changes in their photophysical properties. Cyclodextrins (CD) are an important class of cyclic oligosaccharides consisting of six (α-CD), seven (β-CD), or eight (G-CD) D-(+)-glucopyranose units linked through α-1,4 glycosidic bonds.11,12 These compounds form a hydrophobic cavity
that is able to incorporate molecules of appropriate size in aqueous solution, forming the so-called inclusion compounds.13 These inclusion compounds result from the
energetically unfavorable interaction between the water molecules included in the hydrophobic CD cavity on the one hand and between water and the guest on the other, in comparison with the hydrophobic and/or van der Waals interactions between the guest and the host cavity.14
Because of the specific interactions involved, therein, this type of supramolecular system is conveniently monitored by NMR spectroscopy.15
Inclusion can modify some properties, such as the photophysical and photochemical behavior of the guest molecule, and can be a way of increasing the use of Tb3+:β-diketonate in biological assays. At the same
time, inclusion of Tb3+ chelates into an α-CD pocket
can increase the solubility of the complex in aqueous solution, as well as isolate the rare earth ion from water, thus avoiding non-radiative loss. Reports have appeared in the literature on the inclusion compounds formed between lanthanides and cyclodextrins, but all of then deal with the the solid state properties.16-18 In this work
the studied materials were characterized both in aqueous solution and in the solid state by luminescence spectroscopy, as well as ultraviolet-visible absorption (UV-Vis), infrared (FTIR), NMR, elemental, and thermal analyses (TGA/DTA).
Experimental
Materials
α-Cyclodextrin and Tb4O7 were purchased from Aldrich.
Physical measurements
Absorption spectra (UV-Vis) were recorded on a UV-Vis Spectrophotometer (Hewlett Packard 8453 Diode Array). FTIR spectra were obtained in KBr pellets for solid materials (Perkin Elmer FT-IR 1600). Luminescence data were recorded on a Spectrofluorometer (SPEX Fluorolog III TRIAX 550 and 1934D phosphorescence device) at room temperature and at 77K. NMR experiments were recorded on a DRX 500 MHz Bruker spectrometer. NMR chemical shifts are reported in parts per million (ppm) relative to the residual protiated solvents (G = 4.80 ppm for D2O and G = 0.0 ppm for TMS signal in DMSO-d6). TGA/DTA measurements were carried out (TA Instruments SDT 2960-Simultaneous DTA-TGA-Thermal Analyst 2100) in air flux with a heating rate of 10oC min-1,
from 25 to 1000oC. Molecular mechanics calculations
were carried out using the MM3 program.19 Measurements
of the emission quantum yields for the solid complexes and the inclusion complexes in aqueous solutions were done according to reported procedures, using MgO and quinine sulfate as standards for solids and for aqueous solutions, respectively. 20,21 The expected errors of these
measurements are within 30%.
Terbium complexes
The [Tb(ppa)3(H2O)2] compound was synthesized by addition of a TbCl3aqueous solution to an aqueous/ methanolic solution of 3-phenyl-2,4-pentanedione, pH ~ 7.0, under stirring overnight.22 For the synthesis of the ternary
complex [Tb(ppa)3(phen)], 1,10-phenanthroline was added to a solution by means of the same procedure. The solid complexes were filtered, dried at room temperature under reduced pressure, and charactherized by elemental analysis and infrared absorption spectroscopy. Terbium percentages in the complexes were determined by thermogravimetric analysis. Analysis: Calculated for [Tb(ppa)3(H2O)2]: C, 55.01; H, 5.18; Tb, 22.06%; Found: C, 55.25; H, 5.30; Tb, 21.9%; Calculated for [Tb(ppa)3(phen)]: C, 62.50; H, 4.78; N, 3.24; Tb, 18.38; Found: C, 62.57; H, 5.01; N, 3.23; Tb, 18.75. These results confirm the 1:3 (Tb:ppa) molar ratio for both complexes, as well as the presence of two water and one 1,10-phenanthroline molecule in order to complete the coordination sphere. The IR spectra show there is a shift of the carbonyl stretching frequency (C=O) from 1600 cm-1
(ppa-free ligand) to 1570 cm-1 in both complexes, thus
providing good evidence that the metal ion is coordinated through the oxygen atoms. The vibrational mode at 864 cm-1,
assigned to C–H out-of-plane deformation,23 is detected in
the phen-free IR spectrum. This band is shifted to 848 cm-1
nitrogen atoms coordinate to Tb3+, thus indicating the
presence of phen in the complex.
Inclusion compounds
Inclusion compounds were produced by stirring 15.0 mg of the chelate and approximately 30.0 mL of an α-cyclodextrin aqueous solution (molar ratio chelate: α-CD = 1:3), at ~30 oC. After one week, the mixtures
became homogeneous. This procedure was repeated in D2O for the NMR study, which confirmed the inclusion. The aqueous solutions were studied by luminescence and absorption UV-Vis spectroscopies at room temperature. To obtain the inclusion compounds in the solid state, part of the solution was dried at ~40 oC (Scheme 1).
Stoichiometry of the α-CD inclusion compound was obtained by the continuous variation method (Job’s method). In this method, the total concentration of the species ([S]0 + [L]0 = M) is kept constant, and the ratio (r = [S]0/{[S]0 + [L]0}) between the terbium chelate (S) and the α-CD (L) species varies from 0 to 1. The maximum complex concentration is reached for r = (n + 1)-1, and it
does not depend on the concentration M or the binding constant (Ka).24 In absorbance studies, the continuous
variation method makes use of the difference between the maximum absorbance intensity of the guest in a pure solution and in each mixture with the host. Different volumes of the aqueous chelate solution and of α-CD (both at 4.7.10-5 mol L-1) were stirred for 2h. Then, the maximum
absorbance intensity in each solution was obtained, and the difference with regard to the pure chelate solution was plotted against the existing molar ratio. In both cases, the inclusion stoichiometry was 1:1 (Figure 1).
Results and Discussion
Scheme 1 shows the synthetic route used for the preparation of [Tb(ppa)3(L)]:α-CD inclusion compounds. The solid complexes [Tb(ppa)3(H2O)2] and [Tb(ppa)3(phen)] were stirred in α-cyclodextrin aqueous solution until the resulting solution became homogeneous (one week).
Solutions of the inclusion compounds exhibited the typical Tb3+luminescence in both cases, however, the
excitation bands were shifted in relation to these of the respective solid complexes (Figures 2 and 3).
The excitation maximum wavelength at 340 nm for the solid [Tb(ppa)3(H2O)2] was shifted to 324 nm after inclusion of the chelate into α-CD and its solubilization in aqueous medium. For [Tb(ppa)3(phen)], the excitation maximum wavelength at 362 nm was shifted to 302 nm in the inclusion compound in aqueous medium. A possible explanation for this can be the molecule sizes. Computational calculations indicated that the diameter of the Tb3+ complexes is too large for
the chelates to be completely included in the α-CD pocket, so only the aromatic ligands of the complexes were incorporated into the hydrophobic cavity of α-CD. Considering that excitation occurs through the ppa and phen molecules, the shift in the excitation maximum exhibited by the inclusion compounds in aqueous medium should be due to the fact that the ligands undergo a distortion in their arrangement, in
Scheme 1. Synthetic route for the preparation of the [Tb(ppa)3(H2O)2]:α-CD and [Tb(ppa)3(phen)]:α-CD inclusion compounds.
Figure 1. Job plot for determination of the stoichiometry of the [Tb(ppa)3(phen)]:α-CD inclusion compound. The solutions were made over a range of host/guest ratios and under a concentration such that [[Tb(ppa)3(phen)]]0 + [α-CD]0 = 47 mmol L-1, and [[Tb(ppa)
3(phen)]]
varies from 5.0 mmol L-1 to 45 mmol L-1 in 5.0 mmol L-1 steps. The
order to adjust to the α-CD diameter. The presence of the aromatic ring of the ppa ligand in the hydrophobic cavity of cyclodextrin was confirmed by 1H NMR (D
2O)
spectroscopy: the α-CD H-3 internal proton signal was shifted from G3.84 to G3.90 after inclusion because of the interaction between this α-CD proton and the aromatic protons (Figure 4).
Emission spectra of the aqueous solutions of the inclusion compounds displayed the typical Tb3+ 5D
4→ 7F
6-3
bands in the visible region. However, these bands in the region of 480, 550, 580 and 620 nm were broader than those of the correspondig solids. The fluorescence quantum yield of [Tb(ppa)3(H2O)2] in aqueous medium achieved 12%, while for the non-CD complex it was 39%. For [Tb(ppa)3(phen)], the 12.0% fluorescence yield of the non-CD complex decreased to 2.3% in aqueous solution. This reduction is due to the Tb3+ non-radiative deactivation
mechanism by O–H oscillators of the water molecules, which indicates that the inclusion in α-CD does not completely isolate the lanthanide coordination sphere from
water. For the same reason, the inclusion compounds in aqueous solutions presented lower lifetime values than the respective non-CD complex (around 0.65 ms in the non-CD complex and 0.43 ms in aqueous medium, for both chelates). These results are in agreement with a partial inclusion of the complexes into the hydrophobic cavity through their ligand.
Figure 2. Excitation and emission spectra of: (a) [Tb(ppa)3(H2O)2] solid; (b) [Tb(ppa)3(H2O)2]:α-CD in aqueous solution; and (c) [Tb(ppa)3(H2O)2]:
α-CD in the solid state.
Figure 3. Excitation and emission spectra of: (a) [Tb(ppa)3(phen)] solid; (b) and [Tb(ppa)3(phen)]:α-CD in aqueous solution; and (c) [Tb(ppa)3(phen)]:
α-CD in the solid state.
Figure 4.1H NMR spectra of: (a) α-CD and (b) [Tb(ppa)
3(H2O)2]:α-CD
The chelate ligands were excited, which in turn transferred energy to Tb3+. The Tb3+decay from this
excited state enabled determination of the lifetime (Table 1). Monoexponential decay curves were observed for both the solid complex and the complex in aqueous solution. Lifetime values were lower in aqueous solution than in the solid state, as expected. Also, higher values were achieved in D2O when compared with H2O, thus confirming the non-radiative deactivation of the 5D
4 excited states of the metal ion
through the O–H vibration.
To study the inclusion compounds in the solid state, the homogeneous solution was dried at ~40 oC. The
infrared absorption spectra of the solid compounds displayed the typical bands of α-CD and the charac-teristic absorption bands of the guest, showing that the structural integrity of the rare earth chelate complexes was mantained after inclusion. Also, the decrease in the relative intensity of the C = C aromatic23 and alkyl
bands of the ligand, calculated for the spectra of both inclusion compounds and the non-CD complexes indicates the presence of an aromatic ring in the α-CD cavity.
Thermogravimetric analysis of the inclusion compound gave evidence of a mass loss between 250 and 310 °C, and a residual mass of 5.3% (Tb4O7) up to 500 °C. In the non-CD terbium tris(β-diketonate) chelate, the organic decomposition occurred between 200-300 °C.
The excitation and emission spectra of the inclusion compounds in the solid state are shown in Figures 3 and 4. They display broad bands in the region where Tb3+ bands are typically observed. The fluorescence
quantum yields determined for the solid inclusion compounds are higher than those obtained in aqueous medium, but still lower than those found for the non-CD complexes. This is because water is aggregated with the α-CD molecule in the inclusion compound. The measured lifetime values also increase when the number of water molecules in the coordination sphere is lower (Table 1).
Conclusions
The luminescence of the mixed Tb3+ β-diketonate
chelates was mantained in aqueous solution upon formation of α-CD inclusion compounds. Therefore, cyclodextrin can be considered a useful tool for the study of the spectroscopic properties of Tb3+ complexes in
aqueous medium.
Acknowledgments
We thank financial supports from FAPESP, CAPES and CNPq.
References
1. Lis, S.; Elbanowski, M.; Makowska, B.; Hnatejko, Z.; J. Photochem. Photobiol.2002,150, 233.
2. Tsukube, H.; Shinoda, S.; Chem. Rev.2002,102, 2389. 3. Liu, C. M.; Jin, Q. L.; Sutton, A.; Chem, L. H.; Bioconjugate
Chem.2005,16, 1054.
4. Hemmilã, L.; J. Alloys Comp.1995,225, 480.
5. Lin, C. G.; Yang, J. H.; Wu, X.; Zhang, G. L.; Liu, R. T.; Cão, X. H.; Han, R. J.; Anal. Chim. Acta2000,403, 219.
6. Elbanowski, M.; Makowska, B.; J. Photochem. Photobiol. A
1996,99, 85.
7. Horrocks, W. D.; Sudinick, D. R.; Science1979,206, 1194. 8. Wu, F. B.; Zhang, C.; Anal. Biochem.2002,311, 57. 9. Richardson, F. S.; Chem. Rev.1982,82, 541.
10. Serra, O. A.; Rosa, I. L. V.; Nassar, E. J.; Calefi, P. S.; Cardoso, P. C.; J. Alloys Compd.1997,249, 178.
11. Del Valle, E. M. M.; Process Biochem.2004,39, 1033. 12. Engeldinger, E.; Armspach, D.; Matt, D.; Chem. Rev.2003,103,
4148.
13. Loftsson, T.; Masson, M.; Int. J. Pharma.2001,225, 15. 14. Szejtli, J.; Chem. Rev.1998,98, 1743.
15. Schneider, H. J.; Hacket, F.; Rudiger, V.; Chem. Rev.1998,98, 1755.
16. Brito, H. F.; Carvalho, A. A. C.; Malta, O. L.; Passos, J. J.; Menezes, J. F. S.; Sinisterra, R. D.; Spectrochem. Acta Part A
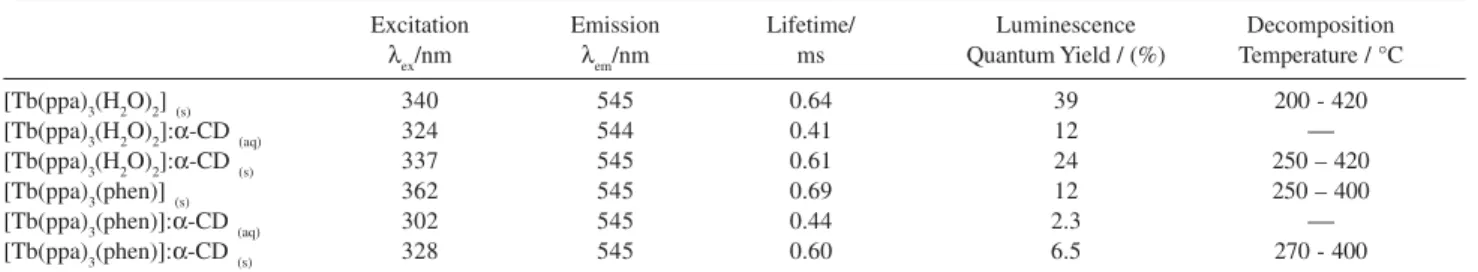
1999,55, 2403. Table 1. Data for the Tb(ppa)/α-CD and non-CD complexes in different media
Excitation Emission Lifetime/ Luminescence Decomposition
λex/nm λem/nm ms Quantum Yield / (%) Temperature / °C
[Tb(ppa)3(H2O)2](s) 340 545 0.64 39 200 - 420
[Tb(ppa)3(H2O)2]:α-CD(aq) 324 544 0.41 12
[Tb(ppa)3(H2O)2]:α-CD(s) 337 545 0.61 24 250 – 420
[Tb(ppa)3(phen)](s) 362 545 0.69 12 250 – 400
[Tb(ppa)3(phen)]:α-CD(aq) 302 545 0.44 2.3
17. Braga, S. S.; Ferreira, R. A. S.; Gonçalves, I. S.; Pillinger, M.; Rocha, J.; Dias, J. J. C. T.; Carlos, L. D.; J. Phys. Chem. B
2002,105, 1430; Braga, S. S.; Ferreira, R. A. S.; Ribeiro-Claro, P.; Gonçalves, I. S.; Pillinger, M.; Rocha, J.; Dias, J. J. C. T.; Carlos, L. D.; J. Inclusion Phenom. Macrocyclic Chem. 2002,
44, 261.
18. Jiang, C.; Hou, F.; Anal. Lett.2004,37, 1885.
19. Hay, B. P.; Clement, O.; Sandrone, G.; Dixon, D. A.; Inorg. Chem.1998,37, 5887.
20. Brunet, E.; Juanes, O.; Sedano, R.; Rodr1guez-Ubis, J. C.;
Tetrahedron 2005,61, 6757.
21. Demas, J. N.; Crosby, G. A.; J. Phys. Chem.1971,71, 991. 22. Ribeiro, A. O.; Calefi, P. S.; Pires, A. M.; Serra, O. A.; J. Alloys
Compd.2004,374, 151;
23. Nakamoto, K.; Infrared and Raman Spectra of Inorganic and
Coordination Compounds, 4th ed., Wiley: New York, 1986, p.
254.
24. Fielding, L.; Tetrahedron2000,56, 6151.
Received: April 6, 2006
Web Release Date: February 15, 2007
![Figure 1. Job plot for determination of the stoichiometry of the [Tb(ppa) 3 (phen)]:α-CD inclusion compound](https://thumb-eu.123doks.com/thumbv2/123dok_br/18992057.460994/3.892.476.825.129.411/figure-job-plot-determination-stoichiometry-phen-inclusion-compound.webp)
![Figure 2. Excitation and emission spectra of: (a) [Tb(ppa) 3 (H 2 O) 2 ] solid;](https://thumb-eu.123doks.com/thumbv2/123dok_br/18992057.460994/4.892.454.799.127.669/figure-excitation-emission-spectra-tb-ppa-h-solid.webp)