Printed in Brazil - ©2007 Sociedade Brasileira de Química 0103 - 5053 $6.00+0.00
Article
*e-mail: [email protected]
Continuous Wavelet Transform and Chemometric Methods for Quantitative Resolution of a
Binary Mixture of Quinapril and Hydrochlorothiazide in Tablets
Erdal Dinç*,a and DumitruBaleanub,c
a
Department of Analytical Chemistry, Faculty of Pharmacy, Ankara University, 06100, Tandoan, Ankara, Turkey
b
Çankaya University, Faculty of Arts and Sciences,Department of Mathematics and Computer Sciences 06530 Balgat, Ankara, Turkey
c
National Institute for Laser, Plasma and Radiation Physics, Institute of Space Sciences, Magurele-Bucharest, Romania
A resolução quantitativa da mistura de quinapril e hidroclorotiazida em comprimidos foi realizada com o uso da transformada de ondas contínuas e métodos quimiométricos. No caso da transformada de ondas contínuas, uma série de famílias de ondas foram testadas para achar o ponto ótimo da técnica de processamento de sinais das ondas. A função de onda tipo chapéu mexicano apresentou o melhor resultado. Essa função onda tipo chapéu mexicano foi aplicada aos espectros de absorção do quinapril e da hidroxiclorotiazida na faixa de 200-320 nm para um conjunto padrão de medicamentos na concentração de quinapril de 4,0-20,0 µg mL-1 e hidroclorotiazida de 2,5-12,5 µg mL-1. As funções de calibração do
quinapril em 230,6 nm e da hidroclorotiazida em 271,1 nm foram calculadas em função da relação entre as medidas dos sinais de ondas contínuas e das concentrações. De acordo com o enfoque quimiométrico, foram utilizadas calibrações por regressão dos mínimos quadrados e dos componentes principais, baseadas em um conjunto de teste de 21 misturas, contendo os dois medicamentos e os dados de absorbância correspondentes, na faixa de comprimento de onda igual a 205-290 nm. Todos os métodos propostos foram validados pela análise separada das misturas sintéticas e pela técnica de adição padrão. A utilização do método desenvolvido indicou que a seletividade e a sensibilidade foram satisfatórias na análise dos comprimidos.
Quantitative resolution of the quinapril and hydrochlorothiazide mixture in tablets was achieved by using continuous wavelet transform and chemometric methods. In the case of the continuous wavelet transform, various continuous wavelet families were tested in order to find the optimum point of the wavelet signal processing technique. The Mexican hat wavelet function was reported to be the optimal one. The Mexican hat wavelet function was applied to the absorption spectra of quinapril and hydrochlorothiazide in the spectral range of 200-320 nm for standard series of drugs in the concentration range of 4.0-20.0 µg mL-1 quinapril and 2.5-12.5 µg mL-1 hydrochlorothiazide. The calibration functions for
quinapril at 230.6 nm and for hydrochlorothiazide at 271.1 nm were calculated based on the relationship between the measurements of continuous wavelet signals and their concentrations. According to the chemometric approach, partial least squares and principal component regression calibrations were constructed by a training set of 21 mixtures, containing two drugs and their corresponding absorbance data, in the wavelength range of 205-290 nm. All proposed methods were validated by the independent analysis of the synthetic mixtures and by the standard addition technique. The application of the methods indicated that their selectivity and the sensitivity were satisfactory. The investigated methods were successfully applied to tablet analysis.
Introduction
Hydrochlorothiazide (HCT) has diuretic properties and its chemical name is (6-chloro-3,4-dihydro-2H-1,2,4-benzothiadizine-7-sulphonamide-1,1-dioxide). Quinapril (QU) given by 2-{2-[[1-ethoxycarbonyl)-3-phenylpropyl] amino]-1-oxopropyl}-1,2,3,4-tetrahydro-3-isoquinoline carboxylic acid is a nonsulfydryl angiotensin-converting enzyme (ACE) inhibitor. It constitutes a family of active compounds used to treat high blood pressure and heart failure. The major metabolite of this drug is quinaprilat which provides a more gradual onset of its antihypertensive effect. The combination of HCT and QU has been used in pharmaceutical formulation (e.g. Accuzide® tablets) to increase the therapeutic effects.
Two studies on the simultaneous analysis of QU and HCT mixture were reported in the literature. One of them, deals with derivative spectrophotometry1 and the other one, is a TLC method, using normal and reversed-phase techniques based on the densitometric detection.2 As it is known, the classical derivative spectrophotometric method does not provide good signal/noise ratio for higher order derivatives. Therefore, the accuracy and precision of the analysis results are influenced by the above mentioned behavior. TLC method reported in the literature needs a long and tedious analytical process. For these reasons, the analysis of QU-HCT tablets needs new, simple, accurate, selective and sensitive analytical approaches.
As it is known, for the chemometric methods, partial least squares (PLS) and principal component regression (PCR) have been successfully applied to the combined pharmaceutical formulation3,4 and their analytical applications were reported.5-7 Chemometric methods have an abstract mathematical content, are not so easy to be applied and need the preparation of a complex concentration set. For example, the concentration set design is very important in some cases and the selection of factors is another important difficulty for the chemometric calibrations. Therefore, there are disadvantages in the chemometric approaches. Continuous wavelet transform (CWT) uses a simple calibration as in classical derivative spectrophotometry and, then, gives all the results at the short period of time by using a simple software, the Matlab.
In the Chemistry field, wavelets transform or classical Fourier transform8-10 were used for de-noising, compressing or image analysis. As it is well known, chemical instruments produce noises and fluctuations mainly coming from instrumentation recording of a spectrum. Due to these reasons, the original signal of
the analyte at lower concentration in samples may interfere with noise peaks. Therefore, the elimination of the noise effect or increased signal to noise ratio is an important issue to be solved. One of the most powerful methods is the wavelet method. Wavelets are mathematical functions that cut up data into different frequency components and, then, study each component with a resolution matched to its scale. They have advantages over the traditional Fourier methods in analyzing physical situations where the signal contains discontinuities and sharp spikes. Wavelet transform contains two distinct parts, discrete and continuous and it was developed independently in several fields.8-16 Recently, CWT was successfully applied to the spectrophotometric multicomponent analysis of relevant compounds in samples.10,12-15
The aim of this study is to develop a new, rapid and sensitive, accurate analytical method for the simultaneous quantitative resolution of QU-HCT tablets. Therefore, CWT method based on the use of zero-crossing technique was developed for the resolution of the above mentioned tablets. For comparing the two chemometric approaches, PLS and PCR were also applied to the same samples and a good agreement was reported between these methods, as well as, in literature applications.
Experimental
Apparatus and software
A Shimadzu UV-160 double beam UV-Visible spectrophotometer having a fixed slit width (2 nm) connected to a computer loaded with Shimadzu UVPC software and a Lexmark E-320 printer were used for the registration of absorption spectra of samples against a blank. The absorption data was transformed into ASCII
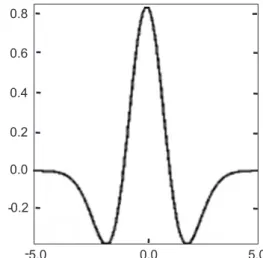
Figure 1. The Mexican hat wavelet function.
0.0 5.0
-5.0 0.0 0.2
files and transferred to Microsoft Excel and PLS and PCR calibrations were calculated with PLS Tollbox 3.0 in Matlab 7.0. After that, the transferred data vectors were processed by CWT signal processing technique using the wavelet toolbox in Matlab 7.0 software. Data treatment, regression and statistical analysis were performed with Excel.
Commercial tablet formulation
A commercial pharmaceutical product (Accuzide® tablet, Phizer Pharm. Ind., Istanbul, Turkey) was studied. Its declared content was as follows: 20 mg QU and 12.5 mg HCT per tablet. QU and HCT were obtained as a donation from Phizer Pharm. Ind., Istanbul, Turkey.
Reagents and solutions
Stock solutions of 25 mg per 100 mL for QU and HCT were prepared in 0.05 mol L-1 NaOH. Standard series of QU and HCT in the linear concentration range of 4.0-20.0 µg mL-1 and 2.5-12.5 µg mL-1 were obtained from the above stock solutions, respectively. A concentration set containing QU and HCT drugs in the concentration range of 0.0-20 µg mL-1 and 0.0-12.5 µg mL-1, respectively. An independent validation set of various binary mixtures of QU and HCT in the working concentration range was prepared by using the stock solutions. The proposed methods were subjected to the absorption spectra of the prepared solutions.
Tablet analysis
Ten tablets containing QU and HCT were totally weighed and powdered. The content equivalence to one tablet was dissolved in a 100 mL calibrated flask by using 0.05 mol L-1 NaOH. The content of the flask was mechanically shaken for 20 min and filtrated into a 100 mL volumetric flask through a 0.45 µm membrane filter. Appropriate dilutions were done into the range of calibration curve with 0.05 mol L-1 NaOH. The absorption spectra of the resulting solutions were recorded against 0.05 mol L-1 NaOH.
Results and Discussion
Method development
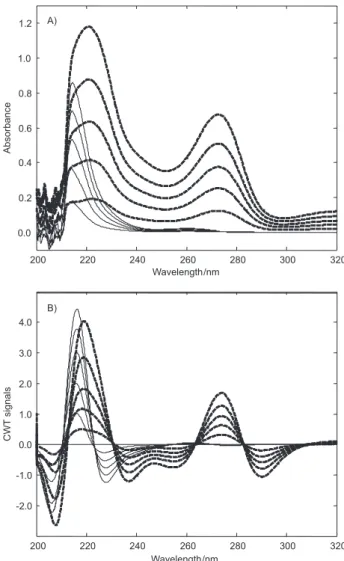
As we know, the simultaneous analysis of combined mixtures is a very important task for analytical purpose. The absorption spectra of QU and HCT overlap in the
spectral region of 200-320 nm as shown in Figure 2A. So, this indicates that small peaks of QU exist against the higher peaks of HCT in the same spectral region. This is an analytical problem for the analysis of QU and HCT. For these reasons, the simultaneous spectral analysis of binary mixtures of the two drugs is not possible by direct measurement of absorbance values, as well as, classical analytical approaches. To bypass these problems, we developed a new analytical approach, based on the Mexican hat wavelet function for the quantitative resolution of the related drugs. For a comparison of the results of Mexican hat wavelet method, PLS and PCR techniques were applied to simultaneous determination of QU and HCT in tablets. The application of the proposed methods is detailed below.
CWT is used to decompose a given signal into wavelets which are small oscillations that are highly localized in time. CWT’s basis functions are scaled and shifted versions of the time-localized mother wavelet. CWT is
Figure 2. Absorption signals (A) and their CWT signals (B) of 4.0-20 µg
mL-1 QU (—) and 2.5-12.5 µg mL-1 HCT (——) in 0.05 mol L-1 NaOH.
200 220 240 260 280 300 320
0.0 0.2 0.4 0.6 0.8 1.0 1.2
Wavelength
Absorbance
/nm
200 220 240 260 280 300 320
-2.0 -1.0 0.0 1.0 2.0 3.0 4.0
Wavelength
CWT
signals
/nm A)
used to construct a time-frequency representation of a signal that offers very good time and frequency localization. It also represents an ideal tool for determining whether or not a signal is stationary in a global sense.
CWT method was extensively used in analytical chemistry, especially, during the last years mainly because it helps in various applications to improve the signal-to-noise ratios, as well as, it was used for data compression. In this paper we used Mexican hat wavelet function which is defined by the following formula:
e-x2/2
) x 1 ( 3 2 ) x ( 2 4 / 1 − ⎟⎟ ⎟ ⎠ ⎞ ⎜⎜ ⎜ ⎝ ⎛ π = ψ − (1)
From (1) we observe that this function is proportional to the second derivative function of the Gaussian probability density function. The scale parameter can be changed to stretch the wavelet in the x-y plane. The graph of this wavelet function is displayed in Figure 1.
Method application
Continuous wavelets transform
Absorption spectra of QU and HCT in the linear concentration range of 4.0-20 µg mL-1 and 2.5-12.5 µg mL-1, respectively were recorded in the spectral range of 200-320 nm and are illustrated in Figure 2A. The Mexican hat function was applied to the absorption spectra and to the graphs of CWT and is presented in Figure 2B. Calibration functions of QU and HCT were obtained by measuring CWT signals at 230.6 and 271.1 nm, respectively. Linear regression analysis and its statistical results were given in Table 1. Validation of the method was carried out by analyzing the synthetic mixtures of both drugs and a good agreement was reported. Recovery results and their statistical results were shown in Table 3. To check the effect of the sample
matrix on the quantitative analysis, standard addition technique was applied. No interference of excipients was observed during analysis. The recovery results obtained by applying the standard addition technique to the samples obtained by mixing pure components and their commercial forms were indicated in Table 4. CWT method was applied to the commercial sample containing QU and HCT and the obtained results were presented in Table 5. A good coincidence was observed for the assay results with the declared amount of the components on the label.
PCR and PLS methods
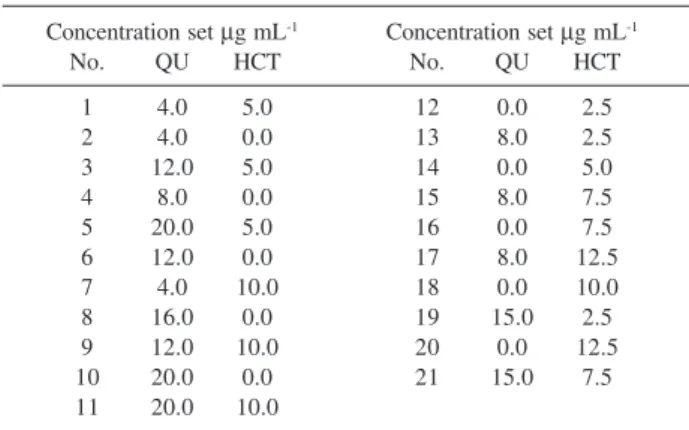
A concentration set design of the concentration data corresponding to 21 standard mixtures of solutions consisting of 0-20 µg mL-1 QU and 0-12.5 HCT µg mL-1 was randomly organized for the PCR and PLS calibrations. Concentration set consists of the binary mixtures and pure compound as shown in Table 2. In order to developed two chemometric approaches the full spectra with the interval of Δλ = 0.1 nm in the spectral region of 205-290 nm were used to construct PCR and PLS calibrations.
Table 2. Training set consisting of QU and HCT in various concentration
levels
Concentration set µg mL-1 Concentration set µg mL-1
No. QU HCT No. QU HCT
1 4.0 5.0 12 0.0 2.5
2 4.0 0.0 13 8.0 2.5
3 12.0 5.0 14 0.0 5.0
4 8.0 0.0 15 8.0 7.5
5 20.0 5.0 16 0.0 7.5
6 12.0 0.0 17 8.0 12.5
7 4.0 10.0 18 0.0 10.0
8 16.0 0.0 19 15.0 2.5
9 12.0 10.0 20 0.0 12.5
10 20.0 0.0 21 15.0 7.5
11 20.0 10.0
Table 1. Linear regression analysis and its results
QU HCT
λ/(nm) 230.6 271.1
Range 4.0-20.0 µg mL-1 2.5-12.5 µg mL-1
Calibration equation S=5.23×10⁻²C+9.18×10⁻³ S=11.96×10⁻²C-4.29×10⁻²
r 0.9998 0.9990
r(SE) 6.93×10⁻³ 3.65×10⁻²
m(SE) 5.48×10⁻⁴ 4.62×10⁻³
n(SE) 7.27×10⁻³ 3.83×10⁻²
LOD 0.34 0.60
LOQ 1.15 1.99
Table 5. Experimental tablet results by the proposed analytical methods
mg per tablet
CWT PCR PLS
No. QU HCT QU HCT QU HCT
1 20.33 12.54 20.88 12.47 20.26 12.52
2 20.92 12.7 20.29 12.36 20.64 12.25
3 19.6 12.8 20.03 12.58 20.14 12.42
4 20.41 12.06 20.40 12.47 19.66 12.38
5 20.28 12.07 20.12 12.43 20.41 12.24
6 20.53 12.05 19.80 12.35 20.78 12.50
7 19.10 12.77 19.31 12.41 19.46 12.34
8 19.72 12.3 20.75 12.35 19.96 12.59
9 19.74 12.31 19.33 12.38 19.58 12.71
10 19.65 12.62 19.90 12.51 20.72 12.33
Mean: 20.03 12.42 20.08 12.43 20.16 12.43
SD 0.55 0.30 0.53 0.08 0.49 0.15
RSD 2.74 2.42 2.62 0.61 2.41 1.21
SE 0.22 0.12 0.17 0.02 0.15 0.05
CL(0.05) 0.44 0.24 0.11 0.02 0.10 0.03
SD - Standard deviation, SE - standard error, CL - confidence limit; Label claim = 20 mg QU and 12.5 mg HCT per tablet.
Table 4. Calculated recoveries from the standard addition technique by the proposed analytical methods
Recovery (%)
Added/(µg mL-1) CWT PCR PLS
No. QU HCT QU HCT QU HCT QU HCT
1 6 3.75 103.8 103.1 102.8 102.2 103.0 102.0
2 6 3.75 104.0 103.1 103.6 102.5 102.9 102.3
3 6 3.75 104.5 102.1 104.0 103.0 103.4 102.8
4 12 7.5 104.0 97.7 102.6 98.5 102.6 99.3
5 12 7.5 98.4 95.3 99.0 97.4 98.9 98.4
6 12 7.5 98.0 98.2 98.9 99.7 99.0 100.1
Mean 102.1 99.9 101.8 100.6 101.6 100.8
SD 3.0 3.29 2.28 2.34 2.09 1.80
RSD 3.0 3.30 2.24 2.33 2.06 1.78
SD - Standard deviation by the proposed analytical method.
Table 3. Recovery results obtained from the synthetic mixtures by the proposed analytical methods
No Actual Conc./(µg mL-1) Calculated Conc./(µg mL-1) Recovery (%)
CWT PCR PLS CWT PCR PLS
QU HCT QU HCT QU HCT QU HCT QU HCT QU HCT QU HCT
1 4.00 5.00 3.89 5.01 3.98 4.86 3.98 4.96 97.3 100.2 99.4 97.2 99.5 99.2
2 12.00 5.00 11.62 4.96 11.78 4.80 12.01 4.72 96.8 99.2 98.1 96.0 100.1 94.5 3 20.00 5.00 19.45 4.93 18.91 4.85 19.25 4.88 97.2 98.6 94.6 97.0 96.3 97.7 4 4.00 10.00 3.83 9.61 4.08 9.75 4.08 9.68 95.8 96.1 101.9 97.5 102.0 96.8 5 12.00 10.00 11.75 9.72 12.13 10.07 11.91 9.94 97.9 97.2 101.1 100.7 99.2 99.4 6 20.00 10.00 19.37 9.69 19.67 9.63 19.70 9.74 96.9 96.9 98.3 96.3 98.5 97.4
7 8.00 2.50 7.88 2.61 7.69 2.45 7.62 2.47 98.5 104.4 96.1 98.1 95.3 98.6
8 8.00 7.50 7.62 7.27 8.04 7.39 7.88 7.37 95.2 97 100.5 98.5 98.5 98.3
9 8.00 12.50 8.06 12.54 8.12 13.10 8.05 12.86 100.7 100.3 101.5 104.8 100.6 102.9 10 15.00 2.50 15.24 2.44 15.65 2.59 15.49 2.52 101.6 97.4 104.4 103.6 103.3 100.7 11 15.00 7.50 15.22 7.36 15.07 7.59 15.07 7.55 101.5 98.1 100.4 101.2 100.5 100.7 12 15.00 12.50 15.2 11.82 14.85 12.17 14.32 12.22 101.3 94.5 99.0 97.4 95.5 97.8
Mean 98.4 98.3 99.6 99.0 99.1 98.7
RSD 2.34 2.57 2.65 2.92 2.50 2.20
The optimal factor selection was done by cross validation procedure using 21 absorption spectra of samples. This procedure was carried out by PLS Toolbox 3.0 in Matlab 7.0 software. According to the cross validation process, the different factor numbers were tested. As a result the first three factors for PCR and two factors for PLS calibrations were found appropriate. In the cross validation procedure, the root mean square error of calibration (RMSEC) and root mean square error of cross validation (RMSECV) were found as 0.79 and 1.28 for QU and 0.22 and 0.25 for HCT in PCR, and 0.54 and 0.76 for QU and 0.21 and 0.29 for HCT in PLS, respectively.
PCR and PLS calibration are used for the estimation of two drugs in the samples. The mixtures of QU and HCT in the working concentration range were used for the validation of PCR and PLS techniques. Mean recoveries and their relative standard deviations were calculated and presented in Table 3. To observe the effect of tablet excipients on the analysis, the standard addition technique was applied to the samples obtained by mixing pure components and their commercial forms. The recovery results are presented in Table 4 and according to them, no effect of the excipients on the analysis was observed.
Sample analysis
Continuous Mexican hat function, PLS and PCR approaches were applied to the quantitative analysis of QU and HCT in tablets. The experimental results of pharmaceutical tablet formulation were presented in Table 5. The results of all methods were very close to each other, as well as, to the label value of commercial pharmaceutical tablets. A good agreement was observed for all proposed methods.
Results evaluation by statistical tests
ANOVA tests were applied to tablet assay results of QU and HCT by the proposed methods for the significance
Table 6. ANOVA-test for the results obtained by applying the proposed analytical methods to tablets
Source of Variation SS df MS F P-value F-crit
QU Between Groups 0.0900 2 0.0449 0.1656 0.8483 3.3541
Within Groups 7.3260 27 0.2713
Total 7.4160 29
HCT Between Groups 0.0004 2 0.0002 0.0056 0.9944 3.3541
Within Groups 1.0687 27 0.0396
Total 1.0692 29
SS - Sum of squares, df - Degree of freedom, MS - Mean squares, F- presents or F-calculated, P-value was calculated against 95% confidence limit, F-crit (or theoretical F- value) corresponds F-table value.
of difference between methods. By using the 95% confidence limit, the theoretical and calculated F-values for QU and HCT were illustrated in Table 6. The calculated statistical test values did not exceed the theoretical statistical values, indicating that there was no significant difference among the methods. In this test p-values were found greater than 0.05 (p = 0.05). The numerical values of all statistical tests indicated that the investigated approaches are suitable for the determination of both drugs in the pharmaceutical tablets.
Conclusions
CWT method is a powerful signal processing technique for the overlapping peak resolution and for the significant peak identification. This tool is successfully applied to the spectrophotometric multicomponent analysis of relevant compounds in samples.
Although the individual spectra of QU and HCT overlap in the region of 200-320 nm, the CWT method gave successful results for the quantitative resolution of the binary mixtures and a commercial sample consisting of two components. Good results were reported by utilizing CWT-Mexican hat function, PLS and PCR as a comparative study for the quantitation of QU and HCT and a good agreement with the literature results1,2 was observed. Finally, this CWT method can be strongly applied to routine analyses, quality control of binary mixtures and commercial products containing these two drugs.
References
1. Kowalczuk D.; Hopkala, H.; J. AOAC Int.2004, 87, 847. 2. Kowalczuk, D.; Hopkala, H.; Pietras, R.; JPC mod.TLC2003,
16,196.
3. Beebe, K. R.; Anal. Chem.1987, 59 , A1007.
4. Kramer, R.; Chemometric Techniques for Quantitative Analysis, Marcel Dekker Inc: New York 1998.
5. Dinç E.; Dermis, S.; Baleanu, D.; Rev. Chim. (Bucharest, Rom.)
6. Dinç E.; Baleanu, D.; J. Pharm. Biomed. Anal.2002, 30, 715. 7. Dinç E.; Baleanu, D.; Il Farmaco2002, 57, 33.
8. Walczak, B.; Wavelets in Chemistry, Elsevier Press: Amsterdam, The Netherlands, 2000.
9. Daubechies, I.; Ten Lectures on Wavelets, Society for Industrial and Applied Mathematics: Philadelphia, 1992.
10. Ma, C.X.; Shao, X.G.; J. Chem. Inf. Comp. Sci.2004, 44, 907. 11. Rajasekaran, S.; Varghese, S. P.; Comp. Concrete2005, 2, 481.
12. Dinç, E.; Baleanu, D.; J. AOAC Int. 2004, 87, 834. 13. Dinç, E.; Ozdemir, A.; Baleanu, D.; Talanta 2005, 65, 36. 14. Dinç E.; Baleanu, D.; J .AOAC Int.2004, 87, 360.
15. Dinç, E.; Ozdemir, A.; Baleanu, D.; J. Pharm. Biomed. Anal.
2005, 37, 569.