Metabolic Syndrome in Mice
Kathrin Ikels1, Stefanie Kuschel1, Julia Fischer1, Wolfgang Kaisers3, Daniel Eberhard2, Ulrich Ru¨ther1*
1Institute of Animal Developmental and Molecular Biology, Heinrich Heine University, Du¨sseldorf, Germany,2Institute of Metabolic Physiology, Heinrich Heine University, Du¨sseldorf, Germany,3Coordination Centre for Clinical Trials, Heinrich Heine University, Du¨sseldorf, Germany
Abstract
The metabolic syndrome is a worldwide problem mainly caused by obesity. FTO was found to be a obesity-risk gene in humans and FTO deficiency in mice led to reduction in adipose tissue. Thus, FTO is an important factor for the development of obesity. Leptin-deficient mice are a well characterized model for analysing the metabolic syndrome. To determine the relevance of FTO for the development of the metabolic syndrome we analysed different parameters in combined homozygous deficient mice(Lepob/ob;Fto2/2). Lepob/ob;Fto2/2 mice showed an improvement in analysed hallmarks of the metabolic syndrome in comparison to leptin-deficient mice wild type or heterozygous for Fto.Lepob/ob;Fto2/2mice did not develop hyperglycaemia and showed an improved glucose tolerance. Furthermore, extension of beta-cell mass was prevented in Lepob/ob;Fto2/2mice and accumulation of ectopic fat in the liver was reduced. In conclusion this study demonstrates that FTO deficiency has a protective effect not only on the development of obesity but also on the metabolic syndrome. Thus, FTO plays an important role in the development of metabolic disorders and is an interesting target for therapeutic agents.
Citation:Ikels K, Kuschel S, Fischer J, Kaisers W, Eberhard D, et al. (2014) FTO Is a Relevant Factor for the Development of the Metabolic Syndrome in Mice. PLoS ONE 9(8): e105349. doi:10.1371/journal.pone.0105349
Editor:Marc Claret, Institut d’Investigacions Biome`diques August Pi i Sunyer, Spain
ReceivedJanuary 9, 2014;AcceptedJuly 23, 2014;PublishedAugust 21, 2014
Copyright:ß2014 Ikels et al. This is an open-access article distributed under the terms of the Creative Commons Attribution License, which permits unrestricted use, distribution, and reproduction in any medium, provided the original author and source are credited.
Funding:This work was supported by a grant from the BMBF (NGFN plus) and the DFG through SFB612. The funders had no role in study design, data collection and analysis, decision to publish, or preparation of the manuscript.
Competing Interests:The authors have declared that no competing interests exist.
* Email: [email protected]
Introduction
The metabolic syndrome is a disease, which combines several different metabolic abnormalities such as central obesity, hyper-tension, elevated serum triglycerides and insulin resistance. Furthermore, it is strongly associated with ectopic fat accumula-tion, dysfunctions of muscle, adipose tissue and liver as well as pancreatic abnormalities. Therefore it is one of the major risk factors for cardiovascular diseases and diabetes [1,2,3,4,5]. Obesity is the most dominant factor for the development of the metabolic syndrome leading to insulin resistance and type 2 diabetes. Particularly obesity in childhood is strongly associated with the development of the metabolic syndrome [6,7,8]. Besides lifestyle and environmental factors, such as eating behaviour and physical activity, genetic predispositions play a basic role in the development of obesity.
In general, control of energy homeostasis is based on the regulation of food intake. This regulation mainly takes place in the hypothalamus. Especially two populations of neurons expressing NPY/AgRP and POMC/CART in the arcuate nucleus play an important role in the regulation of food intake. One of the appetite regulating proteins is leptin, a circulating hormone, released by adipocytes [9,10]. It acts via binding to leptin receptors in the hypothalamus and thus inhibiting appetite stimulating neuropep-tides NPY and AgRP on the one hand and activating appetite suppressing transmitters POMC and CART on the other hand [11,12,13]. Consequently, leptin deficiency leads to hyperphagia, resulting in severe obesity and hyperinsulinemia in human [14,15,16,17].
The murineLepob/obmodel is well characterized. Mice lacking leptin suffer from enormous weight gain, hyperglycaemia, hyperinsulinemia and glucose intolerance [18]. Weight loss can be induced by leptin infusion in Lepob/ob mice. This leads to a reduction of appetite and therefore to a reduction of food intake [19,20,21].Lepob/obmice have been widely used to study the details of the metabolic syndrome [18,22,23]. Furthermore, influences on the development of the metabolic syndrome by different means such as genetic factors or drugs have been addressed in theLepob/ob
model [24,25,26,27].
Genome-wide association studies (GWAS) of obese people indicated about 50 genes to be involved in body weight regulation [28]. One of these genes is theFat mass and obesity associatedgene FTO. In several studies, SNPs in the FTO gene were highly associated with increased body mass index. These studies could show that individuals carrying a risk allele exhibit about 1.5 kg higher weight than those with non-risk alleles most likely due to an increase in food intake [29,30,31,32]. Consequently, the relation of leptin to FTO was addressed in further studies. Whereas one study could show that leptin downregulates FTO [33] another one provided evidence for a regulation of leptin signaling by FTO [34]. Thus, loss of FTO should result in a loss of leptin signaling and therefore hyperphagia.
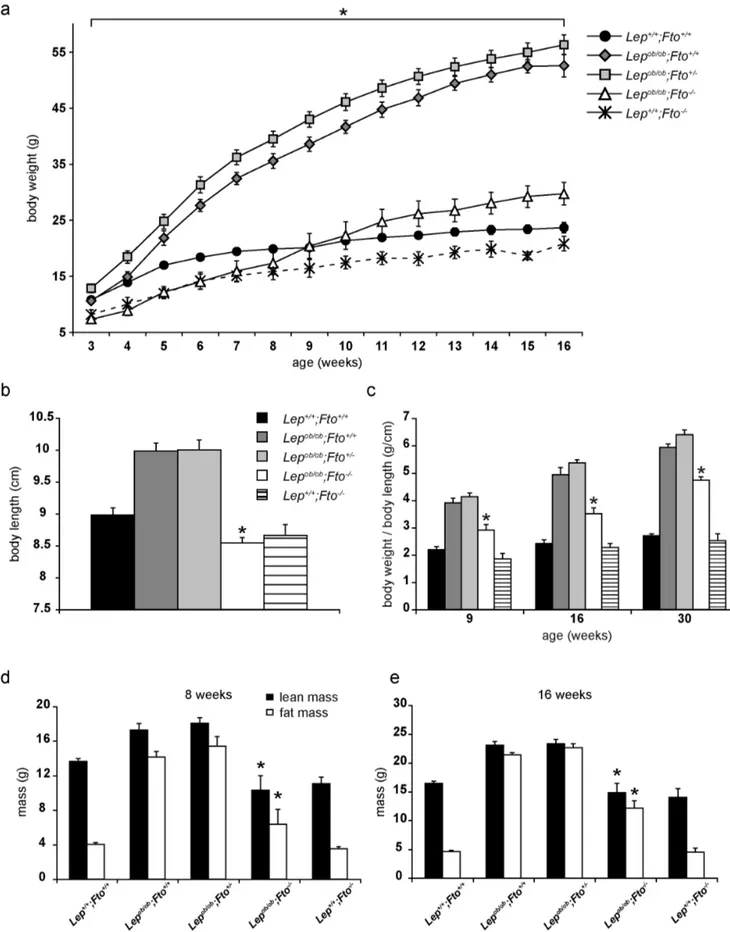
Figure 1. FTO contributes to gain of body weight inLepob/obmice.All data are collected from female mice. a) Development of body weight from 3 to 16 weeks of age. n(Lep+/+; Fto+/+
) = 15–20, n(Lepob/ob;Fto+/+
) = 11–13, n(Lepob/ob;Fto+/2) = 15–19, n(Lepob/ob;Fto2/2) = 9–12, n(Lep+/+;Fto2/
2) = 4–6. Asterisks (*) indicate significant p-values betweenLepob/ob
;Fto2/2andLepob/ob;Fto+/+. Further significant p-values were found:Lep+/+;Fto+/+–
Lepob/ob;Fto2/2: p#0,05 (weeks 3–8+11–16);Lep+/+;Fto+/+
–Lepob/ob;Fto+/+
: p#0,05 (weeks 4–16);Lep+/+;Fto+/+
–Lepob/ob;Fto+/2: p#0,05 (weeks 4–16); FTO and the Metabolic Syndrome
seems to be a consequence of increased energy expenditure [36] which is accompanied by browning of epigonadal and inguinal white adipose tissue [37]. Another study confirmed reduced fat mass, increased food intake and energy expenditure [38]. However, adult onset FTO-deficient mice exhibited reduced body weight and lean mass but did not show changes in fat mass, food intake and energy expenditure [35]. As FTO has a function in energy homeostasis we were interested to see whether FTO is also important for the development of the metabolic syndrome. To address this, we used the well characterised leptin-deficient mouse model (Lepob/ob). Lepob/ob;Fto2/2 mice were analysed and com-pared to Lep+/+; Fto+/+
, Lepob/ob;Fto+/+
and Lepob/ob;Fto+/2 litter-mates.
Methods
Ethics statement
All animal experiments were performed in accordance with the relevant national guidelines for the Care and Use of Laboratory Animals (LANUV) and with approval from the authority for animal work at Heinrich Heine University Du¨sseldorf, Germany (Permit number 84-02.05.20.11.217).
Animal care
C57BL/6JLepob/obmice were kindly provided by Jens Bru¨ning,
Cologne.Ftomutant mice (C57BL/6J) are described [36].Fto+/2 mice were crossed withLepob/+
mice and afterwardsLepob/+ ;Fto+/2 mice were crossed among each other. All mice used in this study were housed at 22–24uC on a 12/12 h dark-light cycle with food and water ad libitum. Body weight was measured every week over a period from 3 to 30 weeks. At the age of 30 weeks animals were killed, body length was measured, organs and fat depots were isolated and weighed. Organs needed for further experiments were stored or handled according to the method.
Antibodies
We used a polyclonal antibody against insulin raised in rabbit (Santa Cruz Biotechnology, sc-9168) and a polyclonal antibody against glucagon raised in guinea pig (Millipore, 4031-01F). As secondary antibodies Cy2-conjugated IgGs raised in guinea pig (Jackson Immuno Research,#706-225-148) and Cy3-conjugated IgGs raised in rabbit (Jackson Immuno Research,#711-165-152) were used.
Blood analysis
Blood glucose was determined from whole blood using an automatic monitoring system (GlucoMen Visio Sensor, A. Menarini Diagnostics). Insulin was measured in blood plasma using Ultra Sensitive Rat Insulin ELISA Kit (Chrystal Chem. Inc, #90060).
Body composition analysis
Lean mass and fat mass of living animals was determined using an NMR Analyser (Minispec, Bruker).
Cell size measuerements of adipocytes
Paraffin embedded epigonadal adipose tissue sections (12mm)
were stained with Hematoxylin and Eosin and photographed (Axiocam MRc, Zeiss). Area of 300 adipocytes per individual were measured using Axiovision Rel. 4.8 (Zeiss).
Extraction of fat from the liver
Nine pieces of liver (every piece about 50 mg) were isolated, weighed and homogenized in water and transferred into glass tubes. 4 ml chloroform/methanol (2:1) was added, mixed and incubated over night at 4uC to separate the phases. The next day 0.8 ml 0.9% NaCl was added and mixed again, followed by a centrifugation step (10 minutes at 2500 rpm). The lowermost phase of 3 samples of the same individual was transferred into a new glass vial, which has been weighed before. Over three days the liquid evaporated. The tube with the remaining fat was weighed again and the amount of fat per mg liver was determined. A triple quantification has been performed in every case.
Glucose and Insulin tolerance test
Glucose tolerance tests were performed on animals fasted for 16 h. Insulin tests were performed on randomly fed animals. Either 2 g kg21 (at the age of 6 weeks) body weight of a 20% glucose solution (1 g kg21at the age of 14 weeks) or 0.75 U kg21 body weight of human regular insulin (Actrapid, Novo Nordisk, diluted to 100 mU/ml) was injected into the peritoneal cavity and blood glucose levels were determined at defined time points (after 15, 30, 60, 120 minutes for GTT, after 15, 30, 60 minutes for ITT).
Immunofluorescence
Pancreas cryo sections were washed with PBS, permeabilized with PBS/0.1% Triton-X-100 and blocked with 10% FCS in PBS/0.1% Triton-X-100. Afterwards, they were incubated with primary antibodies (diluted in blocking solution) over night at 4uC. Beta cells were illustrated by insulin staining, alphacells were illustrated by glucagon staining. After 3 washing steps they were incubated with secondary antibodies (diluted in blocking solution) for 4–6 hours, washed again and embedded in Mowiol containing DAPI (Merck,#1.24653).
Islets measurements
To measure the area of islets of Langerhans, pancreas sections were stained for insulin and photographed (Axiocam MRM, Zeiss). Then the stained islets were surrounded and the areas were determined with a documentation software (Axiovision Rel. 4.8, Zeiss). Additionally, the area of the whole pancreas section was photographed (Axiocam MRC, Zeiss), measured and the islet area in relation to the whole area was determined (Axiovision Rel. 4.7, Zeiss). For each individual 9 sections were measured which was about every 20th section.
Metabolic data
Physical activity and food intake was measured using the metabolic cages (PhenoMaster, TSE-System). Animals were kept for 72 hours separated for adaptation in metabolic cages without
Lepob/ob;Fto2/2–Lepob/ob;Fto+/2: p#0,05 (weeks 3–16); Lepob/ob;Fto+/+
–Lepob/ob;Fto+/2: p#0,05 (weeks 4–14);; Lep+/+;Fto+/+
–Lep+/+;Fto2/2: p#0,05 (weeks 3–16). b–e) *indicate significant p-values toLepob/ob;Fto+/+. b) Body length at the age of 30 weeks (n = 14, 15, 17, 15, 10). c) Body weight in
relation to body length at the age of 9 (n = 6, 6, 7, 5, 5), 16 weeks (n = 4, 6, 7, 5, 4) and 30 weeks (n = 14, 15, 17, 15, 10) of age. d) Lean mass and fat mass at the age of 8 weeks (n = 7, 8, 4, 4, 3). e) Lean mass and fat mass at the age of 16 weeks (n = 12, 7, 9, 4, 3). All data are presented as mean. Error bars indicate the SEM.
FTO and the Metabolic Syndrome
measurement. After adaption activity and food intake was monitored for 72 hours. Activity was recorded using infrared sensor frames. Interruptions of infrared sensors were detected by a control unit and registered by a computer with the relevant software (ActiMot2, TSE Systems). Food intake was measured by integrated weighting sensors.
Oil red O staining
For staining the stock solution (Oil red O (Sigma,#O-9755) dissolved in propanol) was diluted in water (working solution) and filtered. Liver cryo sections were incubated with the working solution for 10 minutes, washed under running water and afterwards incubated with hematoxylin for one minute. After a second washing step the sections were embedded in glycerol gelatine and sealed.
Real-time PCR Analysis
RNA from epigonadal adipose tissue was isolated using RNeasy Kit (Qiagen #74104) and RNase-Free DNase Set (Qiagen # 79254). Isolated RNA was converted into cDNA by using Expand Reverse Transcriptase (Roche # 11785826001). Quantitative Real-time PCR was performed by employing a Mx3000P qPCR System (Agilent Technologies) and by using the Agilent Brilliant III Sybr green kit. The following Primers (MWG Eurofins) were used: RPLP0 (59: GATGCCCAGGGAAGACA, 39:
ACAAT-GAAGCATTTTGGA), PPARc2 (59
:GTTTTATGCTGT-TATGGGTG, 39:GTAATTTCTTGTGAAGTGCTCATAG),
Adiponectin (59:TGTACGATTGTCAGTGGATCTG,
39:ACGTCATCTTCGGCATGACT), TNFa
(59:TCTTCTCATTCCTGCTTGTGG, 39
:GGTCTGGGCCA-TAGAACTGA), MCP1 (59:CATCCACGTGTTGGCTCA,
39:GATCATCTTGCTGGTGAATGAGT), IL-6 (59
:AACGAT-GATGCACTTGCAGA, 39:GAGCATTGGAAATTGGGGTA),
UCP1 (59: ACTGCCACACCTCCAGTCATT,
39:CTTTGCCTCACTCAGGATTGG). Gene activity was ex-pressed in relation to the housekeeping gene RPLR0 using the ddct method.
Tissue embedding
For cryo sections organs were fixed in 4% paraformaldehyde (PFA) and incubated in 30% sucrose (in PBS) over night at 4uC. After that they were embedded in Tissue-Tek O.C.T. (Sacura Finetec,#4583) and stored at280uC. For analysis 7–12mm thin cryostat sections were prepared.
For paraffin sections organs were fixed in 4% PFA over night. Then they were dehydrated by increasing concentrations of ethanol and butanol, embedded in paraffin and sectioned (7– 12mm). For histological analyses the sections were stained with hematoxylin and eosin and embedded in entellan (Merck, # 1.07961).
Statistical Data
All values are presented as mean6 SEM. Statistical analysis was performed using R (version 3.1.0) [39]. Differences between two samples were tested by two-sided t-Test. Differences between all present genotypes were determined by ANOVA (aov) followed by construction of confidence intervals using Tukey’s Honest
Significant Difference method (TukeyHSD). Time coures of blood glucose levels were compared by bootstrapped mean values for each point of time (10000 samplings). Timely dependent weight gains were modeled using local polynomial regression (loess). Confidence intervals were calculated by bootstrapping loess regression (10000 samplings).
Results
Influence of FTO on body weight development inLepob/ ob
mice
The extreme body weight is the most obvious phenotype of leptin deficiency. Therefore, we firstly analysed the influence of FTO on body weight gain inLepob/obmice within the first 16 weeks
of their life. Since more female than male mice were available for the analysis due to a 50% higher postnatal death rate of males (Figure S1) the data are presented for females. Nevertheless, as presented in Figure S2 the data are very similar for male mice. Lepob/ob;Fto+/+mice as well as Lepob/ob;Fto+/2 mice gained more weight in a shorter time than wild type mice did, while absence of FTO and leptin resulted in an increase in body weight that was similar to wildtype after 9 weeks (Fig. 1a). In the first 8 weeks of their life, however, theseLepob/ob; Fto2/2mice were similar to the Fto2/2 mice (Fig. 1a). Thus, FTO contributes to body weight development inLepob/obmice. Since it was described thatFto2/2 mice also have a reduced body length we addressed this phenomenon inLepob/obas well. As publishedLepob/obindividuals displayed an increased body length compared to wild type mice (Fig. 1b). Interestingly, the loss of FTO was dominant over the loss of leptin resulting in leptin-deficient mice being similar to theFto2/ 2mice (Fig. 1b). Considering this, we adjusted the body weight to
body length for 9 weeks and 16 weeks old mice. Nevertheless, mice deficient for leptin and FTO were either equal to wild type (9 weeks old) or, when 16 weeks old, 25% heavier than wild type (Fig. 1c). Since this finding suggested an age dependent body weight change in Lepob/ob;Fto2/2mice we investigated 30 weeks old mice. As shown in Fig. 1c, even in these mice a significant difference betweenLepob/ob;Fto+/+mice and Lepob/ob;Fto2/2 mice was obvious.
Next we analysed body composition of all five genotypes. In 8 weeks oldLepob/ob;Fto+/+mice lean and fat mass were significantly increased compared to wild type mice whileLepob/ob;Fto2/2mice showed no significant differences (Fig. 1d). In 16 weeks old mice all Lepob/ob mice independent of the Fto genotype showed a
significant increase in fat mass compared to wild type mice. However, only theLepob/obmice with FTO additionally displayed an increase of lean mass (Fig. 1e). Thus, early in life FTO contributes to lean and fat mass development inLepob/obmice.
In contrast to inguinal and interscapular fat, the epigonadal fat tissue of 30 weeks old female mice did not differ much in weight between the three Lepob/ob genotypes (Fig. 2a). Therefore, we analysed this tissue in more details. Firstly, adipocyte cell size of leptin deficient mice did not differ FTO dependently (Fig. 2b). However, analysis of adipose marker gene expression in Lepob/
ob;Fto2/2 mice revealed interesting differences (Fig. 2c). Genes
encoding for proteins which are involved in inflammation (TNFa, MCP1, IL6) were similar to wild type mice while expression of Figure 2. Detailed analysis of adipose tissue.All data are collected from 30 weeks old mice. *indicate significant p-values betweenLepob/ob;Fto+/ +andLepob/ob
; Fto2/2. a) Weights of different fat pads from female mice (n = 13, 16, 18, 16). b) Area size of epigonadal fat cells from female mice (n = 4, 4, 8, 7). c+d) Expression analysis for different marker genes of epigonadal adipose tissue (n = 6, 4, 5, 5, 5). Following p-values were calculated: between Lepob/ob;Fto+/2 andLepob/ob
; Fto2/2: PPARc2: p = 0,08, Adiponectin: p = 0,21, TNFa:p = 0,06, IL-6:p = 0,03. Data are presented as mean. Error bars
indicate the SEM.
FTO and the Metabolic Syndrome
PPARc2 and adiponectin was equal or lower compared to wild type but higher compared to the other leptin deficient mice. Browning of white fat was indicated by increased expression of UCP-1, however not as strong as in Fto-negative mice (Fig. 2d). Thus, loss of Fto inLepob/ob mice leads to a normalisation of the adipogenic program and to a reduction of inflammation. Furthermore, a transformation of white to brown adipose tissue seems to happen.
Next we analysed food intake. As expectedLepob/obmice with FTO fed twice as much as wild type mice (Figure S3a).Lepob/ob mice without FTO however, fed less than wild type mice although the difference was not significant even when the lean mass of the animals were considered (Figure S3a,b). Obesity is the conse-quence of an imbalance of food intake and physical activity. Our data clearly showed that allLepob/obmice independent of the Fto genotype showed equivalent low physical activity levels (Figure S3c). Thus, hyperphagia ofLepob/obmice is positively influenced by FTO.
FTO contributes to the development of hyperglycaemia As increased body weight can result in elevated glucose levels, we performed glucose tolerance tests (GTT). We chose mice at the age of 6 weeks because body weight differences were already apparent (Fig. 1a). In fasting mice, glucose levels were already higher in Lepob/ob;Fto+/+ and Lepob/ob;Fto+/2 mice compared to wild type and Lepob/ob;Fto2/2 mice (Fig. 3a). Consistently, in GTT,Lepob/ob;Fto2/2mice had already normalised their glucose levels after 60 minutes, theLepob/obmice, being either wild type or heterozygous forFto, continued to have elevated levels even after 120 minutes (Fig. 3c). These levels are very similar to the levels of blood glucose of non-fasted mice at the same age (Fig. 3b). Thus, leptin-deficient mice with FTO display a hyperglycaemia already early in life. To analyse the responsiveness to insulin, we chose the same mice a week later for the insulin tolerance test (ITT). Whereas wild type mice reduced their glucose levels within 30 minutes to about 50%, glucose levels of allLepob/obmice were only reduced to about 80% after 30 minutes (Fig. 3d). However,Lepob/
ob;Fto2/2 mice showed lower starting glucose concentrations
(Fig. 3b). The further development of the hyperglycaemia was addressed by repeating both assays 8 weeks later. At the age of 14 weeks the GTT was comparable to the one performed in 6 weeks old mice (compare Fig. 3c and Fig. 3g). Thus, development of hyperglycaemia inLepob/obmice is depending on FTO. However, in the ITT performed with mice at the age of 15 weeks, differences become obvious. Only wild type mice reduced glucose levels upon insulin injection (Fig. 3h). In contrast, all Lepob/ob mice did not respond to the insulin injection (Fig. 3h) suggesting an insulin resistance at that age. Nevertheless, Lepob/ob;Fto2/2 mice still displayed lower starting glucose concentrations (Fig. 3 f). When we killed the mice at the age of 30 weeks we analysed glucose (Fig. 3i) and insulin (Fig. 3j) concentration in plasma. All leptin-deficient mice had at least 10 fold higher levels compared to wild type, however plasma glucose is not increased inLepob/ob;Fto2/2mice. Thus Lepob/ob;Fto2/2 mice can handle high glucose levels, although they are insulin resistant.
Increase of pancreatic islet size in leptin-deficient mice is dependent on FTO
The increased demand for the production of insulin during insulin resistance and hyperglycemia can result to beta cell hypertrophy and proliferation, and finally to enlarged islets. To analyse islet growth, we chose 30 weeks old animals, isolated the pancreas and stained either for histology or for alpha or beta cells in the islets with antibodies directed against glucagon or insulin. Size measurements of islets of Langerhans showed an increase in size and the appearance of enormous islets in the pancreas of Lepob/ob;Fto+/+ and Lepob/ob;Fto+/2 animals (Fig. 4a+c). They possessed more islets of a size of 10000–100000 mm2than wild
types and even islets of more than 100000mm2can develop which
were never seen in wild type mice. This phenotype of increased islet sizes was found to be reduced in Lepob/ob;Fto2/2 mice (Fig. 4a–d). AlthoughLepob/ob;Fto2/2 mice had bigger islet areas per pancreas area than wild type, they had less islet areas than Lepob/ob;Fto+/+andLepob/ob;Fto+/2animals (Fig. 4c). Furthermore, inLepob/ob;Fto2/2mice size distribution was altered and they never showed giant islets (Fig. 4d).
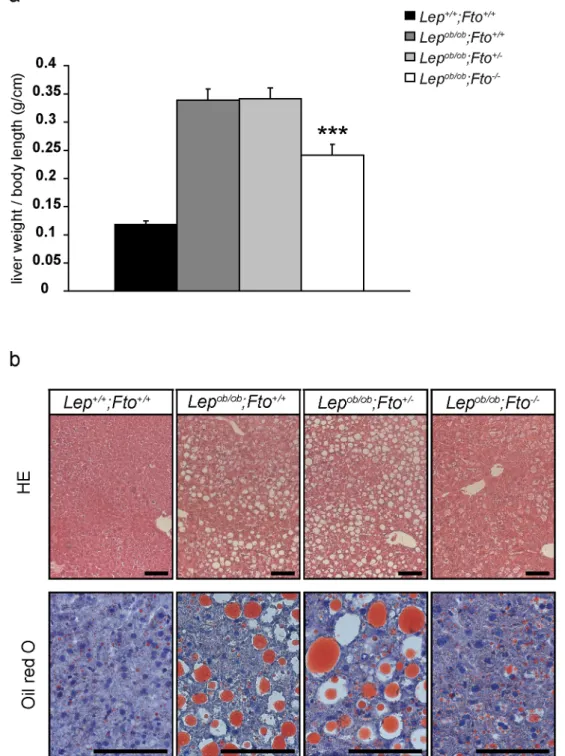
Increased lipid content in liver cells of leptin-deficient mice is influenced by FTO
Excess of lipids in the blood leads to dysregulation of energy storage and ectopic fat accumulation within and around different organs. This increased accumulation can impair the function of these organs and thus interfere with the health status of individuals. The liver is one of these organs, in particular in older mice. Increased fat accumulation in the liver can lead to development of hepatic insulin resistance. Therefore, the same mice as used for the pancreas analyses were chosen.
Liver weight in leptin-deficient mice showed a dramatic increase in comparison to organs of wild type mice (Fig. 5a). The loss of FTO in leptin-deficient animals led to a clear reduction in liver weight in comparison to Lepob/ob;Fto+/+
and Lepob/ob;Fto+/2 littermates, but they still showed a higher weight than wild type animals (Figure S4a). Lepob/ob;Fto2/2 mice were significantly smaller than their littermates, therefore liver weights were calculated per body length. Nevertheless, livers were lighter in Lepob/ob;Fto2/2mice compared toLepob/ob;Fto+/+
andLepob/ob;Fto+/
2littermates (Fig. 5a).
To investigate the degree of steatosis in the liver, we isolated triglycerides of the organs and measured the amount by weight. Obviously loss of FTO led to a significant decreased fat accumulation in the liver of leptin-deficient mice (Figure S4b). This was also visible in histological analyses on paraffin liver sections showing a more homogeneous area in Lepob/ob;Fto2/2 mice compared toLepob/ob;Fto+/+and Lepob/ob;Fto+/2 littermates (Fig. 5b). Furthermore, an Oil red O staining indicated a reduction of fat droplets inLepob/ob;Fto2/2mice (Fig. 5b). Thus, accumulation of fat in the liver of leptin-deficient mice depends on FTO.
Figure 3. FTO contributes to the development of hyperglycaemia.All data are elevated from female mice. *indicate significant p-values betweenLepob/ob;Fto+/+andLepob/ob
FTO and the Metabolic Syndrome
Figure 4. Increase of pancreatic islet size in leptin-deficient mice is depending on FTO.a) Haematoxylin and eosin staining on paraffin sections of the pancreas for all 4 genotypes. b) Immunofluorescence staining for insulin (red) and glucagon (green) on pancreas sections. Nuclei are stained with DAPI. Scale = 100mm. c) Area of beta cells in relation to full pancreas section area. d) Number of islets of Langerhans which were found
on sections categorized into 3 groups of size. Pancreas were taken from 30 weeks old female mice (n = 5, 6, 7, 5). All data are presented as mean. Error bars indicate the SEM.
doi:10.1371/journal.pone.0105349.g004
Figure 5. Accumulation of fat in liver of leptin-deficient mice is influenced by FTO.a) Liver weight in relation to body length (n = 13, 14, 16, 14). *indicate significant p-values betweenLepob/ob;Fto+/+andLepob/ob
;Fto2/2. b) Haematoxylin and eosin staining on paraffin sections (upper row) and oil red O staining on cryo sections (lower row) for all 4 genotypes. Scale = 100mm. Livers were used from female mice at the age of 30 weeks. All data
Discussion
In this study, we could show that FTO is a factor which contributes substantially to the development of the obese phenotype in leptin-deficient mice and thus to the metabolic syndrome as exemplified by hyperglycaemia and increased lipid content in liver.
FTO and development of obesity
Our analyses of body weight development of leptin-deficient mice within the first 10 weeks of their life have shown very clearly that FTO contributes to the gain of body weight. This result is very similar to the data of feeding leptin-wild type mice with differentFtogenotypes with a high caloric diet [36]. Thus, in both settings loss of FTO protects against obesity independent of the presence of leptin. However, our analysis also showed that leptin-deficient mice older than 15 weeks gain more weight than wild type independent of theFto genotype. This indicates that body weight development towards obesity is delayed by about three months when FTO is absent. Based on the observation thatFto+/2 mice showed a slower development of obesity on high fat diet [36] we had expected to see a similar delay forLepob/ob;Fto+/2 mice. This is clearly not the case. Thus, leptin deficiency has a stronger effect than high fat diet and overrides the consequence of a 50% reduction of FTO. Nevertheless, even in mice of 30 weeks of age we can monitor a significant difference between leptin-deficient mice with and without FTO. Certainly, it would be interesting to see whether even mice one year older still show a difference. In this respect also a conditional loss of FTO would be an attractive approach to see if a deletion of FTO in leptin-deficient mice at later time points can reverse or at least slow down the further development of the obese phenotype.
FTO and development of metabolic syndrome
We have monitored four hallmarks of the metabolic syndrome, namely glucose levels and insulin response, pancreatic islet size as well as ectopic fat accumulation. For all of these, except insulin response and insulin levels, we have found an improvement comparing leptin-deficient mice with FTO to those without FTO. Nevertheless, in contrast to theLepob/obmice with FTO, theLepob/ ob
mice without FTO were able to handle high levels of glucose as showing in the GTT. Furthermore, Lepob/ob;Fto2/2 mice com-pensate insulin resistance and maintain normoglycemia without showing hypertrophy of islets of Langerhans. Recently, a study demonstrated the effect of insulin-independent glucose lowering for FGF19. AlthoughLepob/obmice were already insulin resistant, treatment with FGF19 resulted in an enhanced glucose uptake [40] indicating an insulin-independent uptake of glucose. Similar-ly, loss of FTO could stimulate insulin-independent glucose uptake for example of the liver, the organ which is only slightly affected by fat accumulation in theLepob/ob;Fto2/2mice. Thus, hyperglycae-mia inLepob/obmice is a consequence of FTO activity and leads to a stronger increase of islet size in the pancreas compared to the Lepob/ob;Fto2/2mice.
The primary reason for the improvement of metabolic parameters is most likely the delay of development of obesity. Based on our analysis of food intake, Lepob/ob;Fto2/2 mice only consume about 20% of calories compared toLepob/ob;Fto+/+mice. Since both genotypes have a similar reduced physical activity Lepob/ob;Fto+/+
mice gain weight and massively develop fat depots. In addition, our analyses show that FTO deficiency in leptin deficient mice leads to a reduction of inguinal and interscapular fat tissue while the epigonadal is unaltered. Thus, FTO seems to be involved in specific fat deposition. However, comparision of
epigonadal fat pads which are equal in size inLepob/obmice with
and without FTO revealed functional differences. Most impor-tantly, expression of PPARc2, the master regulator of fat-cell
function, was normalised when FTO was absent. As shown in several publication (for review, see [41]), PPARc2 has metabolic and anti-inflammatory properties leading to upregulation of adiponectin and downregulation of TNFa. Indeed, our expression
analysis showed a clear tendency towards this profile as a consequence of loss of FTO. This result indicates a normalisation of at least the epigonadal adipose tissue in lipid storage and thereby a functional contribution of FTO in the development of the metabolic syndrome in addition to the kinetics of obesity development. Recently it was shown that increased energy expenditure in Ftonegative mice might be caused by browning of epigonadal and inguinal white adipose tissue [37]. Similarly we found an upregulation of UCP-1, the marker for browning of fat tissue inLepob/ob;Fto2/2mice. Thus, although not analysed by us, increase of energy expenditure could further contribute to the improvement of the metabolic syndrome in the Lepob/ob;Fto2/2 mice.
Recently, several studies have addressed whether FTO in humans might be associated with the metabolic syndrome. However, the results are controversial. Whereas one study, concentrated on obese females, concluded no association [42], another using data from several studies, clearly showed an association of FTO with the metabolic syndrome [43]. Neverthe-less, several studies demonstrated a clear correlation between genetic variations of theFTO gene and an early development of obesity, which is the main cause for the metabolic syndrome.
Perspectives
Having shown the relevance of FTO for the development of the metabolic syndrome in an animal model, which is supported by certain GWAS in humans [43], the question arises how FTO can be a target in the context of an anti-obesity therapy. To this end, a recent publication reported about a drug used in traditional Chinese medicine called rhein, which was most efficient among several substances tested [44]. However, the assay used was exclusively based on the reduction of the demethylase activity of FTO which is the only activity described so far for FTO [45]. Similar, another study screened small molecules also used in clinical studies to block 2-OG oxygenases [46]. The limitation of both studies is that they consider the demethylase activity of FTO as relevant for its association with obesity. However, this has never been shown. Nevertheless, demethylase activity of FTO is most likely the activity being the target for an anti-obesity therapy. Thus, we are not far away to make the step from basic science to translational research.
Supporting Information
Figure S1 Genotype distribution at the age of 3 weeks. 153 litters (Lep+/ob;Fto+/2
6Lep+/ob;Fto+/2) with collectively 995 offsprings are analysed and presented proportionately. Compared are the expected values with the found distribution specified for the sex. Female and male mice are underrepresented if Fto is completely deleted. MaleLepob/ob;Fto2/2mice show an even lower survival rate than females.
(TIF)
Figure S2 Body weight and body composition analysis of male mice.All data are elevated from male mice. *indicate significant p-values betweenLepob/ob;Fto+/+andLepob/ob;Fto2/2. a) Development of body weight from 3 to 16 weeks of age. n(Lep+/
+;Fto+/+
) = 19–21, n(Lepob/ob;Fto+/+
) = 14–20, n(Lepob/ob;Fto+/ FTO and the Metabolic Syndrome
2) = 23–32, n(Lepob/ob;Fto2/2) = 4–6, n(Lep+/+;Fto2/2) = 4–11. b)
Body length at the age of 30 weeks (n = 17, 18, 28, 8, 13). c) Body weight in relation to body length at the age of 9 weeks (n = 9, 9, 9, 4, 6), 16 weeks (n = 8, 8, 9, 4, 9) an 30 weeks (n = 17, 17, 28, 8, 8). d) Lean mass and fat mass at the age of 8 weeks (n = 7, 7, 9, 2, 2). e) Fat mass in relation to lean mass at the age of 8 weeks (n = 7, 7, 9, 2, 2). All data are presented as mean. Error bars indicate the SEM. (TIF)
Figure S3 Metabolic data of female mice at the age of 8 weeks.*indicate significant p-values betweenLepob/ob;Fto+/+and Lepob/ob; Fto2/2. a) Food intake per hour. b) Food intake per hour relative to lean mass. c) Physical activity. n (a–c) = 7, 8, 4, 4, 3. Data are presented as mean. Error bars indicate the SEM. (TIF)
Figure S4 Liver analysis. Organs were taken from female mice at the age of 30 weeks. *indicate significant p-values between Lepob/ob;Fto+/+
andLepob/ob;Fto. a) Liver weight (n = 13, 14, 16, 14). b) Mass of fat isolated from the liver in relation to liver weight (n = 6, 6, 6, 6). All data are presented as mean.
(TIF)
Acknowledgments
We would like to thank for critical reading of the manuscript Renate Dildrop, Christoph Gerhardt, Stephan Burmu¨hl und Andre´ Spychala.
Author Contributions
Conceived and designed the experiments: KI UR. Performed the experiments: KI SK DE. Analyzed the data: KI DE. Contributed reagents/materials/analysis tools: WK JF. Wrote the paper: KI UR.
References
1. Lemieux I, Pascot A, Couillard C, Lamarche B, Tchernof A, et al. (2000) Hypertriglyceridemic waist: A marker of the atherogenic metabolic triad (hyperinsulinemia; hyperapolipoprotein B; small, dense LDL) in men? Circulation 102: 179–184.
2. Carr DB, Utzschneider KM, Hull RL, Kodama K, Retzlaff BM, et al. (2004) Intra-abdominal fat is a major determinant of the National Cholesterol Education Program Adult Treatment Panel III criteria for the metabolic syndrome. Diabetes 53: 2087–2094.
3. Park YW, Zhu S, Palaniappan L, Heshka S, Carnethon MR, et al. (2003) The metabolic syndrome: prevalence and associated risk factor findings in the US population from the Third National Health and Nutrition Examination Survey, 1988–1994. Arch Intern Med 163: 427–436.
4. van Herpen NA, Schrauwen-Hinderling VB (2008) Lipid accumulation in non-adipose tissue and lipotoxicity. Physiol Behav 94: 231–241.
5. Szendroedi J, Roden M (2009) Ectopic lipids and organ function. Curr Opin Lipidol 20: 50–56.
6. Hauner H (2004) The new concept of adipose tissue function. Physiol Behav 83: 653–658.
7. Pollex RL, Hegele RA (2006) Genetic determinants of the metabolic syndrome. Nat Clin Pract Cardiovasc Med 3: 482–489.
8. Weiss R, Dziura J, Burgert TS, Tamborlane WV, Taksali SE, et al. (2004) Obesity and the metabolic syndrome in children and adolescents. N Engl J Med 350: 2362–2374.
9. Saladin R, De Vos P, Guerre-Millo M, Leturque A, Girard J, et al. (1995) Transient increase in obese gene expression after food intake or insulin administration. Nature 377: 527–529.
10. Considine RV, Considine EL, Williams CJ, Nyce MR, Magosin SA, et al. (1995) Evidence against either a premature stop codon or the absence of obese gene mRNA in human obesity. J Clin Invest 95: 2986–2988.
11. Mizuno TM, Mobbs CV (1999) Hypothalamic agouti-related protein messenger ribonucleic acid is inhibited by leptin and stimulated by fasting. Endocrinology 140: 814–817.
12. Elmquist JK, Ahima RS, Maratos-Flier E, Flier JS, Saper CB (1997) Leptin activates neurons in ventrobasal hypothalamus and brainstem. Endocrinology 138: 839–842.
13. Balthasar N, Coppari R, McMinn J, Liu SM, Lee CE, et al. (2004) Leptin receptor signaling in POMC neurons is required for normal body weight homeostasis. Neuron 42: 983–991.
14. Montague CT, Farooqi IS, Whitehead JP, Soos MA, Rau H, et al. (1997) Congenital leptin deficiency is associated with severe early-onset obesity in humans. Nature 387: 903–908.
15. Strobel A, Issad T, Camoin L, Ozata M, Strosberg AD (1998) A leptin missense mutation associated with hypogonadism and morbid obesity. Nat Genet 18: 213–215.
16. Farooqi IS, Matarese G, Lord GM, Keogh JM, Lawrence E, et al. (2002) Beneficial effects of leptin on obesity, T cell hyporesponsiveness, and neuroendocrine/metabolic dysfunction of human congenital leptin deficiency. J Clin Invest 110: 1093–1103.
17. Licinio J, Caglayan S, Ozata M, Yildiz BO, de Miranda PB, et al. (2004) Phenotypic effects of leptin replacement on morbid obesity, diabetes mellitus, hypogonadism, and behavior in leptin-deficient adults. Proc Natl Acad Sci U S A 101: 4531–4536.
18. Lindstro¨m P (2007) The physiology of obese-hyperglycemic mice [ob/ob mice]. ScientificWorldJournal 7: 666–685.
19. Gat-Yablonski G, Ben-Ari T, Shtaif B, Potievsky O, Moran O, et al. (2004) Leptin reverses the inhibitory effect of caloric restriction on longitudinal growth. Endocrinology 145: 343–350.
20. Halaas JL, Gajiwala KS, Maffei M, Cohen SL, Chait BT, et al. (1995) Weight-reducing effects of the plasma protein encoded by the obese gene. Science 269: 543–546.
21. Lalonde J, Samson P, Poulin S, Deshaies Y, Richard D (2004) Additive effects of leptin and topiramate in reducing fat deposition in lean and obese ob/ob mice. Physiol Behav 80: 415–420.
22. Doshi M, Takiue Y, Saito H, Hosoyamada M (2011) The increased protein level of URAT1 was observed in obesity/metabolic syndrome model mice. Nucleosides Nucleotides Nucleic Acids 30: 1290–1294.
23. Matsusue K, Kusakabe T, Noguchi T, Takiguchi S, Suzuki T, et al. (2008) Hepatic steatosis in leptin-deficient mice is promoted by the PPARgamma target gene Fsp27. Cell Metab 7: 302–311.
24. Naveilhan P, Svensson L, Nystrom S, Ekstrand AJ, Ernfors P (2002) Attenuation of hypercholesterolemia and hyperglycemia in ob/ob mice by NPY Y2 receptor ablation. Peptides 23: 1087–1091.
25. Lee YS, Cha BY, Saito K, Yamakawa H, Choi SS, et al. (2010) Nobiletin improves hyperglycemia and insulin resistance in obese diabetic ob/ob mice. Biochem Pharmacol 79: 1674–1683.
26. Tabbi-Anneni I, Buchanan J, Cooksey RC, Abel ED (2008) Captopril normalizes insulin signaling and insulin-regulated substrate metabolism in obese (ob/ob) mouse hearts. Endocrinology 149: 4043–4050.
27. Medina-Gomez G, Gray SL, Yetukuri L, Shimomura K, Virtue S, et al. (2007) PPAR gamma 2 prevents lipotoxicity by controlling adipose tissue expandability and peripheral lipid metabolism. PLoS Genet 3: e64.
28. Loos RJ (2012) Genetic determinants of common obesity and their value in prediction. Best Pract Res Clin Endocrinol Metab 26: 211–226.
29. Frayling TM, Timpson NJ, Weedon MN, Zeggini E, Freathy RM, et al. (2007) A common variant in the FTO gene is associated with body mass index and predisposes to childhood and adult obesity. Science 316: 889–894.
30. Do R, Bailey SD, Desbiens K, Belisle A, Montpetit A, et al. (2008) Genetic variants of FTO influence adiposity, insulin sensitivity, leptin levels, and resting metabolic rate in the Quebec Family Study. Diabetes 57: 1147–1150. 31. Legry V, Cottel D, Ferrieres J, Arveiler D, Andrieux N, et al. (2009) Effect of an
FTO polymorphism on fat mass, obesity, and type 2 diabetes mellitus in the French MONICA Study. Metabolism 58: 971–975.
32. Haupt A, Thamer C, Staiger H, Tschritter O, Kirchhoff K, et al. (2009) Variation in the FTO gene influences food intake but not energy expenditure. Exp Clin Endocrinol Diabetes 117: 194–197.
33. Wang P, Yang FJ, Du H, Guan YF, Xu TY, et al. (2011) Involvement of leptin receptor long isoform (LepRb)-STAT3 signaling pathway in brain fat mass- and obesity-associated (FTO) downregulation during energy restriction. Mol Med 17: 523–532.
34. Stratigopoulos G, LeDuc CA, Cremona ML, Chung WK, Leibel RL (2011) Cut-like homeobox 1 (CUX1) regulates expression of the fat mass and obesity-associated and retinitis pigmentosa GTPase regulator-interacting protein-1-like (RPGRIP1L) genes and coordinates leptin receptor signaling. J Biol Chem 286: 2155–2170.
35. McMurray F, Church CD, Larder R, Nicholson G, Wells S, et al. (2013) Adult onset global loss of the fto gene alters body composition and metabolism in the mouse. PLoS Genet 9: e1003166.
36. Fischer J, Koch L, Emmerling C, Vierkotten J, Peters T, et al. (2009) Inactivation of the Fto gene protects from obesity. Nature 458: 894–898. 37. Tews D, Fischer-Posovszky P, Fromme T, Klingenspor M, Fischer J, et al. (2013)
FTO deficiency induces UCP-1 expression and mitochondrial uncoupling in adipocytes. Endocrinology 154: 3141–3151.
38. Gao X, Shin YH, Li M, Wang F, Tong Q, et al. (2010) The fat mass and obesity associated gene FTO functions in the brain to regulate postnatal growth in mice. PLoS One 5: e14005.
40. Morton GJ, Matsen ME, Bracy DP, Meek TH, Nguyen HT, et al. (2013) FGF19 action in the brain induces insulin-independent glucose lowering. J Clin Invest [Epub ahead of print].
41. Lehrke M, Lazar MA (2005) The many faces of PPARgamma. Cell 123: 993– 999.
42. de Luis DA, Aller R, Conde R, Izaola O, de la Fuente B, et al. (2013) Relation of the rs9939609 gene variant in FTO with metabolic syndrome in obese female patients. J Diabetes Complications 27: 346–350.
43. Wang H, Dong S, Xu H, Qian J, Yang J (2012) Genetic variants in FTO associated with metabolic syndrome: a meta- and gene-based analysis. Mol Biol Rep 39: 5691–5698.
44. Chen B, Ye F, Yu L, Jia G, Huang X, et al. (2012) Development of cell-active N6-methyladenosine RNA demethylase FTO inhibitor. J Am Chem Soc 134: 17963–17971.
45. Gulati P, Yeo GS (2013) The biology of FTO: from nucleic acid demethylase to amino acid sensor. Diabetologia: [Epub ahead of print].
46. Aik W, Demetriades M, Hamdan MK, Bagg EA, Yeoh KK, et al. (2013) Structural Basis for Inhibition of the Fat Mass and Obesity Associated Protein (FTO). J Med Chem 56: 3680–3688.
FTO and the Metabolic Syndrome