ISSN 1414-431X
www.bjournal.com.br
www.bjournal.com.br
Volume 45 (12) 1102-1340 December 2012
Braz J Med Biol Res, December 2012, Volume 45(12) 1119-1126
doi:
10.1590/S0100-879X2012007500134
Genetic association of SNPs in the
FTO
gene and predisposition to
obesity in Malaysian Malays
Y.D. Apalasamy, M.F. Ming, S. Rampal, A. Bulgiba and Z. Mohamed
Institutional Sponsors
The Brazilian Journal of Medical and Biological Research is partially financed by
Faculdade de Medicina de Ribeirão Preto Campus
Ribeirão Preto
Explore High - Performance MS Orbitrap Technology In Proteomics & Metabolomics
analiticaweb.com.br S C I E N T I F I C
BIOMEDICAL SCIENCES
AND
Genetic association of SNPs in the
FTO
gene and
predisposition to obesity in Malaysian Malays
Y.D. Apalasamy
1, M.F. Ming
2, S. Rampal
2, A. Bulgiba
2and Z. Mohamed
11Pharmacogenomics Laboratory, Department of Pharmacology, Faculty of Medicine,
University of Malaya, Kuala Lumpur, Malaysia
2Julius Centre University of Malaya, Department of Social and Preventive Medicine,
Faculty of Medicine, University of Malaya, Kuala Lumpur, Malaysia
Abstract
The common variants in the fat mass- and obesity-associated (FTO) gene have been previously found to be associated with obesity in various adult populations. The objective of the present study was to investigate whether the single nucleotide polymorphisms (SNPs) and linkage disequilibrium (LD) blocks in various regions of the FTO gene are associated with predisposition to obesity in Malaysian Malays. Thirty-one FTO SNPs were genotyped in 587 (158 obese and 429 non-obese) Malaysian Malay subjects. Obesity traits and lipid profiles were measured and single-marker association testing, LD testing, and haplotype association analysis were performed. LD analysis of the FTO SNPs revealed the presence of 57 regions with complete LD (D’ = 1.0). In addition, we detected the association of rs17817288 with low-density lipoprotein cholesterol. The FTO gene may therefore be involved in lipid metabolism in Malaysian Malays. Two haplotype blocks were present in this region of the FTO gene, but no particular haplotype was found to be significantly associated with an increased risk of obesity in Malaysian Malays.
Key words: FTO gene; SNP; Obesity; Linkage disequilibrium; Haplotypes
Introduction
Correspondence: Y.D. Apalasamy, Department of Pharmacology, Faculty of Medicine, University of Malaya, 50603 Kuala Lumpur, Malaysia. E-mail: [email protected]
Received May 22, 2012. Accepted August 9, 2012. Available online August 24, 2012. Published December 17, 2012.
The World Health Organization (WHO) defines overweight
as a body mass index (BMI) of >25 kg/m2 and obesity as
a BMI of >30 kg/m2. The WHO has reported that, globally,
overweight and obesity represent the fifth leading risk for
death; furthermore, 44% of the diabetes burden, 23% of the ischemic heart disease burden, and between 7 and 41% of certain cancer burdens are related to overweight and obesity. Obesity is a complex disorder, with genetic and non-genetic factors playing crucial roles in an individual’s predisposition to it. Many recent studies, including genome-wide association studies (GWAS), have reported that single nucleotide poly-morphisms (SNPs) are associated with obesity-related traits in various populations (1-5).
FTO gene variants have been widely studied for their
association with obesity. Frayling et al. (1) first discovered in
a GWAS that the rs9939609 variant of FTO, with clusters of
SNPs in the first intron, was strongly associated with BMI in the UK population. Following this finding, an association be
-tween FTO SNPs and obesity traits was detected in people of
European ancestry (2), Sardinians (6), and African Americans (7), as well as in a Belgian cohort (8), East Asian population (9), Japanese population (10,11), a Sorbian population in
Ger-many (12), a Chinese population in Beijing (13), in an Indian population (14), and many other populations. Compared with
other FTO variants, rs9939609 showed the strongest effect
on BMI in these studies.
FTO is expressed in the hypothalamus, a region that is
crucial for the control of appetitive behavior (15,16). Animal
studies have shown that FTO has an effect on energy
homeo-stasis (17), but the true physiological role of FTO is yet to be
explored (18). Although initial reports on FTO stated that the
functions and pathways linked to the FTO gene are largely
unknown (1), structural analysis of FTO has revealed that it
be-longs to members of the non-heme 2-oxoglutarate-dependent oxygenase superfamily, which are involved in post-translational
modification, DNA repair, and fatty acid metabolism (19,20).
Recent studies have suggested that FTO may play an important
role in adipogenesis, lipogenesis, and mitochondrial function in skeletal muscle (21,22).
In the current study, our objective was to examine the effects
of FTO SNPs on obesity-related traits and to study the linkage
disequilibrium (LD) pattern and haplotype block in the Malaysian
Malays. To accomplish this, we genotyped 31 SNPs on the FTO
1120 Y.D. Apalasamy et al.
Subjects and Methods
Subjects
The participants were 587 subjects from the Wellness Program of a public university in Kuala Lumpur, an annual voluntary health screening program for the staff, as well as from a community of the Bera district of Pahang, a State on the east coast of Peninsular Malaysia. All subjects reported that they belonged to the Malay ethnic group for at least three generations. In accordance with the WHO
cutoffs for obesity, subjects with a BMI of 30 kg/m2were
categorized as obese and those with a BMI below 30 kg/m2
as non-obese. The Medical Ethics Committee (MEC Ref. No. 672.23) of the university Medical Center approved the study protocol and written informed consent was obtained from all participants.
Clinical measurements
Anthropometric measurements such as height, body weight, BMI, waist circumference, hip circumference, waist-to-hip ratio, systolic blood pressure, and diastolic blood pressure were recorded. After an overnight fast, 10 to 15 mL blood was collected from each subject for routine biochemical measurements. Total cholesterol, total triglycer-ide, high-density lipoprotein cholesterol, serum low-density lipoprotein cholesterol (LDL-C), and triglyceride levels were measured using standard clinical laboratory techniques.
DNA isolation from human buccal swabs
Buccal swabs were collected and genomic DNA was obtained by using the i-genomic CTB DNA extraction kit (iNtRON Biotechnology, Korea). This extraction procedure consists of six main steps:
prelysis, lysis, precipitation, DNA binding, washing, and elution with buffers, protei-nase K, and RNase A.
DNA measurement
The concentration and purity of DNA was mea-sured using a Nanodrop spectrophotometer to de-termine absorbance at wavelengths of 260 and 280 nm and by agarose gel electrophoresis.
Sequenom MassARRAY®
iPLEX Platform (MALDI-TOF)
Genotyping of 31 SNPs of the FTO gene was per-formed with the Sequenom MassARRAY platform
(Se-quenom, USA). The variants were selected from informa-tion provided by previous GWAS and associainforma-tion studies in various populations.
Statistical analysis
Hardy-Weinberg equilibrium (HWE) was determined in both cases and controls (23) and genotype and allelic frequencies were also determined in cases and controls. Prior to statistical analysis, BMI and triglyceride data were normalized by natural log transformation. The general linear method was used to adjust for age and gender when as-sessing the effects of SNPs on obesity parameters and lipid levels. The results of association analysis for the SNPs and obesity parameters indicated that the additive model best
fitted the data. Data are reported as means ± SD. Bonfer -roni’s adjustment was performed to correct for multiple tests
on multiple markers (α = 0.05/30). Statistical analysis was
performed using the SPSS version 16 software.
LD block construction and haplotype analysis were performed with the Haploview software (version 4.2) to
measure the LD coefficient (D’). A permutation test with
5000 replications was used to obtain empirical levels of
significance. Adjustment for multiple testing was performed
by obtaining P values from the permutation test with the Haploview software. The power of the study, calculated using the Quanto version 1.2.4 software, was 87%.
Results
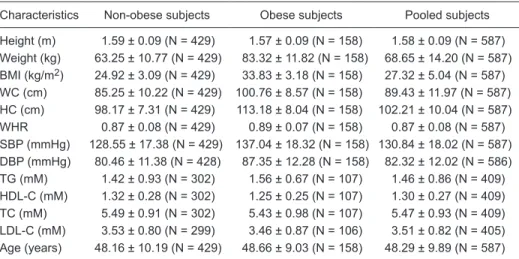
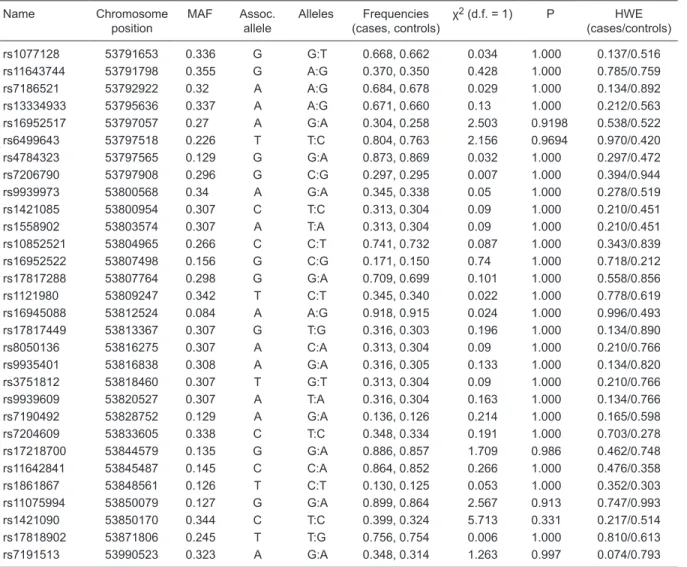
Table 1 shows the characteristics of the 587 subjects who participated in the study. The allele frequencies of 30
SNPs in the FTO gene are summarized in Table 2. The FTO
Table 1. Characteristics of the subjects in this study.
Characteristics Non-obese subjects Obese subjects Pooled subjects
Height (m) 1.59 ± 0.09 (N = 429) 1.57 ± 0.09 (N = 158) 1.58 ± 0.09 (N = 587) Weight (kg) 63.25 ± 10.77 (N = 429) 83.32 ± 11.82 (N = 158) 68.65 ± 14.20 (N = 587) BMI (kg/m2) 24.92 ± 3.09 (N = 429) 33.83 ± 3.18 (N = 158) 27.32 ± 5.04 (N = 587)
WC (cm) 85.25 ± 10.22 (N = 429) 100.76 ± 8.57 (N = 158) 89.43 ± 11.97 (N = 587) HC (cm) 98.17 ± 7.31 (N = 429) 113.18 ± 8.04 (N = 158) 102.21 ± 10.04 (N = 587) WHR 0.87 ± 0.08 (N = 429) 0.89 ± 0.07 (N = 158) 0.87 ± 0.08 (N = 587) SBP (mmHg) 128.55 ± 17.38 (N = 429) 137.04 ± 18.32 (N = 158) 130.84 ± 18.02 (N = 587) DBP (mmHg) 80.46 ± 11.38 (N = 428) 87.35 ± 12.28 (N = 158) 82.32 ± 12.02 (N = 586) TG (mM) 1.42 ± 0.93 (N = 302) 1.56 ± 0.67 (N = 107) 1.46 ± 0.86 (N = 409) HDL-C (mM) 1.32 ± 0.28 (N = 302) 1.25 ± 0.25 (N = 107) 1.30 ± 0.27 (N = 409) TC (mM) 5.49 ± 0.91 (N = 302) 5.43 ± 0.98 (N = 107) 5.47 ± 0.93 (N = 409) LDL-C (mM) 3.53 ± 0.80 (N = 299) 3.46 ± 0.87 (N = 106) 3.51 ± 0.82 (N = 405) Age (years) 48.16 ± 10.19 (N = 429) 48.66 ± 9.03 (N = 158) 48.29 ± 9.89 (N = 587)
rs1861869 SNP deviated from Hardy-Weinberg equilibrium (HWE case/control = 0.863/0.025) and was therefore not included in the analysis. After Bonferroni’s correction and a permutation test with 5000 replications for the 30 SNPs,
there was no significant difference in allelic frequency for
any of the FTO SNPs between the obese and non-obese
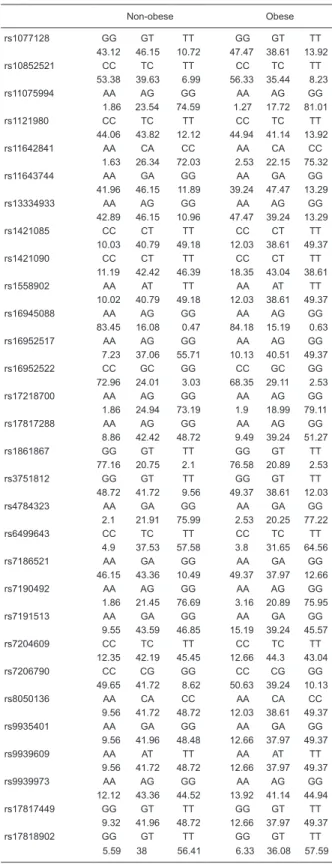
groups. Table 3 shows the genotype frequencies of all FTO
SNPs. There was no significant difference in genotype
frequency for any of the FTO SNPs between the obese
and non-obese groups.
The results of testing the single-marker association
of 30 FTO SNPs with obesity traits are summarized in
Figure 1. After Bonferroni’s adjustment was performed for
multiple corrections, α was 0.016 (-log10 P = 2.70). The SNP rs17817288 was significantly associated with LDL-C
(P = 0.001) in Malaysian Malays after adjustment for age
and gender. None of other SNPs presented a significant
association with obesity parameters.
Figure 2 shows the LD pattern of the FTO gene. D prime
value (D’) of 100% indicates the complete LD. D’ values of 100% are not shown (the box is empty). The boxes in bright red are with D’ values of 100%. The boxes with values of D’ < 100% are in shades of pink or red. When we examined
the LD of the FTO region, we found two haplotype blocks
of 1 and 44 kb. The strongest LD was seen in the second block, which showed 48 regions with complete LD and 69 regions with high LD (D’ = 80-99%).
There are 11 haplotypes in the region of the FTO gene.
Table 4 shows the first and second blocks of the FTO hap-lotypes. The GA, AA, and AG haplotypes in block 1 showed
Table 2. Allelic distribution among obese and non-obese subjects.
Name Chromosome position
MAF Assoc. allele
Alleles Frequencies (cases, controls)
χ2 (d.f. = 1) P HWE
(cases/controls)
rs1077128 53791653 0.336 G G:T 0.668, 0.662 0.034 1.000 0.137/0.516 rs11643744 53791798 0.355 G A:G 0.370, 0.350 0.428 1.000 0.785/0.759 rs7186521 53792922 0.32 A A:G 0.684, 0.678 0.029 1.000 0.134/0.892 rs13334933 53795636 0.337 A A:G 0.671, 0.660 0.13 1.000 0.212/0.563 rs16952517 53797057 0.27 A G:A 0.304, 0.258 2.503 0.9198 0.538/0.522 rs6499643 53797518 0.226 T T:C 0.804, 0.763 2.156 0.9694 0.970/0.420 rs4784323 53797565 0.129 G G:A 0.873, 0.869 0.032 1.000 0.297/0.472 rs7206790 53797908 0.296 G C:G 0.297, 0.295 0.007 1.000 0.394/0.944 rs9939973 53800568 0.34 A G:A 0.345, 0.338 0.05 1.000 0.278/0.519 rs1421085 53800954 0.307 C T:C 0.313, 0.304 0.09 1.000 0.210/0.451 rs1558902 53803574 0.307 A T:A 0.313, 0.304 0.09 1.000 0.210/0.451 rs10852521 53804965 0.266 C C:T 0.741, 0.732 0.087 1.000 0.343/0.839 rs16952522 53807498 0.156 G C:G 0.171, 0.150 0.74 1.000 0.718/0.212 rs17817288 53807764 0.298 G G:A 0.709, 0.699 0.101 1.000 0.558/0.856 rs1121980 53809247 0.342 T C:T 0.345, 0.340 0.022 1.000 0.778/0.619 rs16945088 53812524 0.084 A A:G 0.918, 0.915 0.024 1.000 0.996/0.493 rs17817449 53813367 0.307 G T:G 0.316, 0.303 0.196 1.000 0.134/0.890 rs8050136 53816275 0.307 A C:A 0.313, 0.304 0.09 1.000 0.210/0.766 rs9935401 53816838 0.308 A G:A 0.316, 0.305 0.133 1.000 0.134/0.820 rs3751812 53818460 0.307 T G:T 0.313, 0.304 0.09 1.000 0.210/0.766 rs9939609 53820527 0.307 A T:A 0.316, 0.304 0.163 1.000 0.134/0.766 rs7190492 53828752 0.129 A G:A 0.136, 0.126 0.214 1.000 0.165/0.598 rs7204609 53833605 0.338 C T:C 0.348, 0.334 0.191 1.000 0.703/0.278 rs17218700 53844579 0.135 G G:A 0.886, 0.857 1.709 0.986 0.462/0.748 rs11642841 53845487 0.145 C C:A 0.864, 0.852 0.266 1.000 0.476/0.358 rs1861867 53848561 0.126 T C:T 0.130, 0.125 0.053 1.000 0.352/0.303 rs11075994 53850079 0.127 G G:A 0.899, 0.864 2.567 0.913 0.747/0.993 rs1421090 53850170 0.344 C T:C 0.399, 0.324 5.713 0.331 0.217/0.514 rs17818902 53871806 0.245 T T:G 0.756, 0.754 0.006 1.000 0.810/0.613 rs7191513 53990523 0.323 A G:A 0.348, 0.314 1.263 0.997 0.074/0.793
1122 Y.D. Apalasamy et al.
frequencies of 36, 33, and 32%, respectively. In block 2, the TTCCGCATCGGTGCGC, CACCGTAGAATAGTGA, CACGGTAGAATAGTGC, TTTCACATCGGTGTAC, TTTCACATCGGTATGC, and TTCCGCGTCGGTGTGC haplotypes had frequencies of 32, 14, 14, 13, 12, and 5%, respectively. The TTCCATGTCGGTGTGC and CACC GTAGAATAGTGC haplotypes had lower frequencies
(<5%). There were no significant differences in haplotype
frequencies between obese and non-obese subjects. After permutation test correction with 5000 permutations, none of the haplotypes was associated with obesity.
Discussion
There were no significant differences in allelic or geno
-type frequencies of the 30 FTO SNPs between the obese
and non-obese groups in the Malaysian Malay population.
Recent studies have pointed out that the SNPs in the FTO
gene contribute to obesity and obesity-related traits in various populations around the globe (1,3,24-27).
Single-marker analysis revealed that rs17817288 was significantly
associated with LDL-C levels (P = 0.001) in Malaysian Malays. A recent study (22) showed that, as a
transcrip-tional coactivator, FTO might play an important role in the
transcriptional regulation of adipogenesis and suggested
that FTO might be involved in the regulation of fat
develop-ment and maintenance. Therefore, we speculated that the
FTO rs17817288 SNP may have an effect on adipogenesis
in Malaysian Malays, which is consistent with findings by
Wu et al. (22) concerning the functional effects of the FTO
gene. The FTO rs9939609 SNP was chosen as
representa-tive of FTO SNPs in the present study because this locus
was highlighted in many studies as having the strongest
effect on obesity; it was also the key signal identified in the
GWAS (1). A meta-analysis reported that 21 of 29 studies
have shown a significant association between obesity and
rs9939609 (5). However, this SNP had no effect on obesity in the Malaysian Malay population.
A meta-analysis reported that the minor allele frequency (MAF) for rs9939609 varies across the global population.
The MAF of the FTO rs9939609 polymorphism was lower
(0.31) in the Malaysian Malay population compared to the previously reported range of 0.38 to 0.46 in European populations (1,8,28). For example, the MAF was 0.31 to 0.37 in Hispanics, 0.34 to 0.44 in Caucasians, 0.17 in South Americans, 0.36 in Africans, 0.11 to 0.20 in Asians, 0.25 in Singaporean Malays, 0.13 in Singaporean Chinese, and 0.42 in Singaporean Indians (5,29,30). In addition, the MAF for rs1421085, rs1558902, rs17817449, rs3751812, rs9939609, and rs8050136 was similar across these six SNPs. The MAF for the SNPs is 0.31.
We investigated the LD structure of the FTO SNPs in
Malaysian Malays. Linkage analysis showed 57 regions with
complete LD in the FTO gene. Our results showed that 15
of the 30 FTO SNPs (50%) are in high LD (D ≥ 0.88) with
Table 3. Genotype distribution among obese and non-obese subjects.
Non-obese Obese
rs1077128 GG GT TT GG GT TT
43.12 46.15 10.72 47.47 38.61 13.92
rs10852521 CC TC TT CC TC TT
53.38 39.63 6.99 56.33 35.44 8.23
rs11075994 AA AG GG AA AG GG
1.86 23.54 74.59 1.27 17.72 81.01
rs1121980 CC TC TT CC TC TT
44.06 43.82 12.12 44.94 41.14 13.92
rs11642841 AA CA CC AA CA CC
1.63 26.34 72.03 2.53 22.15 75.32
rs11643744 AA GA GG AA GA GG
41.96 46.15 11.89 39.24 47.47 13.29
rs13334933 AA AG GG AA AG GG
42.89 46.15 10.96 47.47 39.24 13.29
rs1421085 CC CT TT CC CT TT
10.03 40.79 49.18 12.03 38.61 49.37
rs1421090 CC CT TT CC CT TT
11.19 42.42 46.39 18.35 43.04 38.61
rs1558902 AA AT TT AA AT TT
10.02 40.79 49.18 12.03 38.61 49.37
rs16945088 AA AG GG AA AG GG
83.45 16.08 0.47 84.18 15.19 0.63
rs16952517 AA AG GG AA AG GG
7.23 37.06 55.71 10.13 40.51 49.37
rs16952522 CC GC GG CC GC GG
72.96 24.01 3.03 68.35 29.11 2.53
rs17218700 AA AG GG AA AG GG
1.86 24.94 73.19 1.9 18.99 79.11
rs17817288 AA AG GG AA AG GG
8.86 42.42 48.72 9.49 39.24 51.27
rs1861867 GG GT TT GG GT TT
77.16 20.75 2.1 76.58 20.89 2.53
rs3751812 GG GT TT GG GT TT
48.72 41.72 9.56 49.37 38.61 12.03
rs4784323 AA GA GG AA GA GG
2.1 21.91 75.99 2.53 20.25 77.22
rs6499643 CC TC TT CC TC TT
4.9 37.53 57.58 3.8 31.65 64.56
rs7186521 AA GA GG AA GA GG
46.15 43.36 10.49 49.37 37.97 12.66
rs7190492 AA AG GG AA AG GG
1.86 21.45 76.69 3.16 20.89 75.95
rs7191513 AA GA GG AA GA GG
9.55 43.59 46.85 15.19 39.24 45.57
rs7204609 CC TC TT CC TC TT
12.35 42.19 45.45 12.66 44.3 43.04
rs7206790 CC CG GG CC CG GG
49.65 41.72 8.62 50.63 39.24 10.13
rs8050136 AA CA CC AA CA CC
9.56 41.72 48.72 12.03 38.61 49.37
rs9935401 AA GA GG AA GA GG
9.56 41.96 48.48 12.66 37.97 49.37
rs9939609 AA AT TT AA AT TT
9.56 41.72 48.72 12.66 37.97 49.37
rs9939973 AA AG GG AA AG GG
12.12 43.36 44.52 13.92 41.14 44.94
rs17817449 GG GT TT GG GT TT
9.32 41.96 48.72 12.66 37.97 49.37
rs17818902 GG GT TT GG GT TT
5.59 38 56.41 6.33 36.08 57.59
rs9939609. This indicates that the FTO SNPs in the first
intron of the FTO gene are high in LD in Malaysian Malays.
In our samples, three SNPs, rs9935401, rs16945088, and rs10852521 (D’ = 1.0), were in complete LD with rs9939609. In the HapMap sample of Utah residents with ancestry from northern and western Europe (CEU), the three SNPs rs10852521, rs16945088, and rs9935401 are in complete LD (D’ = 1.0) with rs9939609, as observed in our sample of Malaysian Malays. In contrast, in the HapMap sample of Yoruba in Ibadan, Nigeria (YRI), the rs9939609 at rs10852521 is not in strong LD (D’ = 0.48). Complete LD (D = 1.0) with rs9939609 at rs16945088 and at rs17817449 has been shown in HapMap samples of African ancestry in Southwest USA (ASW); Utah residents with northern and western European ancestry (CEU); Han Chinese in Beijing, China (CHB); Chinese in Metropolitan Denver, Colorado (CHD); Gujarati Indians in Houston, Texas (GIH); Japanese in Tokyo, Japan (JPT); Luhya in Webuye, Kenya (LWK); Mexican ancestry in Los Angeles, California (MEX); Tuscans
in Italy (TSI), and Yoruba in Ibadan, Nigeria (YRI). A similar LD strength was observed in our samples of Malaysian Malays. Interestingly, results from HapMap samples show that rs9939609 is in complete LD with rs10852521 with samples from Asia (JPT, CHD, and CHB), which was also replicated in our samples of Malaysian Malays. In contrast, the strength of LD of rs9939609 at rs10852521 is reduced in samples of African ancestry such as YRI, ASW, LWK, and Maasai in Kinyawa, Kenya (MKK; D > 0.35) (31).
The Singaporean Genome Variation Project analyzed the LD in 98 Singaporean Malays (MAS) with the Affy-metric Genome-Wide Human SNP Array and the Illumina Human1M single-sample BeadChip genotyping platforms (29). In our study, we found that the LD pattern of all regions with complete LD in Malaysian Malays was similar to the MAS samples except for rs17218700 and rs7190492. The LD of rs17218700 with rs7190492 was lower in the MAS samples (D’ = 0.74) compared with those in our study. By
using the Sequenom MassARRAY®iPLEX platform with a
1124 Y.D. Apalasamy et al.
much larger sample size (N = 587), we found that the LD pat-tern from our own data for Malaysian Malays is very similar to that of the MAS samples. Therefore, we can predict a
similar pattern of LD in the FTO gene ancestry of Malays
in Southeast Asia because of the genetic homogeneity. Further studies will be needed to address this pattern in Malays in other parts of Southeast Asia.
Differences exist in the LD structure of the FTO
gene in diverse ethnic populations (5). For example, previ-ous studies have shown that the degree of LD in a popula-tion with African ancestry is lower than that in European populations (32). Recent studies have reported that the
genetic variability in the FTO gene that is in high LD are
associated with a risk of obesity in Spanish (33) and African Americans (27). Our study showed novel patterns of LD in
the FTO gene ancestry of Malaysian Malays.
Most FTO haplotypes were found to have frequencies
of more than 5% in Malaysian Malays. We identified major
haplotypes in people of Malaysian Malay ancestry that may also be present in Malays in other parts of Southeast Asia. Studies of different populations will be needed, however,
to confirm this finding. The haplotypes in block 1 and block
2 of the FTO gene were not associated with obesity in
Malaysian Malays.
Previous studies on the association of the FTO gene
with obesity included between 240 and 5380 subjects from populations across the globe (5). Although the sample investigated in the present study was of moderate size in
comparison with other studies, this study was sufficiently
Figure 2. Linkage disequilibrium pattern of FTO single nucleotide polymorphisms. D prime value (D’) of 100% indicates the complete LD. D’ values of 100% are not shown (the box is empty). The boxes in bright red are with D’ values of 100%. The boxes with values of D’ < 100% are in shades of pink or red.
Table 4. Haplotype analysis of the FTO gene.
Haplotype Frequency Frequencies (cases, controls)
Block 1
GA 0.355 0.370, 0.350
AA 0.325 0.313, 0.329
AG 0.32 0.316, 0.322
Block 2
TTCCGCATCGGTGCGC 0.324 0.330, 0.324 CACCGTAGAATAGTGA 0.139 0.130, 0.144 CACGGTAGAATAGTGC 0.138 0.152, 0.134 TTTCACATCGGTGTAC 0.131 0.114, 0.138 TTTCACATCGGTATGC 0.123 0.133, 0.121 TTCCGCGTCGGTGTGC 0.053 0.054, 0.053 TTCCATGTCGGTGTGC 0.032 0.029, 0.033 CACCGTAGAATAGTGC 0.022 0.026, 0.021
powered with the population of Malaysian Malays. Since the participants of this study are middle-aged and elderly
individuals, these findings cannot be generally extrapolated
to children and adolescents in Malaysia. This study was conducted in Malaysian Malays, and we cannot
general-ize these findings to overall Malaysian populations such
as Chinese, Indians and other ethnic groups in Malaysia.
Therefore, large-scale genetic association studies on FTO
should be carried out in future in other ethnic groups within the Malaysian population.
To the best of our knowledge, this is the first study on
genetic variants in the FTO gene in Malaysian Malays. We
conclude that the genetic variations in the FTO gene are in
high LD in this ethnic group. Two haplotype blocks of FTO
were identified, neither of which confers an increased risk
for obesity in this population. We detected the association of rs17817288 with LDL-C, and this SNP may be involved in lipid metabolism in Malaysian Malays. Replication of this association in larger samples and in functional molecular
studies will further increase the validity of this association
and the causative relationship between the FTO variant
and LDL-C.
Acknowledgments
We are grateful to the Wellness Program team of the University of Malaya, Malaysia, the medical students who assisted in data collection, and all the participants in this study. Further thanks go to Associate Professor Agus Salim (National University of Singapore), Professor Rosmawati Mohamed (University of Malaya), Dr. Batoul Saadat Haerian (University of Malaya), Ms. Devi Peramalah (University of Malaya), Sim Maw Shin (University of Malaya), and Shamsul Mohd Zain (University of Malaya) for advising and helping with data analysis. Research supported by University of Malaya (#RG075-09HTM, #PS383-2009B) and HIR-MOHE (#E000049-20001).
References
1. Frayling TM, Timpson NJ, Weedon MN, Zeggini E, Freathy RM, Lindgren CM, et al. A common variant in the FTO gene is associated with body mass index and predisposes to childhood and adult obesity. Science 2007; 316: 889-894. 2. Dina C, Meyre D, Gallina S, Durand E, Korner A, Jacobson
P, et al. Variation in FTO contributes to childhood obesity and severe adult obesity. Nat Genet 2007; 39: 724-726. 3. Zhang G, Karns R, Narancic NS, Sun G, Cheng H, Missoni
S, et al. Common SNPs in FTO gene are associated with obesity related anthropometric traits in an island population from the eastern Adriatic coast of Croatia. PLoS One 2010; 5: e10375.
4. Apalasamy YD, Ming MF, Rampal S, Bulgiba A, Mohamed Z. Gender-dependent association of a beta2-adrenergic gene variant with obesity parameters in Malaysian Malays. Asia Pac J Public Health 2011 [ahead of print].
5. Peng S, Zhu Y, Xu F, Ren X, Li X, Lai M. FTO gene polymor-phisms and obesity risk: a meta-analysis. BMC Med 2011; 9: 71.
6. Scuteri A, Sanna S, Chen WM, Uda M, Albai G, Strait J, et al. Genome-wide association scan shows genetic variants in the FTO gene are associated with obesity-related traits. PLoS Genet 2007; 3: e115.
7. Wing MR, Ziegler J, Langefeld CD, Ng MC, Haffner SM, Nor-ris JM, et al. Analysis of FTO gene variants with measures of obesity and glucose homeostasis in the IRAS Family Study. Hum Genet 2009; 125: 615-626.
8. Peeters A, Beckers S, Verrijken A, Roevens P, Peeters P, Van Gaal L, et al. Variants in the FTO gene are associated with common obesity in the Belgian population. Mol Genet Metab 2008; 93: 481-484.
9. Deka R, Xu L, Pal P, Toelupe PT, Laumoli TS, Xi H, et al. A tagging SNP in INSIG2 is associated with obesity-related phenotypes among Samoans. BMC Med Genet 2009; 10: 143.
10. Hotta K, Nakata Y, Matsuo T, Kamohara S, Kotani K,
Ko-matsu R, et al. Variations in the FTO gene are associated with severe obesity in the Japanese. J Hum Genet 2008; 53: 546-553.
11. Karasawa S, Daimon M, Sasaki S, Toriyama S, Oizumi T, Susa S, et al. Association of the common fat mass and obe-sity associated (FTO) gene polymorphism with obeobe-sity in a Japanese population. Endocr J 2010; 57: 293-301. 12. Tonjes A, Zeggini E, Kovacs P, Bottcher Y, Schleinitz D,
Dietrich K, et al. Association of FTO variants with BMI and fat mass in the self-contained population of Sorbs in Germany. Eur J Hum Genet 2010; 18: 104-110.
13. Xi B, Shen Y, Zhang M, Liu X, Zhao X, Wu L, et al. The common rs9939609 variant of the fat mass and obesity-associated gene is obesity-associated with obesity risk in children and adolescents of Beijing, China. BMC Med Genet 2010; 11: 107.
14. Chauhan G, Tabassum R, Mahajan A, Dwivedi OP, Mahen-dran Y, Kaur I, et al. Common variants of FTO and the risk of obesity and type 2 diabetes in Indians. J Hum Genet 2011; 56: 720-726.
15. Stratigopoulos G, Padilla SL, LeDuc CA, Watson E, Hat-tersley AT, McCarthy MI, et al. Regulation of Fto/Ftm gene expression in mice and humans. Am J Physiol Regul Integr Comp Physiol 2008; 294: R1185-R1196.
16. Gerken T, Girard CA, Tung YC, Webby CJ, Saudek V, He-witson KS, et al. The obesity-associated FTO gene encodes a 2-oxoglutarate-dependent nucleic acid demethylase. Sci-ence 2007; 318: 1469-1472.
17. Fischer J, Koch L, Emmerling C, Vierkotten J, Peters T, Bruning JC, et al. Inactivation of the Fto gene protects from obesity. Nature 2009; 458: 894-898.
18. Larder R, Cheung MK, Tung YC, Yeo GS, Coll AP. Where to go with FTO? Trends Endocrinol Metab 2011; 22: 53-59. 19. Ozer A, Bruick RK. Non-heme dioxygenases: cellular
1126 Y.D. Apalasamy et al.
20. Clifton IJ, McDonough MA, Ehrismann D, Kershaw NJ, Gra-natino N, Schofield CJ. Structural studies on 2-oxoglutarate oxygenases and related double-stranded beta-helix fold proteins. J Inorg Biochem 2006; 100: 644-669.
21. Bravard A, Lefai E, Meugnier E, Pesenti S, Disse E, Vou-illarmet J, et al. FTO is increased in muscle during type 2 diabetes, and its overexpression in myotubes alters insulin signaling, enhances lipogenesis and ROS production, and induces mitochondrial dysfunction. Diabetes 2011; 60: 258-268.
22. Wu Q, Saunders RA, Szkudlarek-Mikho M, Serna IL, Chin KV. The obesity-associated Fto gene is a transcriptional coactivator. Biochem Biophys Res Commun 2010; 401: 390-395.
23. Rodriguez S, Gaunt TR, Day IN. Hardy-Weinberg equilib-rium testing of biological ascertainment for Mendelian ran-domization studies. Am J Epidemiol 2009; 169: 505-514. 24. Maes HH, Neale MC, Eaves LJ. Genetic and environmental
factors in relative body weight and human adiposity. Behav Genet 1997; 27: 325-351.
25. Hunt SC, Stone S, Xin Y, Scherer CA, Magness CL, Iadonato SP, et al. Association of the FTO gene with BMI. Obesity 2008; 16: 902-904.
26. Al-Attar SA, Pollex RL, Ban MR, Young TK, Bjerregaard P, Anand SS, et al. Association between the FTO rs9939609 polymorphism and the metabolic syndrome in a non-Cauca-sian multi-ethnic sample. Cardiovasc Diabetol 2008; 7: 5.
27. Hassanein MT, Lyon HN, Nguyen TT, Akylbekova EL, Wa-ters K, Lettre G, et al. Fine mapping of the association with obesity at the FTO locus in African-derived populations. Hum Mol Genet 2010; 19: 2907-2916.
28. Hinney A, Nguyen TT, Scherag A, Friedel S, Bronner G, Muller TD, et al. Genome wide association (GWA) study for early onset extreme obesity supports the role of fat mass and obesity associated gene (FTO) variants. PLoS One 2007; 2: e1361.
29. Teo YY, Sim X, Ong RT, Tan AK, Chen J, Tantoso E, et al. Singapore Genome Variation Project: a haplotype map of three Southeast Asian populations. Genome Res 2009; 19: 2154-2162.
30. Hennig BJ, Fulford AJ, Sirugo G, Rayco-Solon P, Hattersley AT, Frayling TM, et al. FTO gene variation and measures of body mass in an African population. BMC Med Genet 2009; 10: 21.
31. Frazer KA, Ballinger DG, Cox DR, Hinds DA, Stuve LL, Gibbs RA, et al. A second generation human haplotype map of over 3.1 million SNPs. Nature 2007; 449: 851-861. 32. Reich DE, Cargill M, Bolk S, Ireland J, Sabeti PC, Richter DJ,
et al. Linkage disequilibrium in the human genome. Nature 2001; 411: 199-204.