Common Variants of
FTO
Are Associated with Childhood
Obesity in a Cross-Sectional Study of 3,126 Urban Indian
Children
Om Prakash Dwivedi1., Rubina Tabassum1., Ganesh Chauhan1
, Saurabh Ghosh2, Raman K. Marwaha3,
Nikhil Tandon4*, Dwaipayan Bharadwaj1*
1Genomics and Molecular Medicine Unit, CSIR-Institute of Genomics and Integrative Biology, Delhi, India,2Human Genetics Unit, Indian Statistical Institute, Kolkata, India,3Department of Endocrinology and Thyroid Research, Institute of Nuclear Medicine and Allied Sciences, Delhi, India,4Department of Endocrinology, All India Institute of Medical Sciences, New Delhi, India
Abstract
Background:FTOvariants are robustly associated with obesity and related traits in many population and shown to have variable impact during life course. Although studies have shown association ofFTOvariants with adiposity in adult Indian, its association in Indian children is yet to be confirmed.
Methods: Here we examined association of FTO variants (rs9939609 and rs8050136) with obesity and related anthropometric and biochemical traits in 3,126 Indian children (aged 11–17 years) including 2,230 normal-weight and 896 over-weight/obese children. We also compared effects observed in the present study with that observed in previous studies on South Asian adults and children of other ethnic groups.
Results:The variant rs9939609 showed significant association with risk of obesity [OR = 1.21,P= 2.561023] and its measures
BMI, weight, waist circumference and hip circumference [b range = 0.11 to 0.14 Z-score units; P range = 1.361024 to
1.661027] in children. The observed effect sizes in Indian children were similar to those reported for European children.
Variant rs9939609 explained 0.88% of BMI variance in Indian children. The effect sizes of rs9939609 on BMI and WC were,2 fold higher in children than adults. Interestingly rs9939609 was also associated with serum levels of thyroid stimulating hormone (TSH) [b= 0.10 Z-score, P= 5.861023]. The other variant rs8050136 was in strong linkage disequilibrium with
rs9939609 (r2= 0.97) and provided similar association results.
Conclusion:The study provides first report of association ofFTOvariants with obesity and related anthropometric traits in Indian children with higher impact in children compared to adults. We also demonstrated association ofFTOvariant with serum levels of TSH, indicating putative influence ofFTOin hypothalamic-pituitary-thyroid axis.
Citation:Dwivedi OP, Tabassum R, Chauhan G, Ghosh S, Marwaha RK, et al. (2012) Common Variants ofFTOAre Associated with Childhood Obesity in a Cross-Sectional Study of 3,126 Urban Indian Children. PLoS ONE 7(10): e47772. doi:10.1371/journal.pone.0047772
Editor:Balraj Mittal, Sanjay Gandhi Medical Institute, India
ReceivedJuly 13, 2012;AcceptedSeptember 17, 2012;PublishedOctober 16, 2012
Copyright:ß2012 Dwivedi et al. This is an open-access article distributed under the terms of the Creative Commons Attribution License, which permits unrestricted use, distribution, and reproduction in any medium, provided the original author and source are credited.
Funding:This study was supported by "Diabetes mellitus-New drug discovery R&D, molecular mechanisms and genetic & epidemiological factors" (NWP0032-OB4), funded by Council of Scientific and Industrial Research (CSIR), Government of India. RT received a postdoctoral fellowship from the Fogarty International Center and the Eunice Kennedy Shriver National Institute of Child Health and Human Development at the National Institutes of Health (1 D43 HD065249). The funders had no role in study design, data collection and analysis, decision to publish, or preparation of the manuscript.
Competing Interests:The authors have declared that no competing interest exist.
* E-mail: nikhil_tandon@hotmail.com (NT); db@igib.res.in (DB)
.These authors contributed equally to this work.
Introduction
Genome wide association studies (GWAS) have revolutionized the discovery of obesity-susceptibility loci at population level in last five years. Till date, at least 52 loci associated with obesity risk and obesity-related traits have been identified through GWAS [1]. Fat mass and obesity associated (FTO) gene was the first obesity associated locus implicated by GWAS [2,3]. Among all the GWAS-identified obesity associated loci, FTO variants have strongest influence on obesity and contribute maximally to the variance in body mass index (BMI) in Europeans (0.34%) and East Asians (0.18%) [4,5]. Since its discovery, association ofFTOlocus has been demonstrated in adults and children from different
ethnicities, not only with BMI but also with the risk of obesity, body fat percentage, waist circumference (WC) and other related traits [6].
The human genetic association studies ofFTOwith obesity are further supported by subsequent functional studies in animal models. In mice, loss of function and/or expression ofFtoleads to lean phenotype while its overexpression results in obesity [7,8]. Studies have shown that FTO functions as a demethylase and predominantly affect obesity by influencing energy intake [7–9].
compared to adulthood, while another study showed positive association of risk allele ofFTOvariant with BMI in childhood but a negative association during infancy [10,11]. As FTO variants have varied longitudinal effect, association studies across the age groups are essential to comprehensively evaluate its influence in modulating the risk of obesity in a population. Although association ofFTOvariants with adult obesity in Asian population has been confirmed by many studies, investigation of its effect on childhood obesity is limited particularly in South Asians [13–16]. Among South Asians only one study has examined association of FTOvariant with obesity during childhood from Southern part of
India and failed to detect any association at younger ages [12]. Here we examined two variants rs9939609 and rs8050136 from first intron ofFTO, which are most robustly implicated in obesity, for associations with obesity and related traits in 3,126 Indian children. We also compared their effects on obesity risk in Indian children with that in South Asian adults and children from other ethnic groups. The present study would enable us to understand influence ofFTO variants during early life in Indian population that are at higher risk to develop obesity in adult life.
Materials and Methods Ethics Statement
Prior informed written consent was obtained from parents/ guardians of the children while verbal consent from children themselves was taken. The study was approved by the Human Ethics Committee of CSIR-Institute of Genomics and Integrative Biology, the All India Institute of Medical Sciences Research
Ethics Committee and the Ethics Committee of the Institute of Nuclear Medicine and Allied Sciences. The study was conducted in accordance with the principles of Helsinki Declaration.
Subjects
The study included a total of 3,126 school children from both the sexes in the age group of 11–17 years. The children were recruited as a part of ongoing health survey of government and private schools located in four different geographical zones of Delhi (India), as described previously [17]. Using age and sex specific BMI cut-offs provided by International Obesity Task Force (IOTF), the recruited children were categorized as normal-weight (N = 2230) and over-normal-weight/obese (N = 896) [18].
Measurements
All the subjects were extensively characterized for various anthropometric and clinical traits as described previously [19,20]. Height, weight, WC and hip circumference (HC) were measured using standard methods. BMI and waist-to-hip ratio (WHR) were calculated using anthropometric measures. Fasting plasma levels of glucose, high sensitivity C-reactive protein (hsCRP), total choles-terol (TC), high density lipoprotein-cholescholes-terol (HDL-C), low density lipoprotein cholesterol (LDL-C), triglyceride (TG) were measured using Cobas Integra 400 Plus (Roche Diagnostics, GmbH, Mannheim, Germany). Plasma levels of insulin were estimated using Elecsys 2010 (Roche Diagnostics). Plasma levels of leptin, resistin and adiponectin were estimated using commercial ELISA kits (R&D Systems, Minneapolis, MN, USA). Serum levels
Table 1. Anthropometric and clinical characteristic of study subjects.
Character All children NW children OW/OB children
N (Boys/Girls) 3126 (1094/2032) 2230 (789/1441) 896 (305/591)
Age (years)* 13.50 (1.88) 13.51 (1.85) 13.45 (1.95)
Height (cm)* 154.21 (9.90) 153.28 (9.93) 156.52 (9.43)
Weight (Kg)* 49.00 (14.29) 42.61 (8.96) 64.92 (12.52)
BMI (Kg/m2)* 20.37 (4.68) 17.97 (2.46) 26.32 (3.41)
WC (cm)* 71.10 (11.64) 66.10 (7.76) 84.27 (9.71)
HC (cm)* 85.24 (11.11) 80.57 (7.74) 97.43 (9.14)
WHR* 0.83 (0.07) 0.82 (0.06) 0.87 (0.07)
Total cholesterol (mg/dl){
142.00 (127.00–162.55) 138.20 (124.00–156.15) 154.00 (134.25–176.00)
HDL-C (mg/dl){
45.00 (40.00–49.89) 45.00 (41.00–51.00) 43.00 (38.40–48.00)
LDL-C (mg/dl){
84.00 (71.00–95.40) 82.00 (69.10–92.20) 90.00 (75.93–106.90)
TG (mg/dl){ 95.00 (72.00–127.00) 93.00 (72.00–123.00) 103.00 (71.00–142.00)
Fasting Glucose (mg/dl){
87.20 (81.00–94.00) 88.00 (81.85–94.00) 86.80 (80.05–93.00)
Fasting Insulin (pmol/L){
46.80 (30.30–71.38) 40.08 (26.34–57.78) 74.40 (48.30–110.25)
HOMA-IR{ 1.66 (1.07–2.52) 1.44 (0.94–2.09) 2.60 (1.66–3.97)
TSH (mIU/l){
2.90 (2.13–4.09) 2.90 (2.12–4.06) 2.90 (2.18–4.15)
FT4 (pmol/L){
15.57 (14.14–17.11) 15.78 (14.31–17.34) 15.02 (13.55–16.35)
FT3 (pmol/L){ 4.77 (4.24–5.32) 4.78 (4.25–5.36) 4.70 (4.22–5.28)
Leptin (ng/mL){
9.62 (5.44–16.03) 7.66 (4.72–12.24) 18.38 (11.69–28.57)
Adiponectin (ng/mL){
7.80 (4.63–12.09) 8.53 (5.27–13.09) 5.67 (3.37–9.22)
Resistin (ng/mL){ 5.50 (4.34–7.15) 5.40 (4.30–7.10) 5.73 (4.48–7.25)
*Data presented as mean6standard deviation;{Data presented as median (interquartile range); N: Number of subjects; NW: normal weight children; OW/OB: overweight and obese children; HC: hip circumference; WC: waist circumference; WHR: waist-hip ratio; HDL-C: high density lipoprotein-cholesterol; LDL-C: low density lipoprotein-cholesterol; HOMA-IR: homeostasis model assessment of insulin resistance; TSH: thyroid stimulating hormone; FT4: free thyroxine; FT3: free tri-iodothyronine. Data for serum levels of TSH, FT3 and FT4 was available only for 1,822 subjects.
doi:10.1371/journal.pone.0047772.t001
FTOVariants and Childhood Obesity
Table 2. Association ofFTOvariants with obesity and metabolic traits in Indian children.
rs9939609 rs8050136
Traits TT TA AA OR (95%CI) P CC CA AA OR (95%CI) P
Obesity N (frequency) N (frequency)
NW children 985 (0.45) 935 (0.44) 227 (0.11) 1.00 980 (0.45) 944 (0.44) 236 (0.11) 1.00
OW/OB children 347 (0.41) 377 (0.44) 124 (0.15) 1.21 (1.07–1.37) 2.561023 351 (0.40) 397 (0.45) 126 (0.15) 1.19 (1.05–1.35) 5.061023
Quantitative
traits Mean (SD) b(95% CI) P Mean (SD) b(95% CI) P
Z-Height 0.00 (0.99) 0.00 (1.00) 0.01 (1.00) 0.00 (20.05–0.05)
0.88 0.00
(0.99)
0.02 (0.99) 0.01 (0.99) 0.00 (20.05–0.05)
0.97
Z-Weight 20.05 (1.01) 0.04 (0.99) 0.17 (0.98) 0.12 (0.06–0.17)
1.161025
20.05
(1.01)
0.06 (0.99) 0.16 (0.98) 0.12 (0.06–0.17)
1.461025
Z-BMI 20.07 (1.02) 0.05 (0.99) 0.21 (0.96) 0.14 (0.09–0.19)
1.661027
20.06
(1.02)
0.07 (0.99) 0.19 (0.96) 0.14 (0.08–0.19)
4.261027
Z-WC 20.07 (1.02) 0.03 (0.99) 0.16 (0.95) 0.12 (0.07–0.17)
1.761025
20.07
(1.03)
0.06 (0.99) 0.16 (0.94) 0.12 (0.07–0.18)
7.961026
Z-HC 20.04 (0.99) 0.04 (1.01) 0.16 (0.97) 0.11 (0.05–0.16)
1.361024
20.04
(0.99)
0.06 (1.02) 0.15 (0.97) 0.11 (0.05–0.16)
1.561024
Z-WHR 20.05 (1.03) 0.01 (0.96) 0.08 (0.95) 0.06 (0.01–0.12)
0.02 20.06 (1.04)
0.03 (0.97) 0.07 (0.94) 0.07 (0.02–0.13)
9.261023
Z-Total Cholesterol 20.05 (0.99) 20.01 (0.98) 0.02 (1.05) 0.01 (20.04–0.06)
0.74 20.05 (0.99)
0.00 (0.99) 0.01 (1.04) 0.01 (20.04–0.06)
0.72
Z-HDL-C 0.02 (0.98) 20.03 (1.00) 20.02 (1.00) 20.01 (20.06–0.05)
0.82 0.01
(0.98) 2
0.02 (1.00) 20.03 (1.01) 0.00 (20.05–0.05)
0.93
Z-LDL-C 20.03 (0.99) 0.01 (0.97) 0.02 (1.04) 0.0 (20.05–0.05)
0.93 20.03 (0.98)
0.02 (0.98) 0.03 (1.03) 0.00 (20.05–0.06)
0.85
Z-TG 0.01 (0.97) 0.08 (0.95) 0.11 (1.04) 0.03 (20.02–0.09)
0.19 0.02
(0.97)
0.06 (0.96) 0.12 (1.05) 0.03 (20.02–0.08)
0.25
Z-FPG 20.02 (1.01) 0.09 (0.98) 20.05 (1.03) 0.03 (20.02–0.09)
0.25 20.03 (1.01)
0.06 (0.98) 20.02 (1.03) 0.04 (20.02–0.09)
0.16
Z-FPI 20.02 (0.99) 20.01 (1.02) 0.10 (0.96) 20.02 (20.07–0.03)
0.39 20.02 (0.99)
0.01 (1.03) 0.10 (0.96) 20.01 (20.06–0.04)
0.65
Z-HOMA-IR 20.02 (0.99) 0.00 (1.02) 0.09 (0.97) 20.01 (20.06–0.04)
0.61 20.03 (0.99)
0.02 (1.03) 0.09 (0.97) 0.00 (20.05–0.05)
0.95
Z-Leptin 20.03 (0.98) 0.01 (1.00) 0.17 (0.98) 0.0 (20.04,0.05)
0.92 20.02 (0.98)
0.04 (1.00) 0.14 (0.98) 0.0 (20.04,0.05)
0.89
Z-Adiponectin 0.02 (0.99) 0.02 (0.98) 20.03 (1.02) 0.02 (20.04,0.07)
0.54 0.01
(0.98)
0.02 (0.98) 20.03 (1.03) 0.02 (20.03,0.07)
0.41
Z-Resistin 0.01 (0.99) 0.0 (0.99) 0.04 (1.06) 0.0 (20.06,0.05)
0.92 0.0
(0.99)
0.0 (1) 0.03 (1.06) 0.0 (20.05,0.06)
0.87
Z-FT3{
0.07 (0.99) 0.04 (0.95) 0.00 (1.01) 0.04 0.30 0.07 0.04 (0.94) 0.01 (1.00) 0.04 0.26
FTO
Variants
and
Childhood
Obesity
ONE
|
www.ploson
e.org
3
October
2012
|
Volume
7
|
Issue
10
|
of free tri-iodothyronine (FT3), free thyroxin (FT4) were estimated by radio immunoassay and thyroid stimulating hormone (TSH) by immunoradiometric assay (Immunotech, Beckman Coulter).
Genotyping
Genotyping of the variants was performed using Illumina GoldenGate assay (Illumina Inc., San Diego, CA, USA) and iPLEX assay (Sequenom San Diego, CA, USA). Stringent quality control (QC) was applied to the genotyped data (Table S1) as discussed previously [21]. The genotype call rate was.95% for both the variants. Genotype distributions of both variants followed Hardy Weinberg Equilibrium (HWE).
Statistical analyses
Statistical analyses were performed using PLINK v.1.07 (http://pngu.mgh.harvard.edu/purcell/plink) [22] and SPSS v. 17.0 (SPSS, Chicago, IL, USA). Genotype distributions were tested for HWE throughx2
analysis. Pairwise linkage disequilib-rium (LD) between SNPs was determined using Haploview 4.0 software [23]. Association of variants with obesity was tested using logistic regression under additive model adjusting for age and sex. Additionally, we also tested association of variants with obesity risk under dominant and recessive models adjusting for age and sex. Continuous quantitative traits were transformed to normal distribution using inverse normal transformation. Prior to analysis, continuous variables were converted to age and sex specific internal Z-scores by dividing differences of individual values and mean values of study population by standard deviation. Associ-ation of variants with height, weight, WC, HC, BMI and WHR were assessed by linear regression using additive model adjusting for age and sex while associations with other continuous variables were adjusted for age, sex and Z-BMI. Effect sizes were expressed as change in Z-score unit. We also estimated per allele effect size in their respective units that are compatible with other reported studies used for comparison. Heterogeneity in effect sizes was estimated using Cochran’s Q statistics. Percentage of variance explained byFTOvariants was quantified using the equation 2f (1-f)b2
, where f is frequency of variant in population and b is standardized additive effect size [4].
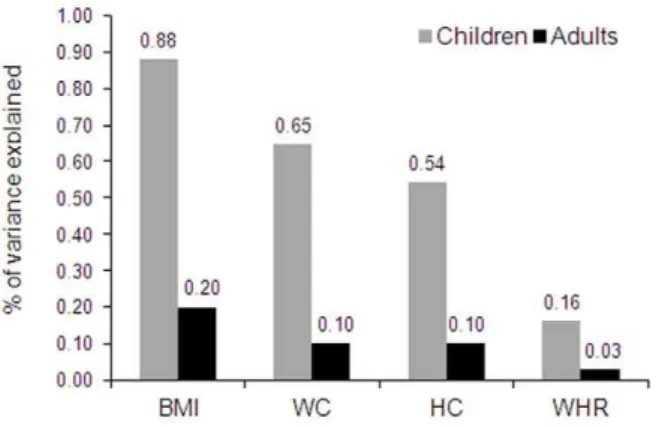
Figure 1. Variance in adiposity measures explained by FTO
variant rs9939609 in Indian children and adults.BMI: body mass index; WC: waist circumference; HC: hip circumference; WHR: waist-to-hip ratio. Data for children were taken from present study while the data for adults were taken from a recent meta-analysis (up to 17,124 subjects) on South Asian adults byLi et al[13].
doi:10.1371/journal.pone.0047772.g001 Table 2. Cont. Quantitative traits Mean (SD) b (95% CI) P Mean (SD) b (95% CI) P Z-FT4 { 0.00 (1.03) 2 0.05 (0.94) 2 0.07 (1.08) 2 0.01 ( 2 0.08–0.06) 0.73 0.00 (1.02) 2 0.06 (0.94) 2 0.04 (1.08)
0.00 (2
0.07–0.06) 0.92 Z-TSH { 2 0.07 (0.99) 0.07 (0.97) 0.08 (1.01) 0.10 (0.03–0.17) 5.8 6 10 2 3 2 0.07 (0.99) 0.08 (0.97) 0.06 (1.01) 0.09 (0.02–0.16) 8.4 6 10 2 3 N: Number of subjects; SD: standard deviation; CI: confidence interval; OR: odds ratio with respect to minor allele; HC: hip circumference; WC: waist circumference; WHR: waist-hip ratio; HDL-C: high density lipoprotein-cholesterol ; LDL-C: low density lipoprotein-cholest erol; HOMA-IR: homeostasis model assessment of insulin resistance; TSH: thyroid stimulating h ormone; FT4 :free thyroxine; FT3: free Tri-iodothyronine. b represents change in Z score unit per increase in minor allele. { Association analysis was p erformed in 1,765 successful genotyped subjects. doi:10.1371/journal.pone. 0047772.t002
FTOVariants and Childhood Obesity
Results
Anthropometric and clinical characteristics of the subjects are provided in Table 1. Both variants rs9939609 and rs8050136 were in strong LD with each other (r2= 0.97). As two SNPs represent same signal and association results were similar (Table 2), all results have been discussed with respect to rs9939609.
The rs9939609 showed significant association with risk of obesity in children [OR = 1.21,P= 2.561023
for additive model] (Table 2). Consistently, we also observed significant association of the risk allele (Table 2) with increase in BMI [b= 0.14 Z-score unit, P= 1.661027], weight [b
= 0.12, P= 1.161025 ], WC [b= 0.12, P= 1.761025] and HC [b
= 0.11,P= 1.361024 ]. We also performed association analysis assuming dominant and recessive genetic models. Association result for variant rs9939609 under dominant model [OR = 1.23,P= 1.261022
] was similar to additive model [OR = 1.21, P= 2.561023
]. However, we ob-served slightly higher effect size under recessive model [OR = 1.46, P= 1.861023
] compared to additive and dominant models. Variant rs9939609 explains 0.65% to 0.88% of the inter-individual variation in measures of obesity (Figure 1). Further, we explored gender differences in the effect of FTOvariants on obesity measures. We did not find any significant difference in the effect ofFTOvariants among boys and girls for any anthropome-trical traits (Table S2).
Further, to investigate age dependent influence ofFTOvariants on obesity traits, we compared the effect sizes of rs9939609 on adiposity parameters in children with that of adults from a recent and largest meta-analysis on South Asian adults (up to 17,124 adults) [13]. Significant heterogeneity in the effects of rs9939609 (I2.77.86%) between children and adults on BMI [0.64 kg/m2 for children and 0.29 kg/m2 for adults] and WC [1.27 cm for children and 0.54 cm for adults] were found (Table 3). The effect size on WHR between children and adults were similar with low heterogeneity (I2= 15.49%). Further we compared the effect of variant rs9939609 on obesity traits in children with that of adults from North India from our previous study [16]. Consistently, we observed high heterogeneity in effect size on BMI in children compared to the adults (I2= 67.2%). However, there was no
difference (I2= 0) in effect sizes of WC and WHR between North Indian children and adults (Table S3).
FTO variants are shown to have varying effect on adiposity
measures among adults in different ethnic groups [6]. Comparison of influences ofFTOvariants on BMI and WC in Indian children from present study and European children from a meta-analysis study (up to 19,268 children) [24] showed only low to moderate heterogeneity (I2= 0 to 48.6%) (Table 3). Similarly the observed effect ofFTOvariant on BMI in Indian children (0.64 kg/m2) was similar to those reported for East Asian children (0.29 to 0.50 kg/ m2) [14,15].
Next, we performed exploratory analysis to investigate associ-ation of FTO variants with biochemical markers of glucose metabolism, lipid metabolism, thyroid function and inflammation as all the parameters are related to obesity. Intriguingly, we observed significant association of minor allele of rs9939609 with elevated serum levels of TSH in children [b= 0.10,P= 5.861023
] (Table 2). We also found BMI dependent association of rs9939609 with plasma level of leptin [b= 0.08,P= 4.061023
], however that diminished after adjusting for BMI (Table 2). We did not observe any association of rs9939609 with makers of glucose and lipid metabolism (Table 2).
Discussion
Numerous GWAS and subsequent replication studies in distinct population of European, African and Asian origin have robustly established association of FTOwith obesity parameters, both in adults and children [6]. The present study evaluated the effect of FTO variants (rs9939609 and rs8050136) on susceptibility to
obesity and related traits in Indian children. To the best of our knowledge, this is the first report demonstrating association ofFTO variant with obesity in children from South Asia.
Influence ofFTOvariants on adiposity measures
FTO variants showed strong influence on overall adiposity in
Indian children. Children homozygous for minor allele of rs9939609 had ,1.5 kg/m2 higher BMI, ,2 cm higher WC and,2 kg higher weight compared to children homozygous for Table 3.Comparison of effect sizes of rs9939609 for adiposity measures.
Indian Children* (N = 3,126)
Indian Adults{
(N = up to 17,124) Q I2
Indian Children* (N = 3,126)
European Children{ (N = up to19,268) Children{ (Up to 19,268
children) Q I2
Traits b(95%CI) b(95%CI)
b(95%CI) (In Z-score units)
b(95%CI) (In Z-score units)
BMI (kg/m2) 0.64
(0.41–0.88)
0.29 (0.13–0.44)
0.02 82.42 0.14 (0.09–0.19)
0.10 (0.08–0.12)
0.16 48.60
WC (cm) 1.27 (0.65–1.89)
0.54 (0.28–0.81)
0.03 77.86 0.12 (0.07–0.17)
0.11 (0.08–0.13)
0.75 0.00
HC (cm) 1.06 (0.50–1.63)
0.46 (0.13–0.79)
0.07 68.88 - - -
-Z-WHR 0.004
(0.000–0.007)
0.002 (0.001–0.004)
0.28 15.49 - - -
-brepresents change in Z score unit or in the respective units of traits with per increase in minor allele. N: Number of subjects; Q:Pvalue for Cochrane’s Q statistic for heterogeneity of effects; I2: Iˆ2 heterogeneity index (0–100). *Summary statistic data for obesity measures were taken from present study,{Summary statistic data for
obesity measures were taken from recent meta-analysis on south Asian adults byLi et al. [13],{Summary statistic data for obesity measures were taken from recent meta-analysis on European children byKilpela¨inen et al. [24].
other allele. The effect sizes of the variants on BMI, weight, WC and HC were similar (b range 0.11 to 0.14 Z-score), indicating similar influence on the measures of adiposity. Interestingly, a recent study (Vasan et al.) on longitudinal birth cohort from South India [12] showed association of rs9939609 with obesity-related traits in adulthood, but not at younger ages. It is noteworthy that present study differ in sample size, study design and subject recruitment from the study by Vasan et al that has lower samples size (up to 1,644 in adolescence) and recruited subjects from rural and urban regions of South India. Environmental factors including diet and physical activity are known to modulate the effect ofFTO variants on adiposity [24,25]. The study (Vasan et al.) itself showed effect ofFTOon obesity traits is influenced by urban living conditions. The observed discrepancy in the association results might be due to lower statistical power contributed by smaller sample size and attenuated influence of FTO on adiposity in recruited subjects.
Age dependent influence ofFTOvariants on adiposity measures
FTOvariants observed effect sizes and contribution in variance
of adiposity traits in Indian children are higher than South Asian adults. Per minor allele increase in BMI is ,2 fold higher in children compared to adults. Further, the genetic contribution of FTOvariants on BMI variance in children (0.88%) is almost four
times higher to those reported for adult BMI variance (0.20%) in South Asian [13]. Similarly, for other adiposity parameters (WC and WHR) too, FTO variants have higher contribution to the variance in children (0.54–0.65%) than South Asian adults (0.03– 0.10%). Thus our results clearly indicate thatFTOvariants have biphasic effect with greater impact during childhood when compared to adulthood. The age related changes in lifestyle, eating behavior and exposure to environmental factors could be possible reasons for the age dependent variation in effect ofFTO variants on obesity related anthropometric traits. However, the present study design does not allow investigating such gene-environment interaction. Further studies with information on eating behavior and environmental factors could provide better insight to it.
Comparing effect sizes in Indian children with children from other population
The comparison of effect sizes of FTO variants on adiposity measures between Indian and European children revealed its similar influence on both population despite the evident variation in their anthropometric features and genetic architecture. The effect of FTO variants on obesity parameters are shown to be generally smaller in Asian adults compared to European adults [13]. However, we found similar effect of FTO variants on adiposity measures in children from Indian, European and East Asian population. This suggests thatFTOvariants has uniform and equal influence during childhood in different ethnic population but varies later in life.
Influence of FTOvariants on serum TSH levels
The understanding of molecular mechanism ofFTOin weight regulation is just started to begin and largely remains elusive till date.FTOpredisposes to weight gain primarily due to increase in energy intake, however animal studies have also shown its effect on
metabolic rate and energy expenditure [7,8]. FurtherFTOhas also been shown to have BMI independent effect on metabolic traits [26]. Our study demonstrates association of FTO variants with levels of TSH that is produced in pituitary gland. FTO is also abundantly expressed in pituitary gland. Previous studies have shown that slight change in TSH levels is associated with weight gain and it directly correlates with fat mass [27]. The association of FTOrisk allele with increased levels of TSH as well as its BMI
dependent association with leptin levels indicates putative involvement of FTO in hypothalamic-pituitary-thyroid axis in mediating metabolic effects.
Limitations of present study
Though the present study indicates influence ofFTOvariants on pituitary function through association with TSH levels, the possibility of reverse causation (i.e. increase in TSH level as a result of obesity caused byFTOvariants) could not be completely ruled out due to cross-sectional design of the study. Further studies are warranted in this direction to confirm and elucidate the precise role ofFTOin pituitary function.
Conclusion
We demonstrate here, for the first time, association of FTO variants with obesity risk and adiposity measures (BMI, weight, WC and HC) in Indian children. The study also suggests thatFTO variants have age dependent influence on adiposity traits in Indians with higher impact in children compared to adults.
Supporting Information
Table S1 Quality check for genotyped data.
(DOC)
Table S2 Comparison of effect sizes of FTO variant
rs9939609 on adiposity measures between Indian boys and girls.brepresents change in Z score per increase in minor allele; CI: confidence interval; Q: P value for Cochrane’s Q statistic; I: Iˆ2 heterogeneity index (0–100).
(DOC)
Table S3 Comparison of effect sizes ofFTOvariant on
adiposity measures in North Indian children and adults. b represents per minor allele change in trait. Q: P value for Cochrane’s Q statistic for heterogeneity of effects; I2: Iˆ2 heterogeneity index (0–100). *Summary statistic data for obesity measures were taken from present study,{Summary statistic data for obesity measures were taken from study on North Indian adults (up to 2,626 adults) byChauhan et al[16].
(DOC)
Acknowledgments
We are thankful to all the participating subjects, their parents and school authorities for their support and cooperation in carrying out the study. We thank Mr. Kuntal Bhadra from Institute of Nuclear Medicine and Allied Sciences for his help in sample collection.
Author Contributions
Conceived and designed the experiments: OPD NT DB. Performed the experiments: OPD. Analyzed the data: OPD RT GC SG. Contributed reagents/materials/analysis tools: RKM. Wrote the paper: OPD RT DB.
References
1. Loos RJ (2012) Genetic determinants of common obesity and their value in prediction. Best Pract Res Clin Endocrinol Metab 26: 211–216.
2. Frayling TM, Timpson NJ, Weedon MN, Zeggini E, Freathy RM, et al. (2007) A common variant in the FTO gene is associated with body mass FTOVariants and Childhood Obesity
index and predisposes to childhood and adult obesity. Science 316: 889– 894.
3. Scuteri A, Sanna S, Chen WM, Uda M, Albai G, et al. (2007) Genome-wide association scan shows genetic variants in the FTO gene are associated with obesity-related traits. PLoS Genet 3: e115.
4. Speliotes EK, Willer CJ, Berndt SI, Monda KL, Thorleifsson G, et al. (2010) Association analyses of 249,796 individuals reveal 18 new loci associated with body mass index. Nat Genet 42: 937–948.
5. Wen W, Cho YS, Zheng W, Dorajoo R, Kato N, et al. (2012) Meta-analysis identifies common variants associated with body mass index in east Asians. Nat Genet 44: 307–311.
6. Loos RJ, Bouchard C (2008) FTO: the first gene contributing to common forms of human obesity. Obes Rev 9: 246–250.
7. Church C, Moir L, McMurray F, Girard C, Banks GT, et al. (2010) Overexpression of Fto leads to increased food intake and results in obesity. Nat Genet 42: 1086–1092.
8. Fischer J, Koch L, Emmerling C, Vierkotten J, Peters T, et al. (2009) Inactivation of the Fto gene protects from obesity. Nature 458: 894–898. 9. Larder R, Cheung MK, Tung YC, Yeo GS, Coll AP (2011) Where to go with
FTO? Trends Endocrinol Metab 22: 53–59.
10. Hardy R, Wills AK, Wong A, Elks CE, Wareham NJ, et al. (2010) Life course variations in the associations between FTO and MC4R gene variants and body size. Hum Mol Genet 19: 545–552.
11. Sovio U, Mook-Kanamori DO, Warrington NM, Lawrence R, Briollais L, et al. (2011) Association between common variation at the FTO locus and changes in body mass index from infancy to late childhood: the complex nature of genetic association through growth and development. PLoS Genet 7: e1001307. 12. Vasan SK, Fall T, Neville MJ, Antonisamy B, Fall CH, et al. (2012) Associations
of Variants in FTO and Near MC4R With Obesity Traits in South Asian Indians. Obesity (in press) DOI: 10.1038/oby.2012.64.
13. Li H, Kilpela¨inen TO, Liu C, Zhu J, Liu Y, et al. (2012) Association of genetic variation in FTO with risk of obesity and type 2 diabetes with data from 96,551 East and South Asians. Diabetologia 55: 981–995.
14. Wang J, Mei H, Chen W, Jiang Y, Sun W, et al. (2012) Study of eight GWAS-identified common variants for association with obesity-related indices in Chinese children at puberty. Int J Obes 36: 542–547.
15. Wu L, Xi B, Zhang M, Shen Y, Zhao X, et al. (2010) Associations of six single nucleotide polymorphisms in obesity-related genes with BMI and risk of obesity in Chinese children. Diabetes 59: 3085–3089.
16. Chauhan G, Tabassum R, Mahajan A, Dwivedi OP, Mahendran Y, et al. (2011) Common variants of FTO and the risk of obesity and type 2 diabetes in Indians. J Hum Genet 56: 720–726.
17. Marwaha RK, Tandon N, Singh Y, Aggarwal R, Grewal K, et al. (2006) A study of growth parameters and prevalence of overweight and obesity in school children from Delhi. Indian Pediatr 43: 943–952.
18. Cole TJ, Bellizzi MC, Flegal KM, Dietz WH (2000) Establishing a standard definition for child overweight and obesity worldwide: international survey. BMJ 320: 1240–1243.
19. Indian Diabetes Consortium (2011) INDICO: A resource for epigenomic study of Indians undergoing socioeconomic transition. HUGO J 5: 65–69. 20. Tabassum R, Mahendran Y, Dwivedi OP, Chauhan G, Ghosh S, et al. (2012)
Common variants of IL6, LEPR, and PBEF1 are associated with obesity in Indian children. Diabetes 61: 626–631.
21. Chauhan G, Spurgeon CJ, Tabassum R, Bhaskar S, Kulkarni SR, et al. (2010) Impact of common variants of PPARG, KCNJ11, TCF7L2, SLC30A8, HHEX, CDKN2A, IGF2BP2, and CDKAL1 on the risk of type 2 diabetes in 5,164 Indians. Diabetes 59: 2068–2074.
22. Purcell S, Neale B, Todd-Brown K, Thomas L, Ferreira MA, et al. (2007) PLINK: a tool set for whole-genome association and population-based linkage analyses. Am J Hum Genet 81: 559–575.
23. Barrett JC, Fry B, Maller J, Daly MJ (2005) Haploview: analysis and visualization of LD and haplotype maps. Bioinformatics 21: 263–265. 24. Kilpela¨inen TO, Qi L, Brage S, Sharp SJ, Sonestedt E, et al. (2011) Physical
activity attenuates the influence of FTO variants on obesity risk: a meta-analysis of 218,166 adults and 19,268 children. PLoSMed 8: e1001116.
25. Sonestedt E, Roos C, Gullberg B, Ericson U, Wirfa¨lt E, et al. (2009) Fat and carbohydrate intake modify the association between genetic variation in the FTO genotype and obesity. Am J Clin Nutr 90: 1418–1425.
26. Kirkpatrick CL, Marchetti P, Purrello F, Piro S, Bugliani, etal. (2010) Type 2 diabetes susceptibility gene expression in normal or diabetic sorted human alpha and beta cells: correlations with age or BMI of islet donors. PLoS One 5: e11053.