www.biogeosciences.net/4/233/2007/ © Author(s) 2007. This work is licensed under a Creative Commons License.
Biogeosciences
An oceanic fixed nitrogen sink exceeding 400 Tg N a
−
1
vs the concept
of homeostasis in the fixed-nitrogen inventory
L. A. Codispoti
University of Maryland Center for Environmental Science, Horn Point Lab., P.O. Box 775, Cambridge, MD 21613, USA Received: 6 July 2006 – Published in Biogeosciences Discuss.: 1 August 2006
Revised: 4 April 2007 – Accepted: 20 April 2007 – Published: 7 May 2007
Abstract. Measurements of the N2produced by denitrifica-tion, a better understanding of non-canonical pathways for N2production such as the anammox reaction, better appre-ciation of the multiple environments in which denitrification can occur (e.g. brine pockets in ice, within particles outside of suboxic water, etc.) suggest that it is unlikely that the oceanic denitrification rate is less than 400 Tg N a−1. Be-cause this sink term far exceeds present estimates for nitro-gen fixation, the main source for oceanic fixed-N, there is a large apparent deficit (∼200 Tg N a−1) in the oceanic fixed-N budget. The size of the deficit appears to conflict with appar-ent constraints of the atmospheric carbon dioxide and sed-imentaryδ15N records that suggest homeostasis during the Holocene. In addition, the oceanic nitrate/phosphate ratio tends to be close to the canonical Redfield biological uptake ratio of 16 (by N and P atoms) which can be interpreted to in-dicate the existence of a powerful feed-back mechanism that forces the system towards a balance. The main point of this
paper is that one cannot solve this conundrum by reducing the oceanic sink term. To do so would violate an avalanche
of recent data on oceanic denitrification.
A solution to this problem may be as simple as an up-wards revision of the oceanic nitrogen fixation rate, and it is noted that most direct estimates for this term have concen-trated on nitrogen fixation by autotrophs in the photic zone, even though nitrogen fixing genes are widespread. Another simple explanation may be that we are simply no longer in the Holocene and one might expect to see temporary imbal-ances in the oceanic fixed-N budget as we transition from the Holocene to the Anthropocene in line with an apparent deni-trification maximum during the Glacial-Holocene transition. Other possible full or partial explanations involve plausible changes in the oceanic nitrate/phosphate and N/C ratios, an oceanic phosphorus budget that may also be in deficit, and
Correspondence to: L. A. Codispoti
oscillations in the source and sink terms that are short enough to be averaged out in the atmospheric and geologic records, but which could, perhaps, last long enough to have signifi-cant impacts.
1 Introduction
Because of its relationship with the planetary nitrous ox-ide distribution, biological productivity (e.g. Redfield et al., 1963) and the ocean’s ability to sequester atmospheric carbon dioxide (e.g. Codispoti et al., 2001; Falkowski, 1997), there is more than academic interest in the oceanic fixed-N budget. Moreover, there has been considerable debate over the state of the oceanic fixed-N budget in recent years (Gruber and Sarmiento, 1997; Codispoti et al., 2001; Gruber, 2004). This contribution originated as an invitation to provide a thought-provoking talk on the oceanic fixed-N budget at the SPOT-ON (Significant Processes, Observations, and Transforma-tion in Oceanic Nitrogen) conference held in Warnem¨unde, Germany during June–July 2005. As a consequence, this pa-per has a point of view, and one of its goals is to excite inter-est in areas of research that might help to put our inter-estimates on firmer ground.
NH4+ NO 2
-NO3
-N2 N2O NO NH4+
and R-NH2
NH4+and Organic Matter Oxidation Using IO3-, NO3-, Mn (III & IV)
And Fe (III)
Denitrifiers and Dissimilatory Nitrate Reducers
NH4+ Anammox
Nitrifiers
Oxidation State
-III -II -I 0 +I +II +III +IV +V
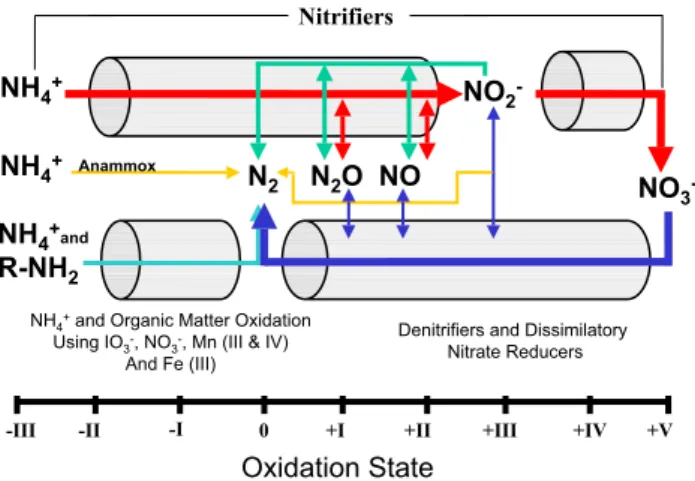
Fig. 1. This figure is re-drawn and updated from Codispoti et al. (2005). The suite of reactions supporting canonical denitrifi-cation are shown by the red (nitrifidenitrifi-cation) and dark blue (canonical denitrification) arrows. The green arrows indicate a denitrification process that is associated with nitrification. This process produces N2O and might also produce N2. During these three processes, the intermediates, N2O, NO, and NO−2 can leave the cell and be
changed between nitrifiers and denitrifiers. The NO−2 produced can also support the anammox pathway (yellow arrows) in which NH+4 is oxidized to N2and NO−2 is reduced to N2. A review of the
lit-erature also suggests that oxidation of organic-N or NH+4 by NO−3, iodate (IO−3), oxidized metals such as Mn (III&IV), Fe (III) and var-ious oxidized trace metals can also produce N2(light blue arrow).
Not shown is the possibility that the oxidation of Mn (II) by NO−3 may also produce N2(Luther et al., 1997). Intermediate chemicals
involved in the anammox reaction (e.g. hydrazine) are omitted for simplicity.
denitrification are correlated with increased phosphate moval rates and review some data and concepts that re-late to the constancy (or lack thereof) of the oceanic ni-trate/phosphate ratio. A constant refrain in this paper can be encapsulated by the phrase, “The more we look, the more we find”, a comment made by A. H. Devol when he and the author of this paper were puzzling over ever-increasing esti-mates of oceanic denitrification years ago. Reconciliation of the data on the oceanic fixed-N sink with prevailing concepts and beguiling notions such as a Redfieldian and homeostatic oceanic N cycle will be attempted. This paper will also make a case for increasing both the denitrification sink and nitro-gen fixation terms in the oceanic fixed-N budget. This analy-sis also will suggest that the lessons from the past may be an uncertain predictor of the near-term (∼100 yrs) future as we transition from Milankovich to Anthropogenic climate forc-ing, and as the already massive anthropogenic impingement on the marine environment increases (e.g. Crutzen, 2002).
2 Scientific background
2.1 General
Although there are other sources and sinks for oceanic fixed-N, there is general agreement that the oceanic fixed-N bud-get is dominated by internal biological cycling: a nitrogen fixation source and a sink that arises from the biological processes that convert fixed-N to N2 (e.g. Table 1; Gruber and Sarmiento, 1997; Codispoti et al., 2005; Tyrell, 1999). There is also a consensus that the estimates for these source and sink terms made only a decade or two ago (e.g. Codis-poti and Christensen, 1985; Capone, 1983; Carpenter, 1983) were far too low. With respect to nitrogen fixation, esti-mates of the global oceanic fixation rate have been revised upwards and may require further upwards revision (Davis and McGillicuddy, 2006; Montoya et al., 2004). Changes in our understanding of denitrification have perhaps been even more dramatic. We now better appreciate that in addition to “canonical denitrification” that is encapsulated in the fol-lowing reaction sequence, NO−3→NO−2→NO→N2O→N2, there are multiple biological pathways to N2(Fig. 1; Codis-poti et al., 2005). One of these pathways, the anammox re-action (NH+4 + NO−2→N2+2H2O), may be more important than the canonical route to N2 under some circumstances (Kuypers et al., 2005 and 2006; Thamdrup et al., 2006) and has been demonstrated to occur in the water column, in sed-iments and in sea ice (Dalsgaard and Thamdrup, 2002; Dals-gaard et al., 2003; Kuypers et al., 2005 and 2006). In addi-tion, recent evidence from the Arabian Sea suggests that the biological production of dinitrogen (N2)in the ocean exceeds estimates based on canonical stoichiometries for denitrifica-tion (Codispoti et al., 2001; Devol et al., 2006a, b; Naqvi et al., 2006). Note that in this paper, “denitrification” denotes the ensemble (Fig. 1) of biological processes that can convert fixed-N to dinitrogen (N2).
2.2 Water column denitrification
Table 1. Simplified1pro-forma present-day oceanic fixed-N budgets [in Tg] and the unfractionated/fractionated ratio2.
Process G&S 2002 G2004 C et al. 2001 C 2007
Nitrogen Fixation 132 ± 41 135 ± 51 132 135+++
Benthic Denitrification 95 ± 20 180 ± 50 300 300+
UF/F Ratio 1.2 3.6 3.8 57 3.8 57
Water Column Denit. 80 ± 20 50 ± 20 150 150++
Totals (all sources&sinks) + 34 ± 53 5 ±78 -188 -234
1G&S 2002 = Gruber and Sarmiento (2002). G 2004 = Gruber (2004). C et al. (2001) = Codispoti et al. (2001), and C 2007 = this paper.
Other significant sources (in Tg N a−1)include riverine inputs estimated by the above budgets as 76–80±14. Estimates for atmospheric inputs are as follows: G&S 2002 = 30±5, C et al. = 86, G 2004 = 50 & C 2007 = 30. Benthic nitrogen fixation was taken to be 15±10 in all of the above budgets, and is lumped with water column nitrogen fixation. Other sinks include burial which is 25±10 in all budgets, and N2O loss to the atmosphere taken as 4±2 in G&S 2002 and G 2004, and as 6 in C et al. (2001), and C 2007. Some budgets suggest a loss of ∼1 Tg N a−1due to organic-N export from the ocean.
2The arrows and the value “57” indicate that with respect to isotopic fractionation of N, this paper assumes that 38% of total water column
denitrification behaves like sedimentary denitrification. Unfractionated (sediments + water)/fractionated denitrification ratios (UF/F) are shown in blue.
1986), as well as transiently during outbreaks of suboxia in shallow coastal waters such as has been documented over the West Indian Shelf (e.g. Naqvi, et al., 2000). With in-creases in the outbreaks of coastal hypoxia/suboxia/anoxia that may arise from increasing additions of anthropogenic nutrients (e.g. Naqvi et al., 2000; Rabalais et al., 2000), it is possible that water column denitrification rates in the coastal ocean are on the increase. Globally significant increases in the denitrification rate in the ETSP appeared to have occurred between the early 1970’s and the mid-1980s (Codispoti et al., 1986) perhaps as “natural” consequences of a regime shift, and a la Ni˜na event (Codispoti et al., 1986; Chavez et al., 2003), and/or anthropogenic disturbance (Codispoti and Packard, 1980). Evidence for variability in the oceanic water column denitrification rate on glacial-interglacial time scales has been demonstrated for the Eastern Tropical Pacific (Ganeshram et al., 2002). Altabet et al’s. (2002) examination of cores from the Arabian Sea suggests significant variability on glacial-interglacial and∼millennial time scales.
Codispoti et al. (2001) suggested that a conservative esti-mate of oceanic water column denitrification in the present-day ocean was∼150 Tg N a−1. We shall present and extend their reasoning later (Sect. 3.3).
2.3 Sedimentary denitrification
Middelburg et al. (1996) suggest an oceanic sedimen-tary denitrification rate (including continental shelves) be-tween 230–285 Tg N a−1. Brandes and Devol (2002)
sug-gest that the oceanic nitrogen isotope budget requires a sedimentary denitrification rate during the Holocene of ∼280 Tg N a−1 based on a nitrogen isotope budget. Gru-ber (2004) suggests an oceanic sedimentary denitrification rate of 180±50 Tg N a−1. This paper (Sect. 3.4) will make the case for an oceanic sedimentary denitrification rate of 300 Tg N a−1or higher. Here it is useful to note that many past estimates of oceanic sedimentary denitrification ne-glected the importance of coupled nitrification-denitrification in sediments (see Codispoti and Christensen, 1985) and that most sedimentary estimates have not directly determined N2 fluxes from the sediments. As a consequence, many esti-mates may not account for all of the pathways to N2. 2.4 Nitrogen fixation
It is likely that estimates for marine nitrogen fixation will continue to increase. Existing estimates for the total oceanic nitrogen fixation rate (e.g. Codispoti et al., 2005; Deutsch et al., 2005 and 2007; Gruber, 2004), do not ex-ceed 160 Tg N a−1, but this rate is based on observations and models concentrated on the photic zone and coastal sedi-ments. There does not appear to have been a comprehensive study of heterotrophic and lithotrophic nitrogen fixation rates in sub-euphotic zone waters and deeper sediments, although the genome for nitrogen fixation appears to be widespread (Capone, 2001; Zehr et al., 1998 and 2006).
3 Discussion
3.1 The oceanic fixed-N budget
Table 1 presents simplified “pro forma” oceanic fixed-N bud-gets. The totals include all known processes, but only the nitrogen fixation and denitrification rates are explicitly in-dicated because it is the apparent imbalance between these rates that is at the core of the problem addressed in this pa-per. The other terms are noted in the foonotes to Table 1. Note that our budgets (this paper, and Codispoti et al., 2001) include continental shelves and marginal seas such as the Mediterranean, Black and Baltic seas, but omit estuaries. It is obvious that there is considerable disagreement on the den-itrification sink terms and whether or not the available infor-mation suggest a balanced or unbalanced budget. We will discuss this matter in some detail in the following sections. At the outset, we will note that as a result of discussions at the SPOT-ON, (Jickells, 2006) and also as a consequence of a recent study (Chuck et al., 2002) suggesting that the ocean is a source of alkyl nitrates, we now believe that the upwards revision in the atmospheric source term in the Codispoti et al. (2001) budget was in error and have reduced this term to bring it in line with the other budgets. The effect of this revi-sion is to put the Codispoti et al. (2001) budget (Table 1) into an even greater deficit (∼230 Tg N a−1). We also note, that our budget’s N2O loss term (6 Tg N a−1) is in accord with the work of Bange (2006) who estimates that a conservative estimate for the oceanic loss (including estuaries, in his case) would be 7±4 Tg N a−1. We will not discuss this term further because a change of 2–3 Tg N a−1from the canonical values while important for atmospheric chemistry has only a minor impact on the overall oceanic fixed-N budget. Finally, the “+” signs in Table 1 are included to suggest the author’s spec-ulations about the likelihood of some of the terms increasing as we learn more, and, of course, “pro forma” means that most of the budget terms are highly uncertain.
3.2 The problem
There is a consensus that traditional estimates of nitrogen fixation and denitrification were too low and that the oceanic turnover time for fixed-N is∼2500 years or less (Codispoti
et al., 2005; Gruber, 2004; Middelburg et al., 1996). There is also agreement that the terms in the budget are poorly con-strained (e.g. Gruber and Sarmiento, 1997 and 2002; Gruber, 2004). The problem that this paper seeks to address is that the total sink terms posited by Codispoti et al. (2001), pro-duce fixed-N deficits that would be unlikely to exist for more than several hundred years without violating apparent con-straints imposed by the Holocene atmospheric carbon diox-ide record (Gruber and Sarmiento, 1997) and the Holocene sedimentary15N record (Altabet, 2002 and 2006; Deutsch et al., 2004). In addition, there exists the traditional “geo-chemist’s” view that since the oceanic nitrate/phosphate ratio (∼15 by N and P atoms; Falkowski, 2000) is quite similar to the canonical “Redfieldian” ratio of 16 in “plankton” (see Falkowski, 2000), and since the fixed-N budget is dominated by a biological source (nitrogen fixation) and sink (denitri-fication) there is a strong tendency for “homeostasis” (e.g. Gruber, 2004; Tyrell, 1999). The coupling of denitrification and nitrogen fixation over ocean circulation and shorter time-scales (Broecker and Peng, 1982; Codispoti, 1989) does pro-vide negative feed-backs that favor homeostasis, but this pa-per will suggest that there are several possible factors that could weaken the influence of this mechanism, and that, to the extent that it does apply in today’s ocean, it must account for a fixed-N sink term of>400 Tg N a−1.
3.3 A water column denitrification rate of more than 150 Tg N a−1?
3.3.1 Denitrification within regions with the largest vol-umes of suboxic water
The new nitrate deficit method produced a total water col-umn burden about twice as high as canonical estimates, and about four times as high as the nitrate deficit method em-ployed by Howell et al. (1997) who estimated an Arabian Sea denitrification rate of 21±7 Tg N a−1. The excess N2 val-ues available to Codispoti et al. (2001) plus more recent data (A. H. Devol, personal communication) suggest that the ex-cess N2burden in the water column was∼75% higher than predicated by the new nitrate deficit. Taking these results at face value would, therefore, suggest that previously esti-mated denitrification rates of 30 Tg N a−1for the Arabian Sea (e.g. Bange et al., 2005) based on canonical nitrate deficits should be multiplied by up to 3.5 which would yield a rate of 105 Tg N a−1. But because a significant fraction of the increases in nitrate deficits were at depths>1000 m (Codis-poti et al., 2001; Devol et al., 2006a and b) where residence times should be longer and rates of advection slower, it was thought reasonable to suggest a revised denitrification esti-mate of 60 Tg N a−1 for the quasi-permanent suboxic zone in the Arabian Sea based on residence times/transports of the excess N2. As a check on this estimate we may con-sider denitrification rate estimates for the quasi-permanent suboxic zone in the Arabian Sea based on the activity of the respiratory electron transport system (ETS; Naqvi and Shailaja, 1993) and on15NO−3 incubations. These estimates assumed no oxidation of organic-N and ammonium to N2 (Devol et al., 2006b), and it is, therefore, reasonable to sug-gest that they should be multiplied by the excess N2/nitrate deficit ratio of 1.75 on the assumption that the “extra” excess N2comes from the suite of ammonium and organic-N oxi-dations discussed by Codispoti et al. (2001 and 2005). The average of these estimates is 39 Tg N a−1 which multiplied by 1.75 returns a value of 69 Tg N a−1. Thus, this ensem-ble of data suggests that a denitrification rate estimate for the quasi-permanent suboxic water mass in the northern Arabian Sea of 60 Tg N a−1is more reasonable than the canonical es-timate of∼30 Tg N a−1.
Turning to the suboxic waters in the Eastern Tropi-cal Pacific where the canoniTropi-cal estimate for denitrification was∼50 Tg N a−1 (e.g. Deutsch et al., 2001), Codispoti et al. (2001) thought it reasonable to multiply this value by 1.5 based on the excess N2data from the Arabian Sea, and on the new stoichiometric possibilities (Fig. 1 and Sect. 3.3.2), giving a water column rate for the Eastern Tropical Pa-cific of 75 Tg N a−1 and a total water column rate for the
three regions with the largest volumes of suboxic water of 135 Tg N a−1.
3.3.2 Interpreting excess N2data
Because they represent a challenge to conventional wis-dom, it may be useful to discuss the excess N2 values fur-ther. Firstly, it is worth noting that the original observa-tions reported in Codispoti et al. (2001) have been repeated on subsequent cruises, and that the excess N2 values are
calculated from the differences between nitrogen/argon ra-tios found within the Arabian Sea’s quasi-permanent sub-oxic water mass and Arabian Sea values found outside of the suboxic waters. This approach leads to values that should
be relatively free of complications such as bubble injection and supersaturations arising from mixing of water masses (see Devol et al., 2006a and b). Secondly, it is also un-likely that the “extra” excess N2(i.e. the amount that exceeds that predicted by the nitrate deficit) in the Arabian Sea is strongly influenced by sedimentary denitrification (Gruber, 2004) for the following reasons. 1) Sedimentary denitrifi-cation is widespread, and the sediments underlying suboxic water masses comprise<3% of the total oceanic sedimentary area (Menard and Smith, 1966). 2) Since the excess N2 es-timates are based on differences between N2/Ar ratios from just outside and within the suboxic waters, it is only local sedimentary denitrification that should impact these values. 3) Estimates of denitrification in sediments in contact with the three major suboxic denitrification zones are low rela-tive to the water column rates, partially because of the small sedimentary areas in contact with these water masses. Codis-poti and Packard (1980) suggest a rate of 2 Tg N a−1for sed-iments in contact with the suboxic waters found in the East-ern Tropical South Pacific. Codispoti (1973a) points out the small area of sediment in contact with suboxic waters in the ETNP. Devol et al. (2006a) suggest a potential sedimentary denitrification rate in sediments in contact with the suboxic waters in the Arabian Sea of 3.9 Tg N a−1and much of this would occur outside the depth range and horizontal extent of the quasi-permanent suboxic zone. 4) Maximum N2excesses occur at the same depths as the15N-nitrate maxima that are a signal of water column denitrification since fractionation of nitrate during sedimentary denitrification is minimal (Bran-des and Devol, 2002; Sigman et al., 2003). 5) Although both approaches are probably underestimates because of inade-quate accounting for the conversion of organic-N and am-monium to N2, water column denitrification rates estimated from15N incubations, and electron transport activities (ETS) as reported by Codispoti and Packard (1980); Codispoti and Richards (1976); Naqvi and Shailaja (1992); and Devol et al. (2006b) are in fair agreement with nitrate deficit residence time and transport based estimates (e.g. Bange et al., 2005; Codispoti and Richards, 1976). 6) maximum nitrite concen-trations that are a signal of canonical denitrification in sub-oxic waters (Codispoti and Packard, 1980) often occur off-shore, separated from the coast (e.g. Codispoti, 1973a and b; Naqvi, 1994). It is unlikely, therefore, that sedimentary deni-trification contributes more than∼5% to the excess N2signal observed in the Arabian Sea.
al., 2002), a supply of high N/C organic matter due to lo-cal nitrogen fixation, etc. These authors also suggest that an ammonium flux from the sediments into suboxic waters might encourage the anammox process and might also help to explain the high excess N2/nitrate deficit. This can only be true, however, if the nitrate deficits and N* do not record this signal. Gruber (2004) pointed out that the original sug-gestion by Codispoti et al. (2001) was flawed because they discussed an ammonium flux arising from the activities of lithotropes that gain energy by oxidizing sulfide with nitrate that they obtain from suboxic water. These bacteria thrive at the interface between suboxic waters and sediments (Fossing et al., 1995; Jørgensen and Gallardo, 1999). Since the result-ing ammonium arises from water column nitrate, the signal should by contained in stoichiometric parameters such as N*. Nevertheless, there are reasons to speculate that ammonium fluxes from the sediments into the suboxic waters of the Ara-bian Sea coupled with anammox do contribute to the “extra” excess N2that is observed. For example, Schulz and Schulz (2005) have shown that the bacteria that oxidize sulfur with nitrate off southwest Africa (T. namibiensis) also sequester large amounts of phosphate which they suggest contributes importantly to phosphorite formation. Such a removal of phosphate from the water column would reduce the deni-trification signal recorded by N*. In addition, ammonium fluxes out of the sediments arise from the totality of sub-oxic/anoxic respiratory processes (Graco et al., 2005; Zitz-mann and Br¨uchert, 2005), and suboxic sediments are known sites of enhanced phosphorite deposition (Piper and Codis-poti, 1975; Ganeshram et al., 2002). Thus, it is possible that the ammonium flux from suboxic sediments produces some N2that is not recorded by N* or the Codispoti et al. (2001) nitrate deficit.
3.3.3 Water column denitrification outside the boundaries of major suboxic water masses
The estimated denitrification rate for the water column of the Arabian Sea discussed does not include denitrification asso-ciated with seasonal hypoxia/suboxia/anoxia found over the West Indian Shelf. Naqvi et al. (2006a) estimate a denitrifica-tion rate for this region of 1.3–3.8 Tg N a−1based on nitrate
consumption. Because the other pathways to N2that lead to
the “extra” excess N2found in the deep Arabian Sea are not included, this estimate may be conservative. In addition, the estimates based on ETS and15N incubations for the Arabian Sea discussed in Sect. 3.3.1 do not include episodic occur-rences of suboxic waters containing nitrite along the Omani Coast including the entrance to the Gulf of Oman (Morri-son et al., 1998). They also exclude the possibility of water-column denitrification within the Gulf of Oman’s water col-umn. Similarly, although Codispoti and Packard (1980) in-cluded sites outside of the main suboxic zone in the eastern tropical South Pacific, they did not consider the possibility of denitrification in waters south of∼25◦S, but recent studies
suggest that seasonal/episodic suboxia can occur at least as far south as∼36◦S (Far´ıas et al., 2004).
Another known site of water column suboxia and den-itrification occurs off the coast of Namibia. Kuypers et al. (2005), suggest an N2production rate of 1.4±1 Tg N a−1 for this region. Kuypers et al. (2006) also suggest a rate of ∼0.3 Tg N a−1for the suboxic transition waters that lie be-tween the oxic and anoxic layers in the Black Sea. Some denitrification must occur in the suboxic transition zone of the Cariaco Basin (Scranton et al., 2006), although probably at a much smaller overall rate than in the Black Sea. Total denitrification in the Baltic is∼0.5–1 Tg N a−1(Voss et al., 2005) of which 10–20% may take place in suboxic portions of the water column and the rest in sediments (e.g. Shaffer and R¨onner, 1984). Denitrification is also known to occur in the water columns overlying California Borderland Basins (Liu and Kaplan, 1989). In the Santa Barbara Basin most (∼75%) of the denitrification appears to occur in the sedi-ments, but the water column rate (per unit volume) is com-parable to that found in the suboxic waters of the eastern tropical North Pacific (Sigman et al., 2003). Suboxic wa-ters and denitrification also occur in the Gulf of California (Altabet et al., 1999). Water column denitrification is also likely to occur during seasonal and episodic low oxygen out-breaks in coastal waters such as the shelf adjacent to the delta of the Mississippi River (Rabalais et al., 2000; Rabalais and Turner, 2006), and the northwestern Black Sea Shelf (Zait-sev, 2006). With increasing eutrophication of coastal waters, such outbreaks may be on the increase. In addition, there are several regions of the ocean that contain water masses “on the verge” of suboxia such as the Bay of Bengal (Helly and Levin, 2004) where one might expect episodic water col-umn denitrification. Small contributions are also likely in the suboxic transition zones between oxic waters and anoxic hot brines such as found in the Orca Deep (Van Cappellen et al., 1998) and Bannock basin (Daffonchio et al., 2006).
Then we have the contributions from denitrifying envi-ronments within the oceanic water column that have not yet been given much consideration. It is known, for example, that denitrification can proceed in the presence of dissolved oxygen (Codispoti et al., 2005; Zehr and Ward, 2002), and there are data that suggest that denitrification occurs within particles suspended in low oxygen (but not suboxic) waters (Wolgast, 1998; Kuypers et al., 2005). There are also some suggestions that this process can occur in well-oxygenated water (Michotey and Bonin, 1997, Li et al., 2006). Given that suboxic waters comprise only∼0.1–0.2% of the oceanic volume, denitrification, even at low rates, at higher oxygen concentrations has the potential to greatly increase the total rate of water column denitrification.
overall denitrification rate in the hydrothermal circulations associated with mid-ocean ridges/flanks exists, but Schultz and Elderfield (1977) suggest that the annual hydrothermal flow associated with ridges and ride-flanks is 2.4×10¹⁶kg. If one assumes that complete denitrification occurs in this en-tire flow and that the original nitrate concentration is 30µM, a denitrification rate of∼10 Tg N a−1results. Is this a wild over-estimate? Maybe, but perhaps we should take a system-atic look.
Denitrification has also been shown to occur in brine pock-ets in Arctic and Baltic sea ice (Rysgaard and Glud, 2004; Kaartokallio, 2001, 2005). Rysgaard and Glud suggest in-tegrated rates ranging from 10 to 45µM-N m−2d−1. With an average annual sea ice-extent of 19–29×106km2 (Glo-ersen et al., 1992) these values yield a denitrification rate of 1–7 Tg N a−1.
Finally and importantly, some nitrogen fixation occurs in proximity to denitrification (Brandes et al., 1998; Deutsch et al., 2007), and to the extent that the signals overlap, denitri-fication rate estimates based on excess N2and nitrate deficit signals may underestimate the actual (gross) denitrification rate. From the above discussion and data, it would seem that
one can erect the hypothesis that oceanic water column den-itrification is 150 Tg N a−1or higher.
3.4 A sedimentary denitrification of 300 Tg N a−1or more? 3.4.1 Data-based sedimentary denitrification rate estimates The history of estimates for oceanic sedimentary denitrifica-tion has evolved in steps: the original stasis was disrupted by the realization that coupled nitrification-denitrification (e.g. Codispoti and Christensen, 1985; Grundmanis and Murray, 1977) required an upward revision in rates, and this was fol-lowed by the recognition that direct estimates of N2 produc-tion in sediments yielded rates much higher than existing lit-erature values based on pore water profiles. Given the rapidly evolving understanding of the multiple microbially mediated pathways to N2 (Fig. 1) that, in turn, lead to uncertainties in the stoichiometry of sedimentary denitrification, it seems wise to emphasize estimates based on direct determination of N2fluxes.
Devol (1991) suggested that direct measurements of N2 fluxes from the eastern North Pacific shelf and upper slope were 4-5 times greater than those estimated by indirect meth-ods prevailing at that time. His shelf values (<150 m) when scaled up to the world-wide shelf area (Menard and Smith, 1966) yield a shelf-sediment denitrification rate of ∼500 Tg N a−1. A subsequent study with additional data (Devol and Christensen, 1993) suggested that the nitrate in-flux to the sediments accounted for only ∼40% of the to-tal denitrification rate, and, scaled up to the world-wide shelf area, yielded a rate of>440 Tg N a−1. Similar sedi-mentary N2flux data from the Bering, Chukchi and Beau-fort shelves taken in late summer and early spring (heavy
ice, pre-bloom) scale up to a world-wide shelf estimate of 170 Tg N a−1(Devol et al., 1997), and sedimentary N
2 flux data from the mid-Atlantic Bight (Laursen and Seitzinger, 2002) scale up to a global shelf rate of∼235 Tg N a−1. Note that the 0–200 m (shelf) sedimentary area comprises only 7.5% of the total area of oceanic sediments (Menard and Smith, 1966)!
Devol and Christensen (1993) present N2flux values from depths between 200–635 m When scaled up to the world-wide area of sediment between 200 and 1000 m their val-ues give a rate of>100 Tg N a−1. This depth range com-prises only 4.4% of the total oceanic area (Menard and Smith, 1966). Lehmann et al. (2005) suggest a minimum rate of 1.3 Tg N a−1for the abyssal Bering Sea (>2000 m) based on
nitrate deficits. Devol and Christensen’s data suggest that it
might be appropriate to multiply this rate by 2.5 which would yield a total rate of 3 Tg N a−1for abyssal Bering Sea sedi-ments. If we can scale abyssal denitrification as proportional to sedimentary oxygen consumption rates (Jahnke, 1996), one can find an abyssal area with rates similar to the Bering Sea that is∼10 times as large (Jahnke, 1996; SCOR, 2003). This would give a rate of 30 Tg N a−1for∼3% of the ocean sediments at depths>2000 m. If we assume that rates in the remaining 97% of the abyss average 1/10 of the Bering Sea rate, we obtain a total abyssal rate of∼130 Tg N a−1.
Admittedly, most of these data come from productive re-gions, but this foray through the literature suggests that an estimate of 300 Tg N a−1or more for the global oceanic sed-imentary rate can be defended, particularly since the 1000– 2000 m depth range has not even been included!
3.4.2 Sedimentary denitrification rate estimates from the Middelburg et al. model
the 318 Tg N a−1model run. In addition, the direct N
2
con-tributions of Thiomargarita, Thioploca, Beggiatoa (Fossing et al., 1995; Schulz and Schulz, 2005; Zitsman and Br¨uchert, 2005) and other sedimentary bacteria that oxidize reduced sulfur compounds with nitrate have yet to be explicitly ad-dressed vis a vis the oceanic sedimentary denitrification rate. Finally, the bacteria that use nitrate or nitrite to oxidize am-monium and sulfide, etc. are lithotropes that may be net
pro-ducers of organic matter within the sediments.
Middelburg et al. (1996) compared their data with exper-imental estimates and suggested that the “model-predicted denitrification rates are rather conservative estimates of the true rates” since the modeled rates were generally lower than reported rates. In addition, they noted that many of the re-ported rates were probably low because they were not based on direct determinations of N2(Devol, 1991). Their model results also depended strongly on a labile C supply that de-cays exponentially with depth. While this is a reasonable assumption there are “short circuits” that lead to enhanced downwards C fluxes. For example, high abyssal denitrifica-tion rates in Bering Sea sediments are associated with down-wards transport (Lehmann et al., 2005) that may enhance the supply of labile C to the abyss. Similarly, canyon dynamics and lateral transport may enhance the abyssal C supply near basin margins (e.g. Jahnke and Jahnke, 2000; Moran et al., 2005). In addition, the lithotrophic productivity associated with hydrothermal vents and cold seeps, would cause local violations of the exponential decrease in the labile C supply with depth, as would lithotrophy within sediments. Primary production remains as the single most important source of the downwards flux of labile C, and estimated rates of pri-mary production have tended to increase with time. For ex-ample, recent observations in the Arctic reveal a previously under-appreciated “hotspot” for primary production in Bar-row Canyon (Hill and Cota, 2005).
3.4.3 Additional sedimentary denitrification sites
Recent studies suggest that coarse (silty and sandy) nearshore sediments that were previously discounted as sites of en-hanced respiration because of low organic carbon contents, may be sites of high respiration including denitrification (Jahnke, 2006; Middelburg et al., 2005; Rao and Jahnke, 2006). Seasonal oscillations in water exchange between aquifers and the coastal ocean (Michael et al., 2005) might, in effect, expand coastal denitrifying sediments landward. In addition, there has been considerable recent interest in microbial activities that can be found deep in marine sedi-ments (Parkes et al., 2005). Suboxic electron acceptors can be found more than 100m below the surface in sedimentary columns presumably as a consequence of water circulating through the underlying basement rock (Hondt et al., 2004) that supplies oxygen and nitrate producing an “upside-down” redox profile (Law, 2004). There has yet, to be an attempt to assess the overall impact of these processes.
3.4.4 Implications of isotope budgets
Whole ocean N isotope budgets, have a time-scale similar to the∼103 year turnover time for fixed-nitrogen. Because∼ century-scale human impingement has dramatically effected continental shelf ecosystems where much of the sedimentary denitrification occurs (e.g. Watling and Norse, 1998), apply-ing ratios based on global-scale isotope budgets to
present-day denitrification is problematic. Moreover, at the moment,
we can only speculate on the fractionation that occurs dur-ing the oxidation of organic-N and ammonium to N2and for some of the other pathways shown in Fig. 1. Brandes and Devol (2002) suggested a sedimentary denitrification rate of 280 Tg N a−1for the Holocene based on a global oceanic iso-tope budget for fixed-N . Major factors in their analysis were the high fractionation of N associated with canonical water column denitrification, the very low fractionations associated with sedimentary denitrification and nitrogen fixation, and an estimate of 75 Tg N a−1 for canonical denitrification in the water column. While these results seem to suggest that a wa-ter column rate of 150 Tg N a−1would lead to an impossibly high sedimentary denitrification rate, this is not necessarily the case. because a portion of water column N2production arises from oxidation of labile organic-N and ammonium. These pools tend to be depleted, so little or no isotope frac-tionation should occur, and it may be reasonable to assume that this portion of water column denitrification behaves like sedimentary denitrification with respect to fractionation of nitrogen isotopes. Because of this, it may be useful to re-name the Brandes and Devol (2002) ratio (3.7) for sedimen-tary to water column denitrification as the “unfractionated (sediments + water)/fractionated” denitrification ratio.
“un-fractionated” denitrification. With Gruber and Sarmiento’s (1997) and Van Mooy et al’s stoichiometries for canonical denitrification the ratios are 0.13 and 0.21 respectively. Dur-ing the anammox reaction in which nitrite oxidizes ammo-nium to N2 this ratio is 0.5, but the ammonium and nitrite presumably arise largely from heterotrophic activity includ-ing canonical denitrification. Takinclud-ing the average of Gruber and Sarmiento’s ratio and the ratio during anammox gives a ratio of 0.32. Much more research is needed before any-thing definitive may be said about this ratio, but, for now, we will assume that unfractionated/total water column deni-trification ratio is 0.38 ((0.43+0.32)/2). With a ratio of 0.38 and a total water column denitrification rate of 150 Tg N a−1 “unfractionated” water column denitrification is 57 Tg N a−1, and fractionated water column denitrification is 93 Tg N a−1. Deutsch et al. (2004) suggest that Brandes and Devol’s (2002) unfractionated(sediments+water)/fractionated deni-trification ratio of 3.7 should be reduced to 2.7 due because of isotope dilution. Lehman et al. (2004), on the other hand, suggest that release of “heavy” ammonium from sediments might make Brandes and Devol’s ratio an underestimate. Al-tabet (2006) suggests that the ratio in the Arabian Sea could be∼1, but when the water column denitrification that is un-fractionated is taken into account his ratio is∼1.8. Inspec-tion of the potential nitrate values that should exist before the onset of denitrification (Codispoti, 1973a and b; Codis-poti and Richards, 1976), and relationships between nitrate deficits and ambient nitrogen concentrations in the Arabian Sea, suggest that Altabet and Deutsch et al.’s estimates of the impact of isotope dilution on reducing the Brandes and De-vol ratio may be too large. Ultimately this will depend on details of the distributions of nitrate, nitrate deficits and den-itrification rates that require additional study. Finally, to the extent that local nitrogen fixation is enhanced in the vicinity of suboxic waters (Deutsch et al., 2007), the resulting local supply of isotopically light nitrate, might cause underesti-mates in the fractionation that occurs during water column denitrification necessitating an increase in the unfractionated (sediments+water)/fractionated ratio (Naqvi, 2007). Thus, it might be reasonable to suggest that the true unfractionated (sediments + water)/fractionated denitrification ratio for the Holocene is probably between 2 and 4.
Taking unfractionated denitrification to be 357 Tg N a−1 (300 Tg N a−1 in sediments and 57 Tg N a−1 in the wa-ter column), and fractionated wawa-ter column denitrification to be 93 Tg N a−1 yields an unfractionated (water + sedi-ments)/fractionated ratio of 3.8. Given all of the uncertain-ties, all that can be said is that the values selected in this pa-per for water column and sedimentary denitrification are not in gross conflict with present knowledge about the oceanic isotopic budget for fixed-N. Because the ratio of 3.8 is on the higher side of the estimates, one might speculate that an-thropogenic impingement on the coastal ocean during the Holocene-Anthropocene transition has increased sedimen-tary denitrification faster than the corresponding increase in
water column denitrification.
3.4.5 Sedimentary denitrification rates vs the oceanic fixed-N budget
To conclude this section, it seems reasonable to suggest that the weight of the evidence supports an oceanic sedimentary denitrification rate of>300 Tg N a−1. Even if the sedimen-tary rate was only 200–250 Tg N a−1, however, it would not solve the problem of a deficit in the oceanic fixed-N budget (Table 1) that could not be maintained for more than a few hundred years without challenging current interpretations of the atmospheric CO2 record (Gruber and Sarmiento, 1997) and the 15N record in sediments (Altabet, 2002 and 2006; Deutsch et al., 2004). While the author favors an estimate of>300 Tg N a−1after a consideration of the history of esti-mates and his knowledge of ongoing research, there is clearly room for debate and for considerably more research on sed-imentary denitrification, potentially the largest sink in the oceanic fixed-N budget.
3.5 Interpretation of the oceanic N/P ratio
15 /1
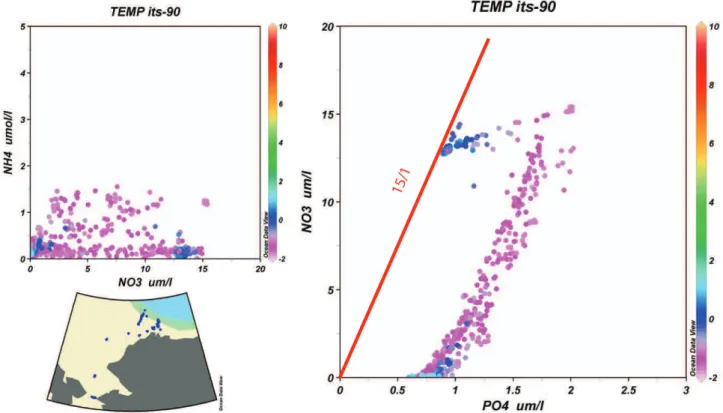
Fig. 2a. Nitrate-ammonium and nitrate-phosphate scatter diagrams (concentrations inµM) from data collected in the Chukchi Sea during May-June 2004 (U.S.C.G.C. Healy, cruise HLY 04-02). Station locations are shown in the inset chart. Water temperature color scale is on the right.
scatter diagrams (e.g. Tyrell, 1999) to amplify this argument, since, on average, the phosphate intercept at 0 nitrate is only ∼0.25µM. With an atomic N/P ratio of 16 this corresponds to∼4.0µM of fixed-N.
Whether or not an average nitrate deficit of∼4.0 should be considered to be small relative to concentrations within 100 m of the photic zone is debatable. Nevertheless, Red-field’s original idea has merit, and must help the ocean main-tain a balance over some time-scale. Is the time scale dom-inated by biological processes acting in close proximity or must these processes be coupled, at least partially, by ocean circulation as suggested by the existence of ocean basins with significantly different N/P ratios (e.g. Fig. 2), and the studies of Broecker and Peng (1982), Coles and Hood (2006), Codis-poti (1989), and Yamamoto-Kawai (2006)? Once, we admit that, on average, there is a time-lag in the coupling of deni-trification and nitrogen fixation that requires some coupling via oceanic circulation a suite of questions arises including: How do regional differences in N/P ratios impact the quality of primary production and particle export from the surface ocean?, and how large a fixed-N deficit can develop before the system arrives at a new steady-state?
3.5.2 Multiple controls on nitrogen fixation
1
5
/1
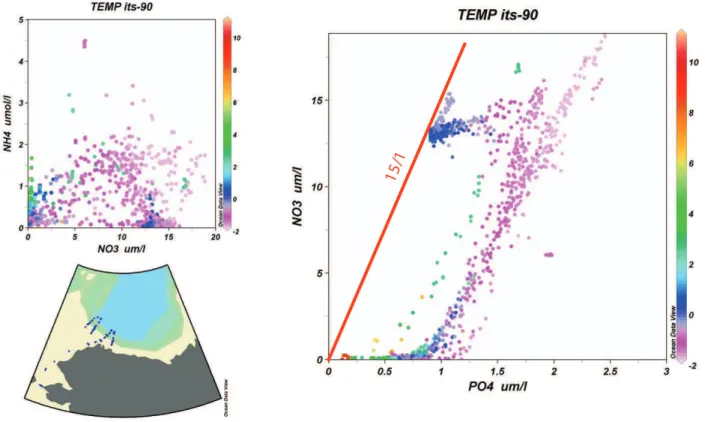
Fig. 2b. Nitrate-ammonium and nitrate-phosphate scatter diagrams (concentrations inµM) from data collected in the Chukchi Sea during July-August 2004 (U.S.C.G.C. Healy, cruise HLY 04-03). Station locations are shown in the inset chart. Water temperature color scale is on the right.
Gruber and Sarmiento, 1997; Karl et al., 1997). These facts suggest that nitrogen fixation does not respond to an excess of phosphate in a simple fashion and that nitrogen fixation may continue beyond the point at which the Redfield ratio of 16/1 is attained. Since the factors that govern phosphate, and iron concentrations, and water temperature differ, it is likely that the processes that permit nitrogen fixation to compensate for losses of fixed-N are complex and, may take longer than might be inferred from the original Redfield proposal.
3.5.3 Interpreting intercepts
There is considerable regional variability in the values of nitrate and phosphate intercepts in scatter diagrams of the two variables. We can find positive nitrate intercepts in the Mediterranean Sea and in portions of the North Atlantic (e.g. Wu et al., 2000), and we can find phosphate values at 0 inorganic-N much higher than 0.25µM in regions such as the Peruvian Upwelling and the Chukchi and East Siberian seas (Fig. 2; Codispoti et al., 1991). Positive nitrate intercepts at 0 P are often attributed to nitrogen fixation. High phosphate values at 0 inorganic-N can reasonably be attributed to the effects of far-field and local denitrification. In the Chukchi Sea, Pacific waters entering via Bering Strait are already de-ficient in inorganic-N as a consequence of external
denitrifi-cation, and additional denitrification occurs locally (Devol et al., 1997).
the N/P ratio diagrams are not likely to change greatly if data near the intercepts were omitted.
3.5.4 Variability in N/P ratios?
Chukchi Sea/Canada Basin data (Fig. 2) provide an inter-esting juxtaposition of regional differences in N/P ratios be-cause the Pacific waters that occupy the upper∼150 m over-lie deeper waters that change little with respect to their nutri-ent concnutri-entrations and ratios since nutri-entering the Arctic Ocean from the North Atlantic(Codispoti et al., 2005). Thus, we have waters in the upper ∼150 m that have ratios of ni-trate/phosphate<10 with a slope (1nitrate/1phosphate) of <13, overlying Atlantic waters with ratios of∼15. In con-trast to the low ratios in waters that contain a net denitrifica-tion signal such as the Chukchi Sea, several regions where nitrogen fixation is thought to be important have high ratios. For example, regeneration ratios (1nitrate/1phosphate) in the Red Sea exceed 20 (Naqvi et al., 1986); N/P ratios in sinking particulate matter during a∼decadal period of net nitrogen sequestration at the HOTS time-series station in the North Pacific subtropical gyre N/P were generally>16/1 and at times>40 (Karl et al., 2001); and nitrate/phosphate ratios in the Mediterranean Sea increase from∼22 to 28 (Krom et al., 1991; Krom et al., 2004 and 2005) proceeding eastward from the Alboran Sea to the Cyprus Eddy. Finally, phos-phate limitation is more prevalent in fresh water (including pristine fresh water lakes) than in the ocean (Howarth, 1988; Howarth and Marino, 2006, Falkowski, 2003). This raises the question of why the ocean is generally deficient in N and lakes deficient in P if one takes the view that a small excess of P is all that is required to maintain “Redfieldian” N/P ratios. The above considerations raise the issue of the constancy of N/P ratios, and whether Redfield’s (1958) interpretation that the plankton control rather than respond to the oceanic nitrate/phosphate ratio (see Falkowski, 2000) is correct. The results that we have reviewed, so far, suggest that it is possi-ble for nitrogen-fixers to produce organic material with N/P ratios higher than the Redfield ratio of 16/1. What about the rest of the phytoplankton? We have already noted the phe-nomenon of “luxury consumption”, but this process does not export large amounts of organic material, and therefore does not have large impact on observed subsurface regeneration ratios. After a literature review, Codispoti (1989) concluded that with possible exceptions in coastal waters, there was considerable evidence for an average oceanic phytoplankton uptake ratio and a regeneration ratio close to 16:1. Even if we examine the data from the Chukchi Sea where consid-erable excess phosphate seems to exist, the “low” regener-ation ratio (<∼13:1) can reasonably be attributed to the ef-fects of sedimentary denitrification suggesting a ratio in the material exported from the photic zone during the growing season similar to 16:1. These observations contrast with an accumulation of data suggesting that phytoplankton groups can have uptake rates that stray far from the canonical
Red-field ratio. For example, empirical laboratory data suggest that phytoplankton can be divided into superfamilies (Quigg et al., 2003) with markedly different N:P and C:P ratios and smaller but still significant differences in C:N ratios. Lab-oratory studies also suggest differences in N:P ratios that may arise from physiological variables (e.g. Klausmeier and Litchman, 2003). Field studies can produce similar results. For example, Arrigo et al. (1999) found an overall disappear-ance (∼uptake) ratio in nitrate and phosphate replete Antarc-tic waters close to the Redfield ratio, but when they broke down their data regionally, they found a Phaeocystis domi-nated community with a nitrate/phosphate disappearance ra-tio of∼19 and a diatom dominated community with a ra-tio of∼10. This study was followed by that of Sweeney et al. (2000) who found similar results early in the growing sea-son, but found that, as the growing season progressed, ratios in the diatom dominated community became more “Redfiel-dian”. These observations are in line with suggestions (Ar-rigo, 2005; Klausmeier et al., 2004) that nutrient ratios in phytoplankton can be affected by growth strategies and ad-justment to environmental conditions in addition to the al-ready noted “familial” differences. Arrigo (2005) suggested that “survivalists” have high N:P ratios, “bloomers” low N:P ratios, and “generalists” ratios close to the canonical Redfield ratio. Since diatoms in the Ross Sea early in the growing sea-son should be in the “blooming” mode, their low N:P ratios could, in hindsight, be anticipated. Klausmeier et al.’s (2004) views are similar, but they also noted that P-limited environ-ments favor slightly less P allocation to assembly than N-limited or light-N-limited environments. Their model predicted that optimal phytoplankton N:P ratios could vary from 8.2 to 45.0, and structural ratios from 7.1 to 43.3, with a median of 17.7, tantalizingly close to the canonical Redfield ratio. They suggest that “.... the canonical Redfield N:P ratio of 16 is not a universal biochemical optimum, but instead represents an average of species-specific N:P ratios.” They also discuss the particularly high ratios in nitrogen-fixing species, noting an N:P range of 42–125 for Trichodesmium blooms. They also provide a mechanistic explanation for the high N:P and N:C ratios in nitrogen fixing phytoplankton that involves the need for more light-harvesting N rich machinery to power N fixa-tion. They conclude that the Redfield ratio is not a universal value based on either empirical data or their model, that it is possible that N:P ratios in the ocean could vary over time and that Broecker and Henderson’s (1998) suggestion that the ra-tio could rise to 25 during glacial periods due to a higher iron supply is possible.
Here, we will take the position that the ocean-wide sinking flux of organic material in today’s ocean is close to 16:1, and that nutrient replete “communities” do tend to export organic material with an N:P ratio similar to the canonical Redfield ratio. Given the high N:P ratios associated with nitrogen-fixation, however, one can wonder if an ocean in which
and Henderson (1998; see also, Wolff et al., 2006) suggest that such conditions could arise from stimulation of nitrogen fixation by an increased iron supply during glacial periods. Evidence from the present-day Eastern Mediterranean sug-gests that the high nitrate/phosphate ratio in the deep water (25–28) may arise from a high N/P ratio in inputs and lim-ited denitrification (Krom et al., 2004 and 2005), and there is evidence to suggest that denitrification was reduced during glacial periods (e.g. Altabet et al., 2002; Christensen et al., 1987; Deustsch et al., 2004; Ganeshram et al., 2002). Thus, it is possible that the overall oceanic N:P ratio can fluctuate significantly. A reasonable range might be∼14–25, values that can be found within large basins in today’s ocean.
Accurate and comprehensive nitrate/phosphate ratios for the world ocean have only been available for the last∼50– 75 yrs, a period of considerable global change. What if these ratios slowly change and could have been higher in the past? A Gedankenexperiment that has the nitrate/phosphate ratio decrease from 25 to 15, would decrease nitrate con-centrations by 20µM (30/2=15; 50/2=25) if we hold the mean phosphate concentration constant, take 15 as the av-erage nitrate/phosphate ratio in today’s ocean and employ an average oceanic nitrate concentration of∼30µM (Gru-ber and Sarmiento, 1997). With an oceanic volume of 1.35×10¹⁸m3 (Menard and Smith, 1966) and recognizing that 20µM=20 millimoles m3=0.28 g N m3, we arrive at a to-tal nitrate removal of 400 000 Tg N, an amount that could sustain the imbalance in our “pro forma” budget (Table 1) for∼2000 years!
3.5.5 Concurrent changes in P&N sinks may help stabilize N/P ratios
Piper and Codispoti (1975) suggested that increased denitri-fication might be associated with increased phosphate depo-sition in the form of phosphorite (mainly carbonate fluorap-atite or CFA). Much has been learned about denitrification and about oceanic P deposition since the time of that pa-per, but the following quote is still worth considering. “Ul-timately any impoverishment of combined nitrogen, caused by increased denitrification should cause marine nitrogen fix-ation rates to rise or should cause respirfix-ation rates at depth in the ocean to decrease because of reduced primary produc-tivity, or both. Over geologic time, the nitrogen/phosphorus ratio may be maintained reasonably constant by such a feed-back mechanism in the nitrogen cycle, aided by the increased
phosphorite precipitation which according to our proposal should accompany increased denitrification.” (italics added).
At that time, most of the identified denitrification in the ocean, was associated with suboxic waters, and Piper and Codispoti (1975) noted the association of such waters in the Eastern Tropical Pacific with phosphorite deposits. Phospho-rus diagenesis is complex, and some experiments have been interpreted as suggesting an enhanced P flux from such sedi-ments (e.g. Ingale and Jahnke, 1994). Such observations tend
to be at variance with other studies. For example, Comp-ton et al. (2000) suggest that the Peru/Chile margin is the site of a “phosphorite giant” formation and that the present-day burial fluxes of P are high there and on the SW African Shelf, another site of water column denitrification (Kuypers et al., 2005 and 2006). Babu and Nath (2005) show that P is enriched in sediments within the depth range of the OMZ in the Arabian Sea, and Schulz and Schulz (2005) present exciting results from the Namibian shelf suggesting that the nitrate-reducting/sulfide-oxidizing bacterium Thiomargarita
namibiensis can sequester large amounts of phosphate and
enhance phosphorite deposition. They suggest that close rel-atives such as Beggiatoa spp. that is also abundant in Namib-ian sediments, and Thioplaca spp. that occur in the up-welling zone off Chile and Peru may have a similar enhanc-ing effect. One can muse on the short-term effect of a “bot-tom lander” impact on bacterial mats that are rich in P. Con-fusion may also arise because anoxia and suboxia have quite different impacts on the oxidation state of iron. At the sub-oxic/anoxic interface in the Black Sea, for example, we see a phosphate minimum in the suboxic zone presumably from the uptake of P by particles formed via the oxidation by ni-trate of reduced Fe and Mn that diffuses into the layer from the suboxic zone (Codispoti et al., 2005). Ganeshram et al.’s (2002) analysis of a core taken beneath suboxic waters in the Eastern Tropical North Pacfic suggests that the heavyδ15N arising from water column denitrification occurs during in-terglacials and that P enriched layers in the sediments were also confined to the interglacials. They suggest similar condi-tions for the Arabian Sea and Peru margins. We believe that the weight of the evidence does suggest a positive correlation between water column denitrification and phosphorite depo-sition. Because the glacial-interglacial changes in phospho-rite deposition that Ganesharm et al. (2002) estimated were relatively small (equivalent to∼3 Tg N a−1using a 16/1 N/P atomic ratio) compared to the sink and source terms in the oceanic fixed-N budget (Table 1), their view was that this process had only a small impact on the oceanic N/P ratio, and a major point of their paper was that phosphate limita-tion would limit postulated increases in glacial nitrogen fix-ation assuming a constant Redfield ratio. With respect to the oceanic N/P ratio and the suggestion of Piper and Codispoti (1975), this process would, indeed, help to maintain a con-stant ratio, but the effect would be small. One question worth investigating, however, is whether the estimates of the mag-nitude of the changes in phosphorite deposition in sediment underyling suboxic waters might need to be revised in light of the results of Schulz and Schulz (2005).
a Redfield atomic N/P ratio of 16) translates into a deficit 9–31 Tg N a−1. They suggest, “This situation would re-quire a transient oceanic or terrestrial source term that po-tentially dominated during glacial periods, but not during in-terglacials.”
To conclude, it is quite possible that increases in oceanic P removals may accompany increased denitrification and help to stabilize the oceanic N/P ratio, but whether the effect is minor or moderate will require further study.
3.6 The atmospheric carbon dioxide and sedimentary15N constraints
Gruber and Sarmiento (1997) suggested that deficits of ∼100 Tg N a−1 in the post-glacial oceanic combined nitro-gen budget maintained for a thousand years would deplete the oceanic fixed-N inventory by∼30% and change atmo-spheric CO2 by 50 ppm, an amount that exceeds the ob-served variability during the entire Holocene. This argument is worth considering, but there are some complications that they did not consider explicitly. For example, they did not ac-count for compensating changes in terrestrial sequestration, or for the possibility that C/N uptake ratios can vary. As outlined above, photosynthetic nitrogen-fixers have N:P and N:C ratios that are high relative to “Redfieldian” plankton. If the ocean can oscillate between strong and week nitrogen fix-ing phases such that the average N:P ratio can attain values of 20–25, during strong nitrogen fixation, the amount of C sequestered per N would decrease (see Sect. 3.5.4), and this would dampen the effect on the atmospheric carbon dioxide record.
Another potential constraint on the oceanic fixed-N bud-get of the ocean arises from the sedimentary δ15N record (Altabet, 2006). This record appears to undergo glacial-interglacial (orbital forcing) and∼millenium scale variabil-ity during glacial Dansgaard-Oeschger events (Altabet et al., 2002). Theδ15N record, during the Holocene, however, is more constant. Altabet (2006) suggests that to maintain con-stancy in the sedimentaryδ15N signal in the face of signif-icant changes in the oceanic fixed-N inventory requires the unlikely condition that the ratio of water column to sedimen-tary denitrification remains constant during such changes. Once again, the basic idea has merit, but there are a num-ber of complications. As already noted, a substantial fraction of water column denitrification may behave like sedimentary denitrification (see Sect. 3.4.4.), and the distinction should be between those fixed-N sinks that have a large impact on15N enrichments of the remaining fixed-N and those that have a small effect. In today’s ocean, we can occasionally find ex-amples of complete denitrification in the water column (e.g. Codispoti et al., 1986; Naqvi et al., 2000), although the per-centage contribution of this type of denitrification is small. What may be more important are the non-canonical water column pathways to N2(see Sect. 3.4.4). To the extent that water column N2 production mimics sedimentary
denitrifi-cation there would be an alleviation of the sedimentary15N record constraints. Moreover, the same processes that cause increases in water column denitrification (increased primary production, lower dissolved oxygen concentration) would, in many instances favor increased, sedimentary denitrification. In addition, the number of cores that have been analyzed in detail forδ15N are relatively few; there is some evidence for the occurrence of water column denitrification in the North Pacific during glaciations (Galbraith, 2006); there are diage-netic alterations ofδ15N that are not well-understood (Gal-braith, 2006); the estimates for the fractionation of NO−3 during canonical denitrification vary a bit (Brandes et al., 1998; Altabet, 2006); and given the newly appreciated path-ways for conversion of fixed-N to N2(Fig. 1) much needs to be done with regard to determining appropriate fractionation factors. In addition, Naqvi (2007) points out that although the denitrification term is larger, nitrogen fixation and deni-trification both occur at significant rates in the water column of the Arabian Sea such that theδ15N of local sediments is controlled partially by the ratio between water column
den-itrification and nitrogen fixation. Thus, while the
sedimen-tary15N record is sufficient to erect the hypothesis that the oceanic fixed-N inventory has been ∼constant during the Holocene, it would probably be unwise to fully accept this hypothesis without further substantiation, and it may not ap-ply during the Holocene-Anthropocene transition for reasons that have already been stated.
4 Reconciliation
4.1 The Conundrum
Given the relatively stable climate during the Holocene, Gruber and Sarmiento (1997), Gruber (2004), and Altabet (2006), may well be correct in asserting that the oceanic fixed-N budget is∼balanced throughout the Holocene and that if any large changes occur, they must be of a duration short enough to be averaged out in the atmospheric CO2and sedimentary N records. The data reviewed herein, however, suggest a fixed-N sink, much larger than suggested in Gruber and Sarmiento’s (1997) and Gruber’s (2004) budgets. The following factors may permit reconciliation of these appar-ently divergent views:
4.2 Increasing the estimate of the oceanic nitrogen fixation rate
the consensus estimate has increased by a factor of 4–5. Re-cently, an approximate doubling of the incubation based es-timates has been suggested in order to account for previ-ously neglected contributions of smaller sized nitrogen fixers (Montoya et al., 2004), and Davis and McGillicuddy (2006) suggest that the abundance of the larger canonical nitrogen fixer Trichodesmium has been underestimated. In addition, significant nitrogen fixation may occur in close proximity to zones of water column denitrification (Deutsch et al., 2007; Naqvi, 2007) but be difficult to detect with bulk parame-ters because the signal is swamped by denitrification. A signal does appear in some models (Deutsch et al., 2007) and in verticalδ15N-NO−3 distributions in the Arabian Sea where “light” NO−3 overlies “heavy” δ15N NO−3 (Brandes et al., 1998; Naqvi, 2007; Devol et al., 2006). Brandes et al. (1998) suggest that nitrogen fixation in the Arabian Sea is∼6 Tg N a−1or about 20% of the water column rate for canonical denitrification. Interestingly, because of the high N:P and N:C ratios during nitrogen fixation, Devol et al. (2006a) suggest that the decomposition of the biogenic material produced by this nitrogen fixation could account for ∼50% of the “extra excess N2” found in the Arabian Sea. Finally, Coles and Hood (2006) suggest that some models of nitrogen fixation based on N* will actually yield net rates of nitrogen fixation and not the gross rates employed in our bud-gets (Table 1), because of denitrification within the model do-main (e.g. sedimentary denitrification in the North Atlantic). Most direct estimates of nitrogen fixation rates in the ocean have been confined to the photic zone, yet genetic studies suggest that the capability for nitrogen fixation is widespread throughout the water column. Zehr et al. (1998), for example, have shown that the genes that support nitro-gen fixation can be found within zooplankton and that these genes differ significantly from those found in free-living ni-trogen fixers. Earlier experiments with shipworms showed that they were analogous to termites insofar as their sym-biotic flora fixed-N when they were fed a diet of wood (Carpenter and Culliney, 1975). Two quotes from Zehr et al. (1998) are worth considering: (1) “This report shows that there are far more diverse nitrogen-fixing populations and di-verse habitats which can support nitrogen fixation in the open ocean than previously documented.” and (2) “The intriguing finding that nitrogen fixation in the open ocean may occur in marine invertebrate guts is analogous to nitrogen fixation in guts of terrestrial insects and marine shipworms. Sequences of this cluster are not found in the bulk water samples, indi-cating that the organisms from which these sequences were derived may be permanent residents of the zooplankton gut and may even be symbiotic with zooplankton.”
Deep nitrogen fixation occurs in association with vent pro-cesses. For example, Mehta et al. (2003) suggest that some hydrothermal fluids have low nitrate and ammonium con-centrations, and contain nitrogen-fixing (nifH genes). More recently, Mehta and Baross (2006) demonstrated that
nitro-gen fixation can occur in low fixed-N, high temperature flu-ids associated with hydrothermal vents. In addition, we do not know enough about the microbial environments of crus-tacean guts to assert that N-fixation does not occur in the presence of significant quantities of nitrate in the ambient water. Zehr et al. (1998) point out that reduced oxygen con-centrations and high Fe concon-centrations should make condi-tions more favorable for N-fixation in copepod guts than it would be in ambient water. Zehr et al. (2006) suggest that it is clear that nitrogen fixation activity is suppressed by am-monium, but a strong case for suppression by nitrate cannot be made with available data, and they further point out the higher energetic cost of assimilating nitrate vs ammonium. Ammonium concentrations are quite low in most of the sub-100 m ocean, but we do not know, at this moment, whether high nitrate concentrations in the deep ocean would suppress fixation in crustacean guts. Another possibility is the occur-rence of nitrogen-fixation in zooplankton in oligotrophic wa-ter. One might ask, for example, what happens when cope-pods are grazing on re-cycled post-bloom low N/C ratio or-ganic matter ?
While conventional wisdom suggests that oceanic water column nitrogen fixation is concentrated in tropical and sub-tropical waters, nitrogen fixation has been found in the wa-ter/aggregate patches found in an Antarctic Dry Valley Lakes (Paerl and Priscu, 1998). To date, most oceanic studies of ni-trogen fixation have been focused on the photic zone, on au-totrophs, on subtropical and tropical waters, and to a lesser extent on shelf sediments. The question arises, therefore,
whether expanding the horizons of studies of oceanic nitro-gen fixation from photic zone hotspots, to the remaining 97% of the oceanic volume might not lead to greatly increased estimates of oceanic nitrogen fixation.
4.3 The Holocene to Anthropocene transition
address how this process might effect sedimentary denitrifi-cation. Anthropogenic additions of nutrients to the coastal ocean must also have some effect, and Naqvi et al. (2000) suggest that such inputs may have increased denitrification and led to extremely high nitrous oxide production rates over the West Indian Shelf, etc. Thus, it is not clear how
applica-ble paleo records are to an ocean that is experiencing signif-icant and unprecedented anthropogenic forcing.
5 Conclusions
A review of the literature suggests that the oceanic denitrifi-cation rate may exceed 400 Tg N a−1. The three most likely factors that could reconcile this rate with paleo records are as follows:
1. Oceanic nitrogen fixation has been significantly under-estimated.
2. There is a significant mis-match between the sedimen-tary record and ocean observations with the former largely confined to the Holocene and earlier, and the lat-ter confined to the Anthropocene: today’s ocean may be
in a transient state.
3. Century scale and shorter oscillations occur and are av-eraged out in the paleo record (Altabet, 2006; Gruber and Sarmiento, 1997).
In addition, plausible changes in oceanic N/P and N/C ra-tios could mute the effects that imbalances in the oceanic fixed-N budget would have upon the sedimentary and atmo-spheric record, and the co-occurrence of water column ni-trogen fixation and denitrification may complicate interpre-tation of the sedimentary record.
It is difficult to review the recent literature on denitrifica-tion and nitrogen fixadenitrifica-tion and not suspect that the phrase “the more we look, the more we find” will continue to apply at least for the next few decades. Given these exciting discov-eries, the need for expanding our geographic and intellectual horizons seems evident. To paraphrase a famous quote, the nitrogen cycle is more complicated than we imagined a few years ago, and perhaps more complicated than it is possible for us to imagine! More research is required to provide data and model outputs that will help our beleaguered imagina-tions!
Acknowledgements. Over my several decades of research into
the oceanic nitrogen cycle, many colleagues have generously offered advice and shared their data. I am profoundly grateful to this community of scientists. I particularly want to thank, F. A. Richards, J. P. Christensen, V. J. Coles, R. C. Dugdale, A. H. Devol, G. Friederich, R. R. Hood, V. Kelly, J. Montoya, S. W. A. Naqvi, T. T. Packard, D. Z. Piper, and T. Yoshinari for their advice and support. I also want to thank M. A. Altabet, N. Gruber and J. Sarmiento for papers that forced me to think harder about the implications of my own work. Without such exchanges, scientific
progress would be inhibited. I also thank my wife, Leocadia, for her editorial assistance. Over the years, funding for this research has come largely from the Office of Naval Research, and the National Science Foundation, and salary support has been provided by the Monterey Bay Aquarium Research Institute, and the University of Maryland Center for Environmental Science. Recent funding for research included in this paper has been provided by the National Science Foundation’s Office of Polar Programs under the aegis of the Arctic System Science Program (Grant OPP125399). I also thank R. Schlitzer for the Ocean Data View program that was used to produce Figs. 2a and b.
Edited by: J. Middelburg
References
Altabet, M. A.: Constraints on oceanic N balance/imbalance from sedimentary 15N records, Biogeosciences Discuss., 3, 1121– 1155, 2006,
http://www.biogeosciences-discuss.net/3/1121/2006/.
Altabet, M. A., Higginson, M. J., and Murray, D. W.: The effect of millennial-scale changes in Arabian Sea denitrification on atmo-spheric CO2, Nature, 415, 159–162, 2002.
Altabet, M. A., Pilskaln, C., Thunell, R., Pride, C., Sigman, D., Chavez, F., and Francois, R.: The nitrogen isotope biogeochem-istry of sinking particles from the margin of the Eastern North Pacific, Deep-Sea Res. I, 46, 655–679, 1999.
Aluwihare, L. I., Repeta, D. J., Pantoja, S., and Johnson, C. G.: Two chemically distinct pools of organic nitrogen accumulated in the ocean, Science, 308, 1007–1010, 2005.
Arrigo, K. R.: Marine microorganisms and global nutrient cycles, Nature, 437, 349–355, 2005.
Arrigo, K. R., Robinson, D. H., Worthen, D. L., Dunbar, R. B., Di-Tullio, G. R., Van Woert, M., and Lizotte, M. P.: Phytoplankton community structure and the drawdown of nutrients and CO2in the Southern Ocean, Science, 283, 365–367, 1999.
Babu, C. P. and Nath, B. N.: Processes controlling forms of phos-phorus in surficial sediments from the eastern Arabian Sea im-pinged by varying bottom water oxygenation conditions, Deep-Sea Res. II, 52, 1965–1980, 2005.
Bange, H. W.: New directions: The importance of oceanic nitrous oxide emissions, Atmos. Environ., 40, 198–199, 2006.
Bange, H. W., Naqvi, S. W. A., and Codispoti, L. A.: The nitrogen cycle in the Arabian Sea, Progr. Oceanogr., 65, 145–158, 2005. Brandes, J. A. and Devol, A. H.: A global marine-fixed nitrogen
iso-topic budget: Implications for Holocene nitrogen cycling, Global Biogeochem. Cycles, 16, 1120, doi:10.1029/2001GB001856, 2002.
Brandes, J. A., Devol, A. H., Yoshinari, T., Jayakumar, A., and Naqvi, S. W. A.: Isotopic composition of nitrate in the cen-tral Arabian Sea and eastern tropical North Pacific: A tracer for mixing and nitrogen cycles, Limnol. Oceanogr., 43, 1680–1689, 1998.
Broecker, W. S. and Henderson, G. M.: The sequence of events surrounding Termination II and their implications for the cause of glacial-interglacial CO2changes, Paleoceanogr., 13, 352–364,
1998.
![Table 1. Simplified 1 pro-forma present-day oceanic fixed-N budgets [in Tg] and the unfractionated/fractionated ratio 2 .](https://thumb-eu.123doks.com/thumbv2/123dok_br/16313257.186976/3.892.200.697.143.356/table-simplified-forma-present-oceanic-budgets-unfractionated-fractionated.webp)