www.the-cryosphere.net/7/1753/2013/ doi:10.5194/tc-7-1753-2013
© Author(s) 2013. CC Attribution 3.0 License.
The Cryosphere
Recent extreme light sea ice years in the Canadian Arctic
Archipelago: 2011 and 2012 eclipse 1998 and 2007
S. E. L. Howell1, T. Wohlleben2, A. Komarov3,4, L. Pizzolato5, and C. Derksen1
1Climate Research Division, Environment Canada, Toronto, Canada 2Canadian Ice Service, Environment Canada, Ottawa, Canada
3Department of Electrical and Computer Engineering, University of Manitoba, Winnipeg, Canada 4Centre for Earth Observation Science, University of Manitoba, Winnipeg, Canada
5Department of Geography and Environmental Management, University of Waterloo, Waterloo, Canada
Correspondence to:S. E. L. Howell ([email protected])
Received: 20 February 2013 – Published in The Cryosphere Discuss.: 28 March 2013 Revised: 10 October 2013 – Accepted: 19 October 2013 – Published: 15 November 2013
Abstract. Remarkably low mean September sea ice area in the Canadian Arctic Archipelago (CAA) was observed in 2011 (146×103km2), a record-breaking level that was
nearly exceeded in 2012 (150×103km2). These values
were lower than previous September records set in 1998 (200×103km2)and 2007 (220×103km2), and are∼60 %
lower than the 1981–2010 mean September climatology. In this study, the processes contributing to the extreme light years of 2011 and 2012 were investigated, compared to pre-vious extreme minima of 1998 and 2007, and contrasted against historic summer seasons with above average Septem-ber ice area. The 2011 minimum was associated with pos-itive June through September (JJAS) surface air tempera-ture (SAT) and net solar radiation (K∗) anomalies that facil-itated rapid melt, coupled with atmospheric circulation that restricted multi-year ice (MYI) inflow from the Arctic Ocean into the CAA. The 2012 minimum was also associated with positive JJAS SAT andK∗anomalies with coincident rapid melt, but further ice decline was temporarily mitigated by atmospheric circulation which drove Arctic Ocean MYI in-flow into the CAA. Atmospheric circulation was compara-ble between 2011 and 1998 (impeding Arctic Ocean MYI inflow) and 2012 and 2007 (inducing Arctic Ocean MYI in-flow). However, preconditioning was more apparent leading up to 2011 and 2012 than 1998 and 2007. The rapid melt process in 2011 and 2012 was more intense than observed in 1998 and 2007 because of the thinner ice cover being more susceptible to anomalous thermodynamic forcing. The thin-ner sea ice cover within the CAA in recent years has also
helped counteract the processes that facilitate extreme heavy ice years. The recent extreme light years within the CAA are associated with a longer navigation season within the North-west Passage.
1 Introduction
Prior to the Arctic melt season of 2012, perhaps the most striking Arctic sea ice event in the passive microwave satel-lite era since 1979 was when the mean September Arctic sea ice extent and area fell to record lows of 4.3×10⁶km2
and 2.78×10⁶km2, respectively (NASATeam; Cavalieri et
al., 1996), in 2007 (Stroeve et al., 2008). This dramatic loss of ice during 2007 was linked to anomalously high sea level pressure (SLP) over the Beaufort Sea and Cana-dian Basin and anomalously low SLP over eastern Siberia that transported ice out of the Arctic (Ogi et al., 2008; Wang et al., 2009), together with high surface air temper-ature (SAT) over the central Arctic (Comiso et al., 2008) and the increased bottom melt of sea ice (Perovich et al., 2008). Years of gradual thinning of the Arctic sea ice made it susceptible to the 2007 anomalous forcing events (Maslanik et al., 2007; Lindsay et al., 2009); over the past three decades the Arctic Ocean’s thick multi-year ice (MYI) has been gradually replaced with thinner first-year ice (FYI) (Maslanik et al., 2011). In 2012, mean September sea ice extent and area fell to 3.61×10⁶km2
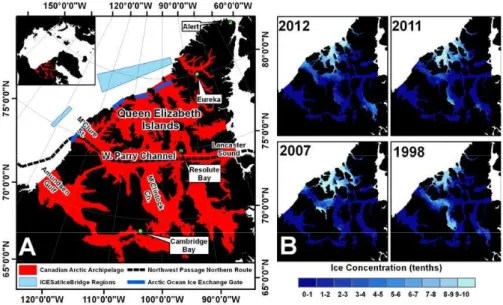
Fig. 1.The geographical location of the Canadian Arctic Archipelago (CAA)(A)and spatial distribution of CAA mean September total ice concentration (tenths) for the four extreme light years(B).
al., 1996), shattering the previous 2007 record. The 2012 September mean value represents∼50 % less sea ice area
within the Arctic compared to the 1981–2010 mean Septem-ber climatology. 2012 sea ice conditions actually fell below the 2007 record in August, following a dramatic storm that tracked across the Arctic from Siberia and into the Canadian Arctic Archipelago (CAA) (Simmonds and Rudeva, 2012). Parkinson and Comiso (2013) found that decades of precon-ditioned thinning made the sea ice more vulnerable to the 2012 storm. Moreover, Zhang et al. (2013) have argued that the 2012 record low would still have occurred without the storm. The latter results are consistent with the view that Arc-tic sea ice is now thinner and more vulnerable to anomalous atmospheric forcing compared to previous decades (Stroeve et al., 2011a).
Within the CAA, 2011 was the record lightest sea ice year, with a mean September area of 146×103km2, but 2012 was
a close second at 150×103km2 (Fig. 1a, b). These values
represent ∼60 % less sea ice area within the CAA
com-pared to the 1981–2010 mean September climatology. Prior to 2011, the lightest ice year within the CAA occurred in 1998, with a mean September ice area of 200×103km2, and
2007 ranked as the second lightest, with a mean Septem-ber ice area of 220×103km2(Fig. 1a, b). Interestingly, the
driving processes behind the 1998 and 2007 minima were very different. Atmospheric circulation during the summer months of 1998 allowed predominantly warm southerly air masses to flow over the CAA (Atkinson et al., 2006). The resultant anomalously warm SAT and restriction of Arctic Ocean MYI inflow into the CAA combined to gradually ab-late the thicker MYI over a longer than normal melt season (Howell et al., 2010). In 2007, anomalously warm July SAT facilitated an intense and rapid melt which led to light ice
conditions in the CAA, but this was partially mitigated by high SLP over the Beaufort Sea which facilitated the inflow of Arctic Ocean MYI into the CAA (Howell et al., 2010). Furthermore, unlike 2007, sea ice in 1998 exhibited no ev-idence of preconditioned thinning leading up the minimum (Howell et al., 2010). In the years that followed the record light ice year of 1998, the CAA returned to heavier summer ice conditions, but the years that followed 2007 only wit-nessed a slight increase in end-of-summer ice (apparent in 2008 and 2009; Fig. 2). Perhaps more striking is that five of the lightest ice years in the CAA since 1968 (i.e. 2007, 2008, 2010, 2011 and 2012) have all occurred within the last 6 yr (Fig. 1c). Considering the recent observed extreme light ice years within the CAA, three questions need to be addressed: (i) what were the processes that contributed to the record ex-treme light ice years of 2011 and 2012?; (ii) how were these processes similar to or different from 1998 and 2007?; and (iii) could the CAA experience a heavy summer ice cover in upcoming years?
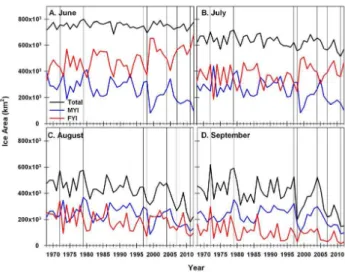
Figure 2. Time series of mean monthly total ice, multi-year ice (MYI) and first-year ice (FYI) Fig. 2.Time series of mean monthly total ice, multi-year ice (MYI) and first-year ice (FYI) area (km2) within the Canadian Arctic Archipelago for June to September(A–D)from 1968–2012. The vertical bars represent the extreme light and heavy years.
of the CAA will still remain difficult. Knowledge of the driv-ing factors behind heavy and light sea ice conditions in the CAA is also of particular importance for Northwest Passage shipping activities (ACIA, 2004; AMSA, 2009).
This paper is organized as follows. Section 2 describes the data and methods used in the analysis. Section 3 defines the framework of the study by looking at the CAA’s extreme light and heavy ice years within a historical time series. Section 4 describes the melt season evolution of sea ice cover in the CAA during extreme light and heavy ice years. Section 5 discusses the thermodynamic and dynamic processes during these two types of seasons. Section 6 discusses the role of preconditioned ice thinning on the recent extreme minima. Section 7 discusses the implications for navigating the North-west Passage given the recent occurrence of more frequent extreme ice minima. Conclusions are presented in Sect. 8.
2 Data and methods
2.1 Canadian Ice Service Digital Archive
Weekly total, MYI, and FYI concentration (tenths) and area (km2) were extracted from the Canadian Ice Service Dig-ital Archive (CISDA) for 1968 to 2012, from June to Oc-tober for the CAA domain shown in Fig. 1a. The CISDA is a compilation of Canadian Ice Service regional weekly ice charts that integrate all available real-time sea ice infor-mation from various satellite sensors, aerial reconnaissance, ship reports, operational model results and the expertise of experienced ice forecasters, spanning 1968 to the present (Canadian Ice Service, 2007). The CISDA ice charts are topologically complete polygon ArcInfo Geographic
Infor-mation System coverages and available online from the CIS (http://ice.ec.gc.ca/).
The CISDA is more accurate than Scanning Multichan-nel Microwave Radiometer (SMMR) and Special Sensor Mi-crowave/Imager (SSM/I) passive microwave ice concentra-tion retrievals during the melt season (Agnew and Howell, 2003). The CISDA contains a technological bias (related to advances in sensor technology and changes in regional focus due to the emergence of important shipping routes; Tivy et al., 2011). The main focus of this study is on processes dur-ing light versus heavy ice seasons, not the trends in ice area or concentration, therefore the impact of any technological and methodological changes will exert minimal influence on the results. CISDA monthly averages of total, MYI, and FYI area and concentration were calculated for the melt season months of June to September. The 1981–2010 period was chosen to represent the historical climatology, and standard-ized anomalies for total, MYI, and FYI were calculated by di-viding anomalies by the 1981–2010 climatological standard deviation.
The years of 1972, 1979, 1997 and 2004 were selected as the extreme heavy ice years to compare against the four ex-treme low years of 1998, 2007, 2011 and 2012. 1972 and 1979 rank as the two years with the heaviest September ice conditions since 1968. 1997 (5th heaviest; Fig. 2) and 2004 (6th heaviest; Fig. 2) were selected instead of 1978 (3rd heav-iest; Fig. 2) and 1986 (4th heavheav-iest; Fig. 2) because the source of the CAA’s MYI changed from FYI aging to a combination of FYI aging and Arctic Ocean MYI inflow in 1995 (Howell et al., 2009). Selecting heavy ice years in both periods allows for a more representative investigation of the processes be-hind heavy ice years. Moreover, 1978 and 1986 exhibited an almost identical ice evolution as the 1st and 2nd heaviest ice years, and discussing their evolutions would have been re-dundant (i.e. the conclusions of the paper would not change). 2.2 Canadian Arctic Archipelago-Arctic Ocean ice
exchange
Ice exchange between the CAA and the Arctic Ocean dur-ing the months of May to September was estimated at the M’Clure Strait and the Queen Elizabeth Islands (QEI) gates (Fig. 1a). While ice exchange does occur between the Amundsen Gulf and the Arctic Ocean, the Amundsen Gulf becomes ice-free during the summer months, and ice ex-change provides a negligible source of CAA ice replenish-ment during the melt season (Kwok, 2006; Agnew et al., 2008; Howell et al., 2008; Canadian Ice Service, 2011).
Ice exchange was derived from sequential RADARSAT-1 or RADARSAT-2 synthetic aperture radar (SAR) imagery with a spatial resolution of∼200 m pixel−1using the
between 2–5 days. A detailed description of the sea ice mo-tion tracking system can be found in Wohlleben et al. (2013) and Komarov and Barber (2013). Here we briefly outline key elements of the ice tracking algorithm. The system operates with two sequential SAR images and derives a detailed map of ice displacements for the time interval separating the im-ages. The algorithm captures both translational and rotational components of ice motion based on a combination of the phase- and cross-correlation matching techniques. To reduce the computation time, several pyramid levels are generated from the original SAR images. At each resolution level vari-ous ice features (e.g. cracks, floes, ridges) suitable for track-ing are automatically identified. First, the ice motion is de-rived at the lowest resolution level. Then at each consecutive resolution level the system is guided by the vectors found at the previous resolution level. To eliminate erroneous ice motion vectors, the algorithm compares ice drift vectors de-rived from the forward pass (tracking from the first image to the second one) and the backward pass (tracking from the second image to the first one). The remaining vectors are further filtered by thresholding their cross-correlation coef-ficients. Finally, at each resolution level, a high, medium or low level of confidence is assigned to each ice drift vector according to the cross-correlation coefficient value. The ac-curacy of the algorithm was thoroughly examined based on the visual detection of similar ice features in sequential SAR images and ground truthed with ice-tracking beacon data for various ice conditions. In Komarov and Barber (2013) a very good agreement between the SAR-derived vectors and the trajectories of drifting ice beacons located in close proximity (less than 3 km) to the nearest SAR ice motion vectors was observed. The root mean square error (RMSE) was 0.43 km for 36 comparison points.
Sea ice area flux was estimated using an approach similar to Kwok (2006) and Agnew et al. (2008). Sea ice motion for each image pair was first interpolated to each exchange gate, including a buffer region of∼30 km on each side of the gate,
and then sampled at 5 km intervals across the gate. Sea ice area flux (F) at each gate was calculated using:
F =Xciui1x, (1)
where1xis the spacing along the gate (5 km),ui is the ice motion normal to the flux gate at the ith location andci is the sea ice concentration obtained from the CISDA. Assuming the errors of the motion samples are additive, unbiased, un-correlated and normally distributed, the uncertainty in area flux across the gates (σf) can be estimated using:
σf=σeL/
p
Ns, (2)
whereσe∼0.43 km day−1 is the error in SAR-derived ice
velocities deduced from Komarov and Barber (2013),L is the width of the gate (km) and Ns is the number of
sam-ples across the gate. For the M’Clure Strait and QEI gates,
the area flux uncertainty is∼12–14 km2day−1. For each
ex-change gate, sea ice flux estimates from all available image pairs were summed over each month for May to September. 2.3 Ice thickness
Ice, Cloud, and land Elevation Satellite (ICESat) and Ice-Bridge ice thickness estimates were obtained prior to the melt season to investigate changes in the thickness of Arc-tic Ocean MYI that would flow into the CAA during the melt season. The ICESat ice thickness estimates are made using satellite-based laser altimetry and are the same used in Kwok et al. (2009) and have an uncertainty of∼0.37 m. A full
de-scription of the retrieval methodology can be found in Kwok et al. (2007) and Kwok et al. (2009). IceBridge ice thickness estimates are also made by laser altimetry, but from an air-borne platform using the Airair-borne Topographic Mapper that is fully described in Krabill et al. (2002). IceBridge thick-ness data were provided by the National Snow and Ice Data Center (Kurtz et al., 2012) using the retrieval methodology described by Kurtz et al. (2013). For each year from 2009– 2012, we selected the closest IceBridge flight line to the Arc-tic Ocean M’Clure Strait and ArcArc-tic Ocean QEI ice exchange gates. The IceBridge flight lines for these gates covered the spatial domains shown in blue in Fig. 1a. The mean ICESat thickness for the same region was extracted from 2004–2008. The dates of the IceBridge flight lines and the ICESat time period is shown in Table 1. The uncertainty of each IceBridge flight line is also shown in Table 1, and Kurtz et al. (2013) state that the evaluation of the accuracy of the data set is on-going. As a result we exercise caution in the interpretation of thickness estimates.
2.4 Ancillary data sets
The date of melt onset and freeze onset from 1979–2012 within the CAA (Fig. 1a) was retrieved from the satellite pas-sive microwave algorithm described by Markus et al. (2009). SLP and SAT data from 1968–2012 were extracted from the National Center for Environmental Prediction-National Center for Atmospheric Research (NCEP-NCAR) Reanal-ysis (Kalnay et al., 1996; Kistler et al., 2001). Finally, net shortwave (K∗) and net longwave (L∗) data from 1979–2012 were extracted from North American Regional Reanalysis (NARR) (Mesinger et al., 2006). There are large known bi-ases in radiative fluxes over the Arctic in re-analyses prod-ucts (Walsh et al., 2009), therefore despite only starting in 1979 we used NARR to better capture the ice within narrow channels and inlets of the CAA.
3 Extreme light and heavy ice years within the historical context
Table 1.ICESat and IceBridge ice thickness estimates within the Canadian Basin just north of the Arctic Ocean–Queen Elizabeth Islands (QEI) and Arctic Ocean–M’Clure Strait ice exchange gates, 2004–2012. IceBridge mean uncertainty in brackets.
Year Ice Thickness (m) Ice Thickness (m) Sensor Date QEI M’Clure Strait
2004 5.6 3.5 ICESat Feb–Mar 2005 5.6 3.6 ICESat Feb–Mar 2006 5.1 4.0 ICESat Feb–Mar 2007 5.2 2.8 ICESat Apr–May 2008 3.3 2.3 ICESat Feb–Mar 2009 3.9 (0.7) 2.5 (0.8) IceBridge 2 and 21 Apr 2010 4.4 (0.8) 2.7 (0.9) IceBridge 5 and 21 Apr 2011 3.7 (0.6) N/A IceBridge 16 Mar 2012 3.3 (0.8) 1.4 (1.1) IceBridge 19 and 22 Mar
been relatively stable in June and July because much of the sea ice within the CAA remains landfast well into July. In terms of FYI and MYI for June and July, there has been a de-crease in MYI and a corresponding inde-crease in FYI, most no-ticeable since 1998. Over the entire period, both August and September FYI have experienced a slow downward trend, whereas MYI remained steady and only began to drop off af-ter 1998. The September total ice time series points out how strong the 1998 anomaly was, as ice conditions were rela-tively stable until then. While subsequent minima were low (2007) or lower (2011 and 2012), they are within a context that now favours light years, which was not the case for the 1998 minima.
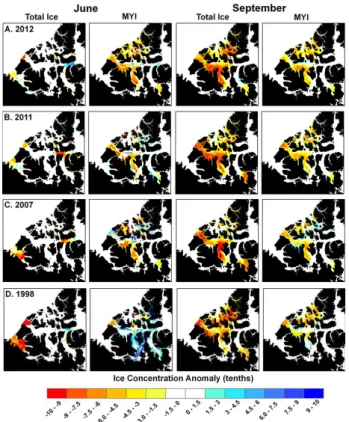
Standardized anomalies are provided in Table 2 for monthly total, MYI and FYI, for light and heavy ice light years. The heavy ice years tended to experience mostly posi-tive total ice standardized anomalies for June and July. Total ice anomalies for heavy ice years during August and Septem-ber were all positive. In addition, total, MYI and FYI for 2011 and 2012 in September were lower than 1998 and 2007. The spatial distribution of mean June and September to-tal ice and MYI for the light ice years is shown in Fig. 3, and for heavy ice years in Fig. 4. In June, negative total ice concentration anomalies for light years were located in pe-ripheral regions of the CAA (e.g. Amundsen Gulf, M’Clure Strait and Lancaster Sound where melt had already begun). Negative MYI concentration anomalies in June were more widespread throughout the CAA (with the exception of pos-itive MYI anomalies across the southern CAA in 1998; see Table 2), especially in 2012. June MYI concentrations for the extreme heavy ice years exhibited positive anomalies throughout most of the CAA.
In September, negative total ice concentration anomalies were located primarily within the QEI, western Parry Chan-nel and M’Clintock ChanChan-nel. The negative total ice anoma-lies were particularly strong and widespread in 2011 and 2012. The western Parry Channel and M’Clintock Channel were almost 100 % ice-covered during the heavy ice years, which may suggest that these regions are more sensitive
Figure 3. Spatial distribution of June and September total ice and multi-year ice (MYI) Fig. 3. Spatial distribution of June and September total ice and multi-year ice (MYI) concentration anomalies (tenths) for the light ice years of 2012, 2011, 2007 and 1998 within the Canadian Arc-tic Archipelago(A–D). Anomalies calculated with respect to the 1981–2010 climatology.
Table 2.Monthly June to September total, multi-year ice (MYI) and first-year ice (FYI) standardized anomalies for extreme light and heavy sea ice years in the Canadian Arctic Archipelago. The top rows are light ice years and the bottom rows are heavy ice years. Standardized anomalies calculated with respect to the 1981–2010 climatology.
Total MYI FYI Total MYI FYI Total MYI FYI Total MYI FYI
2012 2011 2007 1998
Jun 0.99 −2.06 2.23 −0.27 −1.04 0.88 −0.6 −1.03 0.74 −2.12 1.08 −1.67 Jul −1.32 −2.01 1.23 −2.62 −1.23 −0.30 −1.46 −0.98 −0.13 −1.6 1.04 −1.91 Aug −2.66 −1.62 −1.47 −3.27 −1.95 −1.86 −2.03 −1.24 −1.06 −0.94 0.74 −1.87 Sep −2.38 −2.25 −1.21 −2.42 −2.37 −1.52 −1.64 −1.15 −1.19 −1.85 −1.06 −1.20
2004 1997 1979 1972
Jun 0.46 0.34 −0.15 −0.08 0.98 −0.91 1.89 1.98 −1.15 0.28 0.90 −0.97 Jul 0.80 0.30 0.17 −0.04 1.00 −1.01 2.33 1.91 −0.54 1.98 0.08 1.03 Aug 0.97 0.53 0.59 0.56 1.02 −0.43 2.40 2.23 0.38 0.41 1.87 -1.50 Sep 1.55 1.21 0.88 1.58 1.63 0.18 2.29 2.13 1.10 2.58 −0.34 4.25
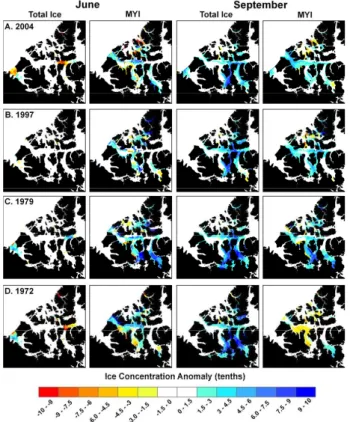
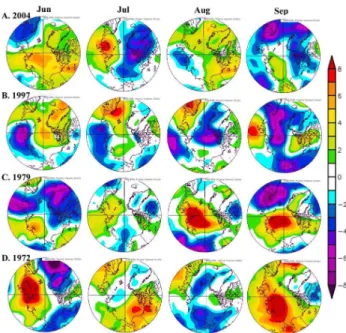
Figure 4. Spatial distribution of June and September total ice and multi-year ice (MYI) Fig. 4.Spatial distribution of June and September total ice and multi-year ice (MYI) concentration anomalies (tenths) for the heavy ice years of 2004, 1997, 1979 and 1972 within the Canadian Arc-tic Archipelago(A–D). Anomalies calculated with respect to the 1981–2010 climatology.
this suggests that FYI survived the melt season in these re-gions, a conclusion further supported by 1972 having the highest mean September FYI area on record (298×103km2;
Fig. 2d).
Over the 45 yr record of sea ice conditions within the CAA, 2011 and 2012 both stand out as extreme light ice years, even more so than 1998 and 2007, in which the pre-vious record minima were observed. Regionally, this was particularly apparent within the western Parry Channel and M’Clintock Channel (Fig. 3). Although FYI melts more eas-ily because it is thinner than MYI, which in turn is more likely to facilitate light ice conditions under anomalous atmo-spheric forcing, it is important to note that the earlier breakup of thinner FYI increases the opportunity of MYI inflow from the Arctic Ocean. This process was shown to reduce total ice loss over the melt season (Howell et al., 2008, 2009). In order to investigate the driving processes that contributed to the new record low years of 2011 and 2012, and comment on the processes required for the CAA to experience a heavy ice year, we first investigate the melt seasonal sea ice area progression during both light and heavy ice years.
4 Melt season progression of Canadian Arctic Archipelago sea ice cover
4.1 Light years
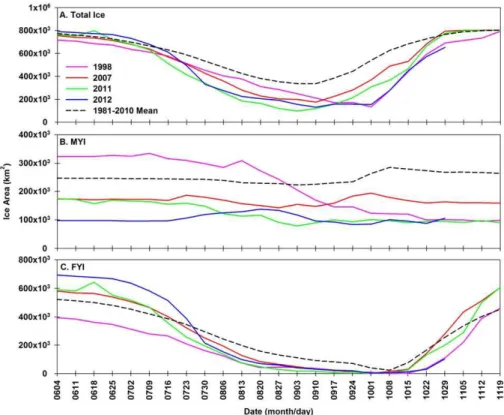
The time series of weekly total ice, MYI and FYI for the ex-treme light ice years 1998, 2007, 2011 and 2012 is shown in Fig. 5. Total ice for the record low year of 2011 initially tracked higher than that of the previous record low year of 1998 until early July, when the rate of ice loss increased and eventually reached a record minimum of 97×103km2
on 5 September. The 2011 minimum was considerably lower than observed in 1998 (133×103km2 during the week of
28 September) and 2007 (175×103km2during the week of
Figure 5. Weekly time series of total ice (A), multi-year (MYI) (B) and first year ice (FYI) (C)
Fig. 5.Weekly time series of total ice(A), multi-year (MYI)(B)and first-year ice (FYI)(C)area (km2)for 1998, 2007, 2011 and 2012 in the Canadian Arctic Archipelago.
record of 131×103km2 during the week of 10 September.
Howell et al. (2010) characterized the 2007 ice loss as rela-tively rapid when compared against the gradual loss of 1998. However, the total ice time series in Fig. 5a shows that both 2011 and 2012 experienced an even more rapid rate of de-cline than 2007.
The time series of FYI (Fig. 5c) also highlights the grad-ual decline in 1998, the rapid decline in 2007 and even more rapid decline during 2011 and 2012. In addition, virtually all FYI melted during the light ice years. The time series of MYI (Fig. 5b) indicates that both 1998 and 2011 exhibited almost no MYI increases during the melt season, indicat-ing reduced inflow from the Arctic Ocean. 2007 and 2012 did, however, experience MYI increases during August and September, indicating the inflow of MYI to the CAA from the Arctic Ocean.
In summary, in all four light ice seasons virtually all the FYI melted by the end of the summer. The rate of ice loss was relatively slow and persistent in 1998, while the rapid rate of decline in 2007 was exceeded in 2011 and 2012. MYI increases due to import from the Arctic Ocean mitigated the melt season ice loss in 2007 and 2012, while the lack of MYI import during the 1998 and 2011 melt seasons contributed to the record low ice minima set during those seasons.
4.2 Heavy years
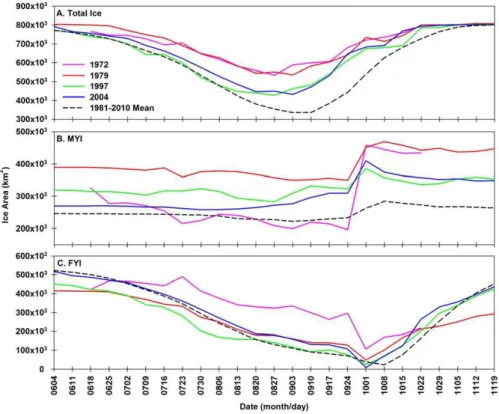
The weekly time series of total ice, MYI and FYI for 1972, 1979, 1997 and 2004 are shown in Fig. 6. Both 1972 and 1979 exhibited a similar slow rate of total ice de-cline, reaching minima of 533×103km2on 28 August and
535×103km2on 6 September, respectively. 1997 and 2004
experienced a greater rate of decline compared to 1972 and 1979 and reached minima of 426×103km2 on 28 August
and 431×103km2 on 6 September, respectively. The
ex-treme heavy ice year minima, on average, represent∼80 %
more ice area compared to the record light minimum of 2011. The FYI and MYI time series (Fig. 6b, c) for the heavy ice years highlight the two processes associated with heavier ice-covered summers within the CAA: FYI aging and Arc-tic Ocean MYI import. 1 October is the date each year on which any FYI remaining at the end of the melt season is pro-moted to MYI (i.e. FYI aging). Although the rate of FYI loss during 1997 and 2004 was greater than in 1972 and 1979, it was still considerably less than the FYI loss during the ex-treme light years (Figs. 5c and 6c). All four heavy ice seasons show a rapid increase in MYI after 1 October, ranging from
∼75×103km2for 1997 to∼250×103km2for 1972. The
Figure 6. Weekly time series of total ice (A), multi-year (MYI) (B) and first year ice (FYI) (C)
Fig. 6.Weekly time series of total ice(A), multi-year (MYI)(B)and first-year ice (FYI)(C)areas (km2)for 1972, 1979, 1997 and 2004 in the Canadian Arctic Archipelago.
at the end of the melt season (Fig. 5c). The role of MYI im-port during heavy ice years was evident by comparing 1972 and 1979 with 1997 and 2004. Although the increase in MYI on 1 October for 1997 and 2004 was small when compared to 1972 and 1979, there was also a net increase in MYI from 4 June to 24 September that can be attributed to Arctic Ocean inflow.
In summary, 1972 and 1979 experienced a large end-of-season MYI increase from FYI aging, while both 1997 and 2004 experienced an MYI increase from a combination of FYI aging and Arctic Ocean MYI inflow. In order to ex-plain these differences in the seasonal evolution of summer ice cover for both light and heavy years, we now look at the driving thermodynamic and dynamic processes.
5 Thermodynamic and dynamic processes behind extreme ice years
5.1 Light years
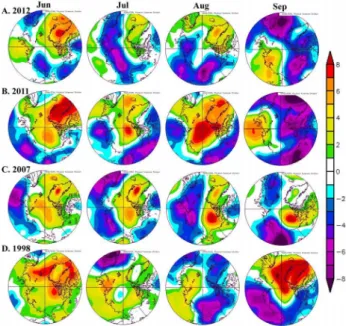
The dominant JJAS atmospheric circulation pattern during the extreme light years consisted of high SLP anomalies over Greenland and the Beaufort Sea (Fig. 7). This atmospheric circulation pattern transports warm air into the CAA, which influences the role of SAT in sea ice melt and also promotes clearer skies, which influences the role of shortwave radiative
forcing in sea ice melt. With respect to SAT, the time series of JJAS anomalies shows positive departures for all extreme light years, with the 2012 anomaly of 2.28◦C exceeding the previous record anomaly of 2.0◦C set in 1998 (Fig. 8). 1998 has long been recognized as one of the warmest years in the Canadian Arctic, which exerted a strong influence on CAA sea ice conditions along with other elements of the Canadian cryosphere (e.g. Jeffers et al., 2001; Alt et al., 2006; Atkin-son et al., 2006; Howell et al., 2010). The JJAS SAT anomaly for the record low ice year of 2011 ranked third at 1.80◦C, while 2007 was the “coolest” of the extreme light years, with an anomaly of 0.71◦C (Fig. 8). With respect to radiative forc-ing, the time series of JJAS anomalies ofK∗,L∗and net all-wave radiation (Q∗) show strong positiveK∗departures for all extreme light years (Fig. 9). Of the 4 lightest ice years, 2007 and 2011 had the strongest positiveK∗anomalies, at 23 Wm−2and 22 Wm−2, respectively (Fig. 9). 2012 ranked
third with a positiveK∗anomaly of 16 Wm−2, and 1998
ex-perienced the lowestK∗anomaly of the extreme light years, at 9 Wm−2(Fig. 9).L∗anomalies for the extreme years were negative (i.e. 1998, 2007, and 2011) or just slightly positive (i.e. 2012) (Fig. 9).
Fig. 7.Spatial distribution of NCEP/NCAR mean June to Septem-ber sea level pressure (SLP; mb) anomalies for 2012, 2011, 2007 and 1998(A–D). Anomalies calculated with respect to the 1981– 2010 climatology.
series of NCEP/NCAR mean June through September (JJAS) surface air
Fig. 8.Time series of NCEP/NCAR mean June through September (JJAS) surface air temperature (SAT) anomalies (◦C) in the Cana-dian Arctic Archipelago, 1968–2012. Anomalies calculated with re-spect to the 1981–2010 climatology.
sea ice minima. Perovich et al. (2007) demonstrated that the melt process is enhanced from an earlier melt onset by in-creasing the energy available for melt during the melt season, and this increased energy can exert an influence on the min-imum sea ice area reached over the season. The melt onset dates for 2011 and 2012 were not anomalously early (Fig. 10) and total ice conditions remained near the 1981–2010 cli-matology in June (Fig. 5a). However, once melt onset began in 2011 and 2012, the sea ice–albedo feedback intensified due to strong positive SAT andK∗anomalies and facilitated
Fig. 9.Time series of NARR mean June through September (JJAS) net shortwave (K∗), net longwave (L∗) and net all-wave (Q∗) ra-diation anomalies (W m−2) in the Canadian Arctic Archipelago, 1979–2012. Anomalies calculated with respect to the 1981–2010 climatology.
rapid melt. The previous second lightest ice year of 2007 had a similar melt onset date compared to 2011 and 2012 (Fig. 10) and also experienced a rapid melt event, but was less pronounced (Fig. 5a).K∗anomalies in 2007 were stronger than both 2011 and 2012, but SAT’s were cooler, which sug-gests that rapid melt in 2007 was potentially influenced more by solar radiation absorption. The melt season length for the previous record lightest ice year of 1998 was long, with melt onset and freeze onset anomalies of−6 days and 14 days,
respectively (Fig. 10). The early melt onset in 1998 was im-portant, as it facilitated more total ice loss early in the melt season, thus increasing the energy available for melt that in turn contributed to the gradual melt of ice throughout the re-mainder of the melt season (Fig. 5a). Comparing 1998 to both 2011 and 2012 indicates similar positive SAT anomalies, but
K∗anomalies were much lower in 1998, suggesting that SAT played more of a role with respect to ice loss. Atkinson et al. (2006) also suggested that anomalous SAT contributed to the sea ice reductions within the CAA during 1998.
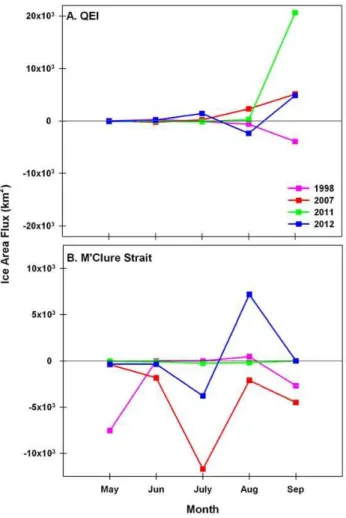
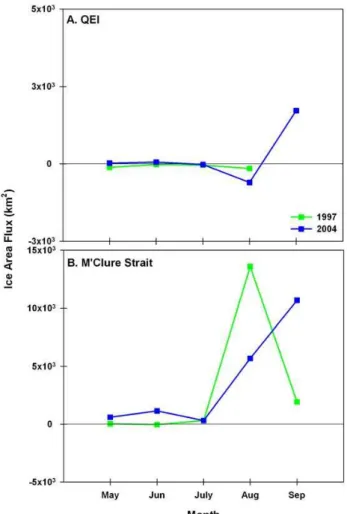
Investigation of the corresponding dynamic processes in-dicated that in addition to rapid melt, the extreme minimum of 2011 was also driven by July and August atmospheric cir-culation restricted inflow of ice from the Arctic Ocean. Ice area flux estimates for 2011 show almost net zero exchange between the Arctic Ocean and QEI gates from May to Au-gust and a large net inflow of∼21×103km2in September
Figure 10. Time series of the melt and freeze onset anomalies (days) in the Canadian Arctic
Fig. 10.Time series of the melt and freeze onset anomalies (days) in the Canadian Arctic Archipelago, 1979–2012. Anomalies calcu-lated with respect to the 1981–2010 climatology.
between the Arctic Ocean and CAA, leading up the min-imum by facilitating stagnant ice motion within the CAA. Arctic Ocean MYI import via the QEI in September 2011 was caused by a shift in atmospheric circulation that occurred in September (Fig. 7b). MYI for 2011 also began to increase the week after the minimum was reached (Fig. 5b). Similar to 2011, 1998 also experienced reduced Arctic Ocean ice in-flow, although June to September SLP anomalies were differ-ent (cf. Fig. 7b, d), with atmospheric circulation driving more ice outflow from the CAA into the Arctic Ocean at both the M’Clure and QEI gates in September 1998 (Fig. 11).
With respect to sea ice dynamic forcing for 2012, the min-imum was initially driven by rapid melt, but this ice loss was mitigated by Arctic Ocean MYI inflow. The majority of this inflow occurred via the M’Clure Strait in August (Fig. 11b), with MYI during August also exhibiting increases (Fig. 5b). The ice inflow is likely associated with the anomalously low SLP that tracked across the Arctic Ocean and into the CAA (Simmonds and Rudeva, 2012). Following the August ice in-flow event, almost zero net ice area flux occurred in Septem-ber at the M’Clure Strait, but a small net inflow occurred into the QEI (Fig. 11). These Arctic Ocean ice inflow events re-duced the CAA’s rate of total ice decline, preventing total ice conditions from eclipsing the 2011 record low. This driv-ing dynamic process observed in 2012 was similar to 2007. Although June to September SLP anomalies were different between 2012 and 2007 (Fig. 7a, c), both atmospheric circu-lation patterns facilitated Arctic Ocean inflow into the CAA. It should be noted however that the 2012 Arctic Ocean ice in-flux into the M’Clure Strait was driven by 2 single SLP driv-ing events in August (not shown) that are lost in the August monthly SLP average. The key difference between 2012 and 2007 was that despite the net Arctic Ocean ice inflow at the M’Clure Strait in August and at QEI in September for 2012, MYI conditions did not remain high through the remainder
series of mean May to September Arctic Ocean-Canadian Arctic Archipelago Fig. 11. Time series of mean May to September Arctic Ocean–
Canadian Arctic Archipelago sea ice area flux (km2) at the Queen Elizabeth Islands (QEI)(A)and the M’Clure Strait(B)for 1998, 2007, 2011 and 2012, estimated from RADARSAT. Posi-tive/negative sign indicates Arctic Ocean inflow/outflow.
of the 2012 melt season (i.e. the imported MYI subsequently melted; Fig. 5b).
Figure 12. Spatial distribution of NCEP/NCAR mean June to September (JJAS) sea level
Fig. 12.Spatial distribution of NCEP/NCAR mean June to Septem-ber (JJAS) sea level pressure (SLP; mb) anomalies for 2004, 1997, 1979 and 1972(A–D). Anomalies calculated with respect to the 1981–2010 climatology.
5.2 Heavy years
The dominant JJAS atmospheric circulation pattern for ex-treme years was high SLP anomalies over the Laptev and East Siberian seas and low SLP anomalies over Green-land, facilitating cooler conditions over the CAA (Fig. 12), but there was more monthly variability compared to ex-treme light years (Fig. 7). JJAS SAT anomalies indicate that negative anomalies were present for all the extreme heavy ice years, with 1972 experiencing the strongest negative anomaly of −2.63◦C (Fig. 8). K∗ anomalies were
nega-tive for 1979 (−5.8 Wm−2), 1997 (−1.8 Wm−2) and 2004
(0.2 Wm−2), andL∗anomalies were only negative for 1997 (3.7 Wm−2). The only year that experienced a positive net
all-wave radiation balance was 2004 (Fig. 9).
The two heaviest ice years of 1972 and 1979 were likely driven by thermodynamics alone, despite no direct estimates of Arctic Ocean–CAA ice exchange being available. We can eliminate Arctic Ocean ice inflow based on several reasons. The time series of MYI for these years shows very little change prior to the 1 October promotion of FYI, suggest-ing negligible Arctic Ocean–CAA ice exchange (Fig. 6b). The considerable jump in the MYI weekly time series on 1 October is evidence of significant melt season FYI sur-vival, as opposed to Arctic Ocean ice advection (Fig. 6c). SLP anomalies during August and September for 1979 and during September 1972 indicate atmospheric circulation (i.e. north/northwesterly winds), which would favour Arctic Ocean ice inflow into the CAA (Fig. 12c, d), but the actual
ice area flux was negligible because the CAA was already heavily congested with ice throughout the season, which prevented appreciable ice exchange (Fig. 4a, b). Satellite-derived melt and freeze onset were not available for 1972, but for 1979 melt onset occurred late and freeze onset early (i.e. short melt season) (Fig. 10). BothK∗ andQ∗ experi-enced strong negative anomalies during 1979 (Fig. 9), and although radiative forcing data was not available for 1972, high SLP anomalies did not persist over the CAA (Fig. 12d), and it was likely thatK∗anomalies were negative. The cooler temperatures, negative radiation balance and short melt sea-sons helped reduce melt during 1972 and 1979, resulting in more ice survival, as evident from Fig. 6, and in heavy ice years.
For the heavy ice years of 1997 and 2004, the weaker SAT,
K∗and melt onset anomalies in 1997 and 2004 (compared to 1972 and 1979) allowed for more summer melt and de-creased survival of the FYI. However, the greater areas of open water in these years facilitated Arctic Ocean MYI in-flow, which compensated for the slightly increased ice loss from melt. Consider: JJAS SAT anomalies for 1997 and 2004 were slightly negative at −0.73◦C and −0.74◦C,
respec-tively (Fig. 8).K∗anomalies were slightly negative for 1997 and slightly positive for 2004 (Fig. 9). Melt onset anoma-lies for 1997 and 2004 were near normal at 2.7 days and 5.4 days (Fig. 10), and freeze onset anomalies for 2004 were also near normal (−1 days), but for 1997 they were
consid-erably late at−10 days (Fig. 9). Arctic Ocean MYI inflow
occurred at the M’Clure Strait during August and September in 1997 and 2004 and at the QEI in September 2004 (Fig. 13; no RADARSAT imagery available for the QEI in Septem-ber 1997). August and SeptemSeptem-ber SLP anomalies are consis-tent with these import processes (Fig. 12a, b), and the weekly time series of MYI also illustrates a net increase in MYI prior to 1 October for both 1997 and 2004 (Fig. 6b). Therefore, heavy ice conditions in 1997 and 2004 were driven by a com-bination of thermodynamic (reduced FYI melt) and dynamic (increased MYI import) forcing.
The CAA’s extreme heavy ice years were either driven by thermodynamics alone (i.e. 1972 and 1979) or in concert with dynamics (i.e. 1997 and 2004). There is interplay be-tween thermodynamics and dynamics during heavy ice years, whereby some in situ melt of FYI creates conditions within the CAA which are receptive to atmospherically driven ice inflow from the Arctic Ocean due to some open water frac-tion. During light ice seasons, extreme ice minima are gener-ally not the result of thermodynamics alone, but are also in-fluenced by dynamic processes (i.e. MYI exchange between the Arctic Ocean and CAA).
6 Evidence of recent preconditioned thinning
Fig. 13. Time series of mean May to September Arctic Ocean– Canadian Arctic Archipelago sea ice area flux (km2)at the Queen Elizabeth Islands (QEI)(A)and the M’Clure Strait(B)for 1997 and 2004, estimated from RADARSAT. No RADARSAT data were available in September 1997 at the QEI. Positive/negative sign indi-cates Arctic Ocean inflow/outflow.
preconditioning was apparent prior to 2007, based on light ice conditions in 2006. Both 2011 and 2012 were able to eclipse these previous extreme light ice years because of stronger preconditioning. Consider that since 1968, the CAA has always experienced a period of recovery following a light ice year, with previous studies indicating that the recovery process can take between 2 and 5 yr (e.g. Melling, 2002; Alt et al., 2006; Atkinson et al., 2006; Howell et al., 2008). For example, following the extreme light ice year of 1998, mean September total ice gradually returned to heavier ice amounts (Fig. 2). However, following the extreme light year of 2007, there was only a brief and small period of recovery in 2008 and 2009, after which ice conditions began to decline again (Fig. 2). The June time series of FYI and MYI exhibit di-vergent trajectories from 1968 to 2012 (increasing FYI; de-creasing MYI), indicating an increased proportion of FYI in the CAA at the start of the melt season (Fig. 2a). Solar
ra-diation absorption and transmittance through FYI is larger than MYI because it is thinner, and this results in enhanced ice melt (e.g. Nicolaus et al., 2012; Hudson et al., 2013). The melt seasons of 2011 and 2012 began with June FYI fractions making up 77 % and 88 % of the CAA’s total ice component, respectively, compared to 55 % in 1998 (Fig. 2a). As a result of this increased percentage of FYI at the start of the melt season in 2011 and 2012, the majority of the ice in the CAA was more vulnerable to the anomalous thermodynamic forc-ing (Fig. 8; Fig. 9) that facilitated rapid melt (Fig. 5).
The FYI fraction in 2007 also made up 77 % of the CAA’s total ice component, which poses the question: why was pre-conditioning more apparent in 2011 and 2012? We suggest two possible processes responsible for stronger precondi-tioning in 2011 and 2012. The first process is the result of recent changes in Arctic Ocean–CAA ice exchange. How-ell et al. (2013) found that net MYI inflow from the Arctic Ocean into the CAA via the M’Clure Strait and QEI from May through September (i.e. leading up to minimum sea ice conditions) has decreased considerably since 2007. Specif-ically, for three years leading up to 2007 (i.e. 2004–2006) the net Arctic Ocean MYI flux was 61×103km2, but for the
three years leading up to 2011 (i.e. 2008–2010) the MYI flux was only 14×103km2, or 75 % less. Less MYI inflow from
the Arctic Ocean into CAA since 2007 has likely contributed to the increased amount of FYI within the CAA and subse-quently reduced the CAA’s ability to recover MYI leading up to 2011 and 2012.
Fig. 14. Time series of ICESat and IceBridge winter Arctic sea ice thickness anomalies in the Canadian Basin just north of the Canadian Arctic Archipelago, 2004–2012. Anomalies are calcu-lated with respect to the 2004–2012 period.
pre-2007 values (Table 1; Fig. 14). Indeed, the MYI at the Arctic Ocean–QEI exchange gates is certainly thicker than locations of the ICESat/IceBridge estimates (e.g. Bourke and Garrett, 1987), and more of this thicker ice likely flowed into the CAA. However, the latter provides additional support for thinner Arctic Ocean MYI flowing into the CAA. Maslanik et al. (2011) also reported considerable decreases in MYI age in the regional immediately north of the CAA since 2006.
It seems apparent that in both 2011 and 2012 sea ice was preconditioned to be susceptible to anomalous forcing, which resulted in extreme minima, even more so than in 1998 and 2007. It is however important to note that the lack of pre-conditioned ice thinning in the CAA does not always prevent record light years. For example, the ice in 1998 exhibited no evidence of preconditioning, yet an extreme minimum was still reached (Howell et al., 2010). Conversely, evidence of preconditioned thinning does not always prevent a heavy ice year from occurring. For example, because 1971 was a rela-tively light ice year, the 1972 melt season began with a low percentage of MYI within the CAA, and yet 1972 ended up being the heaviest ice year on record.
7 Implications for navigating the Northwest Passage
The extreme ice minima observed within the CAA in recent years have resulted in increased open water within the CAA and in turn the Northwest Passage. The time series of length of the navigation season and the mean MYI over the naviga-tion season for the northern route of the Northwest Passage are shown in Fig. 15. The Canadian Ice Service defines the navigation season as “open” for any given week if the to-tal ice extent within the route is less 60 % of the toto-tal ocean
Fig. 15.Time series of the length of the navigation season for the northern route of the Northwest Passage and mean multi-year ice (MYI) area within the region, 1968–2012. The navigation season is defined by the Canadian Ice Service as a 17-week time window from 25 June to 15 October.
area within the route. There is a strong inverse correlation between the length of the navigation and mean MYI area present over the shipping season ofr= −0.72 (Fig. 15). The
recent extreme light ice years within the CAA since 2007 are clearly associated with longer navigation seasons. The only other time period the northern route experienced a nav-igation season longer than 1–2 weeks was from 1998–2000, which was also associated with the extreme sea ice minima (i.e. 1998).
8 Conclusions
We began this paper by first asking the questions: what were the processes that contributed to the new record extreme light ice years of 2011 and 2012, and how were they simi-lar to or different from 1998 and 2007? The record low ice year of 2011 was associated with positive JJAS SAT andK∗ anomalies that facilitated rapid melt, together with July and August atmospheric circulation that restricted Arctic Ocean MYI inflow into the CAA. Although atmospheric circula-tion patterns between 1998 and 2011 were different, both re-stricted MYI inflow from the Arctic Ocean. The second light-est ice year of 2012 was also driven by positive JJAS SAT andK∗anomalies that facilitated rapid melt, but August and September atmospheric circulation temporarily reduced the rapid rate of ice decline through MYI inflow from the Arc-tic Ocean. This positive ice area flux into the CAA prevented 2012 from surpassing the 2011 record. There was also evi-dence of preconditioned ice thinning prior to 2011 and 2012 (more so than 1998 and 2007), which made the sea ice more vulnerable to anomalous thermodynamic forcing, facilitating these extreme years.
The final question we posed was: could the CAA experi-ence a heavy summer ice cover in upcoming years? Extreme heavy ice years in the CAA were found to be associated with (i) negative SAT andK∗anomalies that reduced FYI decline over the melt season or (ii) moderate negative SAT andK∗ anomalies that allowed slightly more ablation of FYI, but where MYI inflow from the Arctic Ocean compensated for the extra FYI loss. The CAA could experience a heavy ice year if either of these processes was to occur again; however, this likelihood is reduced given the increased presence of FYI at the start of the melt season and if Arctic Ocean MYI flow-ing into the CAA is now thinner than several decades ago. The CAA’s lack of MYI recovery since 2007 (evidenced by the fact that 5 of the 6 lightest years in the CAA since 1968 have occurred in the last 6 yr) and the associated trends to-wards warmer Arctic SAT (Kaufman et al., 2009; Berkryaev et al., 2011) and a longer Arctic melt seasons (Howell et al., 2009; Markus et al., 2009) also serve to reduce the probabil-ity of the CAA experiencing an extreme heavy ice year in the near future. If light sea ice conditions within the CAA per-sist, so will long navigation seasons with the northern route of the Northwest Passage, but the presence of MYI will still remain.
Acknowledgements. This work was funded by the Canadian Space Agency through the Government Related Initiatives Program. We would like to thank T. Markus and J. Miller at Cryospheric Sciences Laboratory NASA GSFC for providing the SMMR-SSM/I melt and freeze onset data. RADARSAT data for 1997, 1998, 2004 and 2007 were provided by the Alaska Satellite Facility, Fairbanks, Alaska. We also wish to thank J. Stroeve, J. Walsh, D. Bailey and two anonymous reviewers for their helpful comments on improving the quality of this paper.
Edited by: J. Stroeve
References
ACIA: Arctic Climate Impact Assessment, Cambridge, Cambridge University Press, 2004.
Agnew, T. and Howell, S.: The use of operational ice charts for eval-uating passive microwave ice concentration data, Atmos. Ocean, 41, 317–331, doi:10.3137/ao.410405, 2003.
Agnew, T., Lambe, A., and Long, D.: Estimating sea ice area flux across the Canadian Arctic Archipelago using enhanced AMSR-E, J. Geophys. Res., 113, C10011, doi:10.1029/2007JC004582, 2008.
Alt, B., Wilson, K., and Carrieres, T.: A case study of old ice import and export through Peary and Sverdrup channels in the Cana-dian Arctic Archipelago: 1998–2004, Ann. Glaciol., 44, 329– 338, doi:10.3189/172756406781811321, 2006.
AMSA: The Arctic Marine Shipping Assessment 2009 Report, Arc-tic Council, 2009.
Atkinson, D .E., Brown, R., Alt, B., Agnew, T., Bourgeois, J., Burgess, M., Duguay, C., Henry, G., Jeffers, S., Koerner, R., Lewkowicz, A. G., McCourt, S., Melling, H., Sharp, M., Smith, S., Walker, A., Wilson, K., Wolfe, S., Woo, M-K., and Young, K. L.: Canadian cryospheric response to an anomalous warm summer: A synthesis of the climate change action fund project “The State of the Arctic Cryosphere During the Ex-treme Warm Summer of 1998”, Atmos. Ocean, 44, 347–375, doi:10.3137/ao.440403, 2006.
Berkryaev, R. V., Polyakov, I. V., and Alexeev, V. A.: Role of Po-lar Amplification in Long-Term Surface Air Temperature Varia-tions and Modern Arctic Warming, J. Climate, 23, 3888–3906, doi:10.1175/2010JCLI3297.1, 2011.
Bourke, R. H. and Garrett, R. P.: Sea ice thickness distribution in the Arctic Ocean, Cold Reg. Sci. Technol., 13, 259–280, 1987. Canadian Ice Service: Regional charts: History, accuracy, and
caveats, Arch. Ser. Doc. Ser. 1, Ottawa, available at: http://ice. ec.gc.ca/IA_DOC/cisads_no_001_e.pdf(last access: 14. Novem-ber 2013 ), 2007.
Canadian Ice Service: Sea Ice Climatic Atlas: Northern Canadian Waters 1981-2010, edited by: Canadian Ice Service, Ottawa, Canada, 995 pp., 2011.
Cavalieri, D., Parkinson, C., Gloersen, P., and Zwally, H. J., up-dated yearly, Sea Ice Concentrations from Nimbus-7 SMMR and DMSP SSM/I-SSMIS Passive Microwave Data, Boulder, Col-orado USA: National Snow and Ice Data Center, 1996.
Holland, M. M., Bitz, C. M., and Tremblay, B.: Future abrupt re-ductions in the summer Arctic sea ice, Geophys. Res. Lett., 33, L23503, doi:10.1029/2006GL028024, 2006.
Howell, S. E. L., Tivy, A., Yackel, J. J., Else, B. G. T., and Duguay, C. R.: Changing sea ice melt parameters in the Canadian Arctic Archipelago: Implications for the future presence of multiyear ice, J. Geophys. Res., 113, C09030, doi:10.1029/2008JC004730, 2008.
Howell, S. E. L., Duguay, C. R., and Markus, T.: Sea ice conditions and melt season duration variability within the Canadian Arc-tic Archipelago: 1979–2008, Geophys. Res. Lett., 36, L10502, doi:10.1029/2009GL037681, 2009.
Howell, S. E. L., Tivy, A., Agnew, T., Markus, T., and Derk-sen, C.: Extreme low sea ice years in the Canadian Arctic Archipelago: 1998 versus 2007, J. Geophys. Res., 115, C10053, doi:10.1029/2010JC006155, 2010.
Howell, S. E. L., Wohlleben, T., Dabboor, M., Derksen, C., Komarov, A., and Pizzolato, L.: Recent changes in the ex-change of sea ice between the Arctic Ocean and the Cana-dian Arctic Archipelago, J. Geophys. Res., 118, 3595–3607, doi:10.1002/jgrc.20265, 2013.
Hudson, S. R., Granskog, M. A., Sundfjord, A., Randelhoff, A., Renner, A. H. H., and Divine, D. V.: Energy budget of first-year Arctic sea ice in advanced stages of melt, Geophys. Res. Lett., 40, 2679–2683, doi:10.1002/grl.50517, 2013.
Jeffers, S., Agnew, T., Alt, B., De Abreu, R., and McCourt, S.: Investigating the anomalous sea-ice conditions in the Canadian High Arctic (Queen Elizabeth Islands) during summer 1998, Ann. Glaciol., 33, 507–512, 2001.
Kalnay, E., Kanamitsu, M., Kistler, R., Collins, W., Deaven, D., Gandin, L., Iredell, M., Saha, S.„ White, G., Woollen, J., Zhu, Y., Chelliah, M., Ebisuzaki, W., Higgins, W., Janowiak, J., Mo, K. C., Ropelewski, C., Wang, J., Leetmaa, A., Reynolds, R., Jenne, R., and Joseph, D.: The NCEP/NCAR 40-year reanalysis project, B. Am. Meteorol. Soc., 77, 437–471, doi:10.1175/1520-0477(1996)077<0437:TNYRP>2.0.CO;2, 1996.
Kaufman, D. S., Schneider, D. P., McKay, N. P., Ammann, C. M., Bradley, R. S., Briffa, K. R., Miller, G. H., Otto-Bliesner, B. L., Overpeck, J. T., Vinther, B., and Arctic Lakes 2k Project Mem-bers: Recent warming reverses long-term Arctic cooling, Sci-ence, 325, 1236–1239, doi:10.1126/science.1173983, 2009. Kistler, R., Kalnay, E.„ Collins, W., Saha, S., White, G., Woollen,
J., Chelliah, M., Ebisuzaki, W., Kanamitsu, M., Kousky, V., van den Dool, H., Jenne, R., and Fiorino, M.: The NCEP–NCAR 50-year reanalysis: Monthly means CD-ROM and documenta-tion, B. Am. Meteorol. Soc., 82, 247–267, doi:10.1175/1520-0477(2001)082<0247:TNNYRM>2.3.CO;2, 2001.
Komarov, A. S and Barber, D. G.: Sea ice motion tracking from sequential dual-polarization RADARSAT-2 images, IEEE T. Geosci. Remote, 1–12, doi:10.1109/TGRS.2012.2236845, 2013. Krabill, W. B., Abdalati, W., Frederick, E. B., Manizade, S. S., Mar-tin, C. F., Sonntag, J. G., Swift, R. N., Thomas, R. H., and Yungel, J. G.: Aircraft laser altimetry measurement of elevation changes of the Greenland ice sheet: Technique and accuracy assessment, J. Geodyn., 34, 357–376, doi:10.1016/S0264-3707(02)00040-6, 2002.
Kurtz, N. T., Studinger, M., Harbeck, J., Onana, V., and Farrell, S.: IceBridge Sea Ice Freeboard, Snow Depth, and Thickness,
Boul-der, Colorado USA: NASA DAAC at the National Snow and Ice Data Center, 2012.
Kurtz, N. T., Farrell, S. L., Studinger, M., Galin, N., Harbeck, J. P., Lindsay, R., Onana, V. D., Panzer, B., and Sonntag, J. G.: Sea ice thickness, freeboard, and snow depth products from Oper-ation IceBridge airborne data, The Cryosphere, 7, 1035–1056, doi:10.5194/tc-7-1035-2013, 2013.
Kwok, R: Exchange of sea ice between the Arctic Ocean and the Canadian Arctic Archipelago, Geophys. Res. Lett., 33, L16501, doi:10.1029/2006GL027094, 2006.
Kwok, R. and Cunningham, G. F.: Contribution of melt in the Beaufort Sea to the decline in Arctic multiyear sea ice coverage: 1993–2009, Geophys. Res. Lett., 37, L20501, doi:10.1029/2010GL044678, 2010.
Kwok, R., Cunningham, G. F., Zwally, H. J., and Yi, D.: ICESat over Arctic sea ice: Interpretation of altimetric and reflectivity profiles, J. Geophys. Res., 111, C06006, doi:10.1029/2005JC003175, 2006.
Kwok, R., Cunningham, G. F., Zwally, H. J., and Yi, D.: Ice, Cloud, and land Elevation Satellite (ICESat) over Arctic sea ice: Retrieval of freeboard, J. Geophys. Res., 112, C12013, doi:10.1029/2006JC003978, 2007.
Kwok, R., Cunningham, G. F., Wensnahan, M., Rigor, I., Zwally, H. J., and Yi, D.: Thinning and volume loss of the Arctic Ocean sea ice cover: 2003–2008, J. Geophys. Res., 114, C07005, doi:10.1029/2009JC005312, 2009.
Lindsay, R. W., Zhang, J., Schweiger, A., Steele, M., and Stern, H.: Arctic sea ice retreat in 2007 follows thinning trend, J. Climate, 22, 165–176, doi:10.1175/2008JCLI2521.1, 2009.
Markus, T., Stroeve, J. C., and Miller, J.: Recent changes in Arctic sea ice melt onset, freezeup, and melt season length, J. Geophys. Res., 114, C12024, doi:10.1029/2009JC005436, 2009.
Maslanik, J. A., Fowler, C., Stroeve, J. C., Drobot, C., Zwally, J., Yi, D., and Emery, W: A younger, thinner Arctic ice cover: Increased potential for rapid, extensive sea-ice loss, Geophys. Res. Lett., 34, L24501, doi:10.1029/2007GL032043, 2007.
Maslanik, J. A., Stroeve, J. C., Fowler, C., and Emery, W.: Distribu-tion and trends in Arctic sea ice age through spring 2011, Geo-phys. Res. Lett., 38, L13502, doi:10.1029/2011GL047735, 2011. Melling, H.: Sea ice of the northern Canadian Arctic Archipelago, J. Geophys. Res., 107, 3181, doi:10.1029/2001JC001102, 2002. Mesinger, F., Dimego, G., Kalnay, E., Mitchell, K., Shafran, P. C., Ebisuzaki, W., Jovic, D., Woollen, J., Rogers, E., Berbery, E. H., Ek, M. B., Fan, Y., Grumbine, R., Higgins, W., Li, H., Lin, Y., Manikin, G., Parrish, D., and Shi, W.: North American regional reanalysis, B. Am. Meteorol. Soc., 87, 342–360, 2006.
Nicolaus, M., Katlein, C., Maslanik, J., and Hendricks, S.: Changes in Arctic sea ice result in increasing light trans-mittance and absorption, Geophys. Res. Lett., 39, L24501, doi:10.1029/2012GL053738, 2012.
Ogi, M., Rigor, I. G., McPhee, M. G., and Wallace, J. M.: Summer retreat of Arctic sea ice: role of summer winds, Geophys. Res. Lett., 35, L24701, doi:10.1029/2008GL035672, 2008.
Parkinson, C. L. and Comiso, J. C.: On the 2012 record low Arctic sea ice cover: Combined impact of preconditioning and an August storm, Geophys. Res. Lett., 40, 1356–1361, doi:10.1002/grl.50349, 2013.
en-ergy absorbed by the Arctic sea ice-ocean system, J. Geophys. Res., 112, C03005, doi:10.1029/2006JC003558, 2007.
Perovich, D. K, Richter-Menge, J. A, Jones, K. F., and Light, B.: Sunlight, water and ice: extreme Arctic sea ice melt dur-ing the summer of 2007, Geophys. Res. Lett., 35, L11501, doi:10.1029/2008GL034007, 2008.
Simmonds, I. and Rudeva, I.: The great arctic cyclone of August 2012, Geophys. Res. Lett., 39, L23709, doi:10.1029/2012GL054259, 2012.
Smith, L. C. and Stephenson, S. R.: New Trans-Arctic shipping routes navigable by mid-century, Proc. Nat. Acad. Sci., 110, E1191–E1195, doi:10.1073/pnas.1214212110, 2013.
Sou, T. and Flato, G.: Sea ice in the Canadian Arctic Archipelago: Modeling the past (1950–2004) and the future (2041–60), J. Clim., 22, 2181–2198, doi:10.1175/2008JCLI2335.1, 2009. Stephenson, S. R., Smith, L. C., Brigham, L. W., and Agnew, J. A.:
Projected 21st-century changes to Arctic marine access, Clim. Change, 118, 885–899, doi:10.1007/s10584-012-0685-0, 2013. Stroeve, J. C., Serreze, M., Drobot, S., Gearheard, S., Holland,
M., Maslanik, J., Meier, W., and Scambos, T.: Arctic sea ice extent plummets in 2007, Eos Trans. AGU, 89, 89, 13–14, doi:10.1029/2008EO020001, 2008.
Stroeve J. C., Serreze, M., Holland, M., Kay, J., Maslanik, J., and Barrett, A.: The Arctic’s rapidly shrinking sea ice cover: a research synthesis, Clim. Change, 110, 1005–1027, doi:10.1007/s10584-011-0101-1, 2011a.
Stroeve, J. C., Maslanik, J., Serreze, M. C., Rigor, I., Meier, W., and Fowler, D.: Sea ice response to an extreme negative phase of the Arctic Oscillation during winter 2009/2010, Geophys. Res. Lett., 38, L02502, doi:10.1029/2010GL045662, 2011b.
Tivy, A., Howell, S. E. L., Alt, B., McCourt, S., Chagnon, R., Crocker, G., Carrieres, T., and Yackel, J. J.: Trends and variability in summer sea ice cover in the Canadian Arctic based on the Canadian Ice Service Digital Archive, 1960–2008 and 1968–2008, J. Geophys. Res., 116, C03007, doi:10.1029/2009JC005855, 2011.
Walsh, J. E., Chapman, W. L., and Portis, D. H.: Arctic cloud frac-tion and radiative fluxes in atmospheric reanalysis, J. Clim, 22, 2316–2334, 2009.
Wang, J., Zhang, J., Watanabe, E., Ikeda, M., Mizobata, K., Walsh, J. E., Bai, X., and Wu, B.: Is the dipole anomaly a major drier to record lows in Arctic summer sea ice extent?, Geophys. Res. Lett., 36, L05706, doi:10.1029/2008GL036706, 2009.
Wang, M. and Overland, J. E.: A sea ice free summer Arctic within 30 years – an update from CMIP5 models, Geophys. Res. Lett., 39, L18501, doi:10.1029/2012GL052868, 2012.
Wohlleben, T., Howell, S. E. L., Agnew, T., and Komarov, A.: Sea-Ice Motion and Flux within the Prince Gustaf Adolf Sea, Queen Elizabeth Islands, Canada during 2010, Atmos. Ocean, 51, 1–17, doi:10.1080/07055900.2012.750232, 2013.