MAYARA MORENA DÉL CAMBRE AMARAL WELLER
EFFECTS OF THERMAL ENVIRONMENT AND DIETARY PHOSPHORUS LEVELSIN PIG GENE EXPRESSION
Dissertação apresentada à Universidade Federal de Viçosa, como parte das exigências do Programa de Pós-Graduação em Genética e Melhoramento para obtenção do título de Magister Scientiae.
VIÇOSA
MAYARA MORENA DÉL CAMBRE AMARAL WELLER
EFFECTS OF THERMAL ENVIRONMENT AND DIETARY PHOSPHORUS LEVELSIN PIG GENE EXPRESSION
Dissertação apresentada à Universidade Federal de Viçosa, como parte das exigências do programa de Pós-Graduação em Genética e Melhoramento para obtenção do título de Magister Scientiae.
ii AGRADECIMENTOS
A DEUS, pela presença em todos os dias da minha vida por me dar perserverança e confiança para sempre seguir a diante.
À Universidade Federal de Viçosa pela oportunidade de realização do curso e ao CNPq pela concessão da bolsa de estudo.
Aos meus pais e namorado, pelo carinho e apoio incondicional. À minha madrinha e ao meu tio Roberto pelo incentivo e carinho.
À minha orientadora, Professora Simone Eliza Facioni Guimarães, que desde a iniciação científica sempre me deu grande apoio e tem me auxiliado na busca do conhecimento e pela orientação, confiança e amizade.
Aos meus coorientadores, Juarez Lopes Donzele e Paulo Sávio Lopes pela essencial colaboração e pelas importantes sugestões para a realização deste trabalho.
Aos amigos do LABTEC, pela amizade e paciência: Debora, Katiene, Priscila, Miguel, Carlos, Margareth, Carol, Ana Paula, Renata, Lucas and Erica;
Aos membros da banca de defesa.
iii BIOGRAFIA
Mayara Morena Dél Cambre Amaral Weller, filha de Ailton Alves Weller e Remy Gomes do Amaral, nasceu em 4 de abril de 1987 em Cachoeiro de Itapemirim, Espirito Santo, Brasil.
No 2005, iniciou o curso de Zootecnia, pelo Departamento de Zootecnia da Universidade Federal de Viçosa, em Viçosa, MG, onde foi bolsista de iniciação científica, acompanhando e conduzindo pesquisas junto ao Programa de Melhoramento Genético de Suínos do Departamento de Zootecnia da UFV.
Em janeiro de 2010, graduou-se em Zootecnia, pela Universidade Federal de Viçosa.
iv SUMÁRIO
RESUMO ... v
ABSTRACT ... vii
GENERAL INTRODUCTION ... 1
CHAPTER I (Article I) ... 3
ABSTRACT ... 3
RESUMO ... 5
Introduction ... 7
Material and Methods ... 9
Results ... 15
Discussion ... 18
Acknowledgment ... 25
References ... 25
CHAPTER II (Article II)... 41
ABSTRACT ... 41
RESUMO ... 42
Introduction ... 43
Materials and Methods ... 44
Results and Discussion ... 48
Acknowledgment ... 52
Literature cited ... 53
GENERAL CONCLUSION ... 62
APPENDIX 1 ... 63
v
RESUMO
WELLER, Mayara Morena Dél Cambre Amaral, M. Sc, Universidade Federal de Viçosa, fevereiro de 2012. Efeitos da temperatura ambiente e níveis de fósforo dietético na expressão gênica de suínos. Orientador: Simone Eliza Facioni Guimarães. Coorientadores: Juarez Lopes Donzele and Paulo Sávio Lopes.
vii
ABSTRACT
WELLER, Mayara Morena Dél Cambre Amaral, M. Sc, Universidade Federal de Viçosa, February 2012. Effects of thermal environment and dietary phosphorus levels in pig gene expression. Adviser: Simone Eliza Facioni Guimarães. Co-advisers: Juarez Lopes Donzele and Paulo Sávio Lopes.
1 GENERAL INTRODUCTION
Rising costs of feed, fuel, and fertilizer due to the implementation of biofuel policies and growing global demand for animal protein (Steinfeld et al., 2006) have intensified focus of pork industry on the creation and selection of leaner and more efficient pigs.
Studies have shown that animals that are less efficient in converting feed into body weight may present changes in the activity of the sodium and potassium pump, in the expression of genes of the electron transport chain, or in the concentrations of important hormones, including insulin-like growth factor I (IGF-I), growth factor (GH), thyroxin, triiodothyronine. This may influence nutrient utilization and basal metabolism, changing body energy expenditure, and consequently, caloric increment in animals (Bottje and Carstens, 2009; Johnson et al., 2003; Yunianto et al., 1997; Rosebrough and Murtry, 1993).
2 Among the nutrients supplemented in diets for pigs phosphorus (P) is of particular interest, due to its importance to several metabolic processes within the organism, such as energy metabolism, therefore, it is a critical nutrient for the synthesis of body protein. Moreover, due to the harmful effects of P excretion to the environment, its consumption by the animals must be regulated. However, little has been published on the analyses of gene expression when studying different dietary levels of available phosphorus (aP) for pigs.
In addition, it is important to investigate the effects of the thermal environment on the regulation of gene expression, especially in tropical countries, where high temperatures persist throughout the year. Several studies have demonstrated that high temperatures have negative effects on the performance of pigs during most phases of production (Christon, 1988; Quiniou et al., 2000; Collin et al., 2001a; Collin et al., 2002; Kerr et al., 2003), but little is known about the changes in muscular energy metabolism in heat-stressed pigs (Rinaldo and Le Dividich, 1991; Collin et al., 2001b) or on the interaction between dietary levels of aP and the thermal environment to which the animals are submitted.
3 CHAPTER I
(Article I)
Gene expression in pigs exposed to two thermal environments and fed different dietary available phosphorus levels
M. M. D. C. A. Weller1, L. Alebrante1, P. H. R. F. Campos1, A. Saraiva1, C.S. Nascimento1, B.A.N. Silva2, J. L. Donzele1, R.F.M. Oliveira1, F.F Silva3,
P.S.Lopes1, S. E. F. Guimarães1,a
1Animal Science Department/Departamento de Zootecnia, Universidade
Federal de Viçosa, 36570-000, Viçosa, MG, Brasil.
2IPG, Institute for Pig Genetics B.V., P.O. Box 43, 6640 AA Beuningen, The
Netherlands.
3Departament of Statistic, at Universidade Federal de Viçosa, 36570-000,
Viçosa, MG, Brazil.
ABSTRACT
4 treatments and 6 replications. These pigs were allotted to either thermoneutral ( 21.9 ± 1.4ºC and RH at 76.9 ± 5.7%) or heat stress (31.6 ± 0.7ºC and RH at 72.8 ± 5.9%) and then allotted to one of the 3 levels of dietary aP (0.116, 0.306 or 0.496%). The expression profiles of 9 genes were analyzed by quantitative real-time PCR. Six genes showed reduce expression (P<0.05) in phase 1 pigs and 8 genes (P<0.05) in phase 2 pigs maintained under heat stress compared to those kept in thermoneutral environment. The lower expression of these genes under high temperatures evidences the effects of heat stress by decreasing oxidative metabolism (oxidative phosphorylation) in order to reduce heat production, which reflecting on the reduction of the daily requirements for aP.Part of this effect is associated with concomitant reduction in voluntary feed intake and another part is suggested to be due to increased production of reactive oxygen species (ROS) in the mitochondria induced by heat stress resulting in downregulation of these genes. In pigs from phase 1, the ND1, ND2, CYTB, COX1, ATP5J2 and ATP6 genes were respectively differentially
expressed across aP levels (P<0.05) in the thermoneutral and ND2 gene in the hot environments. In pigs from phase 2, COX3 and ND2 genes were respectively differentially expressed across aP levels (P<0.05) in the thermoneutral and hot environments. These data reveal strong evidence that phosphorus is one of the key factors to regulate oxidative phosphorylation with direct implications on animal performance.
Keywords: electron transport chain, oxidative phosphorylation, pig lean deposition, qRT-PCR
Implications
5 RESUMO
O objetivo do estudo foi avaliar o perfil de expressão de genes codificantes para proteínas da cadeia tranpostadora de elétrons no músculo Longissimus dorsi (LD) de suínos. Quatro diferentes conjuntos de dados (n=12) foram
utilizadas a partir de 4 experimentos que avaliaram em duas diferentes fases de crescimento: fase 1 (15 a 30 kg) e fase 2 (30 a 60 kg), a exigência de níveis de fósforo disponível (Pd) em dietas para suínos machos castrados de alta deposição de carne magra mantidos em ambiente termoneutro e de estresse por calor. Os perfis de expressão de genes 9 foram analisados por PCR quantitativo em tempo real a partir de amostras de LD provenientes de quatro experimentos que avaliaram a exigência de níveis aP em dietas para suínos durante a fase de crescimento 1 (15 a 30 kg) mantidos a temperatura de 24.5 ± 1.2ºC e 34.1 ± 0.8ºC e durante a fase de crescimento 2 (30 a 60 kg) mantindos a temperatura de 21.9 ± 1.38ºC e 31.6 ± 0.7ºC. Os genes ND1, ND2, CYTB, COX1, ATP5J2 e ATP6 foram menos expressos (P< 0.05) nos suínos da fase 1
mantindo em estresse por calor em relação aqueles mantidos no ambiente termoneutro. Nos suíno da fase 2 de crescimento que estavam mantidos em estresse por calor apresentaram redução (P < 0.05) na expressão dos genes ND2, SDHD, CYTB, COX1, COX2, COX3, ATP5J2 e ATP6, em relação aqueles submetido ao ambiente termoneutro. A menor expressão desses genes nos suínos estressados por calor, prove evidências dos efeitos do estresse térmico sob o metabolismo oxidativo a fim de reduzir a produção de calor o que refletiu na redução da exigência de consumo diário de fósforo. Parte desse efeito pode estar associado a concomitante redução do consumo vonlutário e outra parte é sugerido ser devido ao aumento da produção de espécies reativas de oxigênio (ROS) nas mitocôndrias induzido pelo estresse por calor. Quantoa mudança nos padrões de expressão desses genes entre os níveis de Pd, verificou-se que nos suínos da fase 1, os genes ND1, ND2, CYTB, COX1, ATP5J2 e ATP6 mostraram-se diferencialmente expressos
6 revelam uma forte evidência de que o fósforo é um dos fatores chaves que regulam a fosforilação oxidativa com implicação direta sobre a performance animal.
7 Introduction
In order to improve the efficiency of lean meat production in modern pig lines, the requirements of important functional nutrients need to be re-estimated. Among these nutrients, phosphorus (P) is of particular interest, due to its importance to many processes within the organism, such as energy metabolism and protein synthesis. Moreover, due to the harmful effects of P excretion to the environment, its consumption by the animals must be regulated. Several studies have indicated that P requirements in pigs selected for high lean deposition differ across the different growth phases (Hendricks and Moughan, 1993; Stahly et al., 2000; Saraiva et al., 2009). However, little has been published on the analyses of gene expression when studying dietary levels of available phosphorus (aP) for pigs. Only two studies have shown that the need of aP is genotype specific (Hittmeier et al., 2006; Alexander et al., 2008).
In addition, it is important to investigate the effects of the thermal environment on the regulation of gene expression, especially in tropical countries, where high temperatures persist throughout the year. Several studies have demonstrated that high temperatures have negative effects on the performance of pigs during most phases of production (Christon, 1988; Quiniou et al., 2000; Collin et al., 2001a; Collin et al., 2002; Kerr et al., 2003), but there
9 Material and Methods
All methods involving animal handling were realized in accordance with the regulations approved by the Institutional Animal Welfare and Ethics/Protection commission from the Universidade Federal de Viçosa, Brazil.
Experimental design
Two experiments were carried out using 48 higher-lean growth pigs from two different growth phases: phase 1 from 15 to 30 kg and phase 2 from 30 to 60 kg. These experiments were designed as a 2 x 3 (2 different environment temperatures X 3 levels of dietary aP) factorial treatments comprising of 6 treatments and each growth phase.
Twenty -four pigs from growth phase 1 (15 to 30 kg) with initial weight of 15 ± 0.41kg, were assigned randomly on basis of live weigh to one of the 6 treatments. These pigs were allotted to either thermoneutral (24.5 ± 1.2ºC and RH at 76.3 ± 8.5% or heat stress (34.1 ± 0.8ºC and RH at 70.1 ± 8.1%) and then allotted to one of the 3 levels of dietary aP (0.107, 0.321 or 0.535%).
10 Pig Management
The pigs were housed in suspended metal cages, with wired mash floor and sides, equipped with semi-automatic feeders and nipple drinkers, located in rooms with controlled air temperature.
Experimental diets (Table 1 and Table 2) were mainly composed of corn/soybean meal supplemented with minerals, vitamins and industrial amino acids to meet the requirements of castrated male pigs from high lean meat deposition for each growth phase, as recommended by Rostagno et al. (2005) for all the nutrients, except for aP. Dietary concentrations of dicalcium phosphate, limestone, and kaolin were adjusted to achieve the desired concentrations of aP. Pigs had free access to feed and water throughout the entire experimental period (25 days). The pigs were weighed at beginning and end of the experimental period for calculation of average daily gain and feed conversion.
RNA Extraction and cDNA Synthesis
Four samples of LD muscle were collected during slaughter and immediately immersed in tubes containing 15 ml of RNAHolder® (BioAgency, São Paulo, Brasil) and stored at -20°C for subsequent RNA extraction.
11 treatment with DNase was performed on the columns using the RNase-free DNase Set (Qiagen, Valencia, CA), according to the manufacturer’s recommendations. RNA concentrations were checked by NanoVue Plus Spectrophotometer (GE Healthcare) with an optimal 260/280 ratio between 1.8 and 2.1. Purity and integrity were determined with an Agilent RNA 6000 Nano Kit using the Agilent 2100 Bioanalyzer (Agilent Technologies, Inc.)
The ProtoScriptM-MuLV First Strand cDNA Synthesis Kit (New England BioLabs Inc., Beverly, MA) was used to produce cDNA immediately after the RNA extraction. The reactions were performed with 6 g of total RNA (for each sample) and 2 L of 50 M oligo(dT)23VN primer, following the manufacturer’s
recommended protocol. The cDNA concentrations from the samples were estimated on a NanoVue PlusTM (GE Healthcare, Munich, Germany) spectrophotometer. Finally, the single-stranded cDNA samples were stored at – 20ºC for analysis.
Quantitative Real-time PCR
12 subunit 3; from Cytochrome c oxidase (complex IV); and ATP6, ATPase subunit 6, from the F1F0 ATPase complex (complex V).
The other 3 genes, SDHD, Succinate dehydrogenase subunit d, which is part of the succinate ubiquinone reductase complex (complex II); ATP5J2, ATPase subunit f, isoform 2 (complex V); and GAPDH, Glyceraldehyde 3-phosphate dehydrogenase, were obtained from the nuclear genome of Sus scrofa (Accession No. NM_001097516.1, NM_001097464.1 and AF017079.1,
respectively). The primers for the 10 genes were designed using PrimerQuest (www.idtdna.com/Scitools/Applications/PrimerQuest), provided by Integrated DNA Technologies, Inc. (Coralville, IA). The gene GAPDH (Glyceraldehyde 3-phosphate dehydrogenase) was used as a reference gene for normalization because it had been better efficiency and less variation across treatments than
-actin (data not shown). The primer pairs are listed in Table 3.
13 were done in duplicate and the coefficient of variation (CV) of cycle Ct value
from replicates within each sample was low, less than 5%, indicating acceptable accuracy and reproducibility (not shown).
Statistical Analyses
To study the combined effects of the dietary available phosphorus levels (aP) and the thermal environment on expression gene within each growing phase, a completely randomized design was applied in a factorial design 3 (aP) X 2 (thermal environment) using four replicates per treatment. All statistical procedures were performed using SAS (v. 9.1.3). The routine QPCR_MIXED SAS® [https://www.msu.edu/~steibelj/JP files/QPCR.html] developed to generate commands in SAS PROC MIXED suitable to analyze data from qRT-PCR, assuming independent random effects for reference gene and target genes in each biological replicate, was used in the analysis (Steibel et al., 2009). This statistical method is more accurate, powerful and flexible than existing alternatives for qRT-PCR data analysis, and it is especially useful in more complex experimental designs involving more than two treatments or time points and multiple experimental factors (Steibel et al., 2009). It was observed an interaction between the aP levels and the thermal environments, therefore
the data was analyzed using the linear mixed model:
ygikr = TGgi+ Cgik+ Dik + (Wik - ) + egikr
In this equation, ygikr corresponds to the Ct for the gth gene (control or
target) from the rth well, which corresponds to the kth animal submitted to the ith treatment (thermal environment and aP level combination); TGgiis the effect
gene-14 specific random effect of the kth animal;Dik ~ N(0, 2D) is the sample-specific
random effect (common to both genes); Wik is the covariate slaughter weight of
the kth animal submitted to the ith treatment; is the mean of the slaughter
weight; b is the regression coefficient; and egikr~ N(0, 2e ) is the residual term.
For each target gene, the comparison of the fold change values between treatments was performed by CONTRAST statement of the GLM procedure (SAS software) using Student’s test to the level of 5%. The "estimates" of the contrasts between treatments generated as results of statistical analysis, are the differences in Ct values between the treatments under evaluation and were
used to estimate the fold change (relative expression). The fold change values were obtained by transformation of the estimates (Ct) detected after statistical
analyses by calculation: fold change = 2-Estimate) .Once the efficiency (E) of the
qRT-PCR reaction was close or equal to 2.0, one cycle (Ct) of difference between two levels (or samples) means 2.0 fold change of difference, or still, twice as much expression in the first level in comparison with the second level. Also, understanding that higher Ct values means lower transcriptional expression of a specific gene for a specific sample relatively to others and that lower Ct values means higher transcriptional expression, negative values of “estimates” indicate a positive fold change (relative expression) of the first level relatively to the second under investigation, after applying the transformation
(Fold change= 2-Estimate).
15 Results
Due to the observed interactions between the aP levels and the thermal environments, the relative gene expression results were interpreted by contrast comparison two-by-two within one factor, aP levels or thermal environments (hot and thermoneutral), fixed for each level of the other factor (aP levels or thermal environments) for each target gene. The statistical analysis results for each contrast between treatments are shown in the supplementary table 1 and 2 (Appendix 1).
Pigs from growth phase 1 fed 0.107% aP in the diet showed A higher expression of the ND1 (P<0.01), CYTB (P<0.001), COX3 (P<0.001), ATP5J2 (P<0.01), and ATP6 (P<0.001) genes in the thermoneutral environment compared to those in the hot environment (Figure 1). Likewise, results for qRT-PCR analysis of the ND1 (P<0.05), CTYB (P<0.001), COX3 (P<0.05), ATP5J2 (P<0.05) and ATP6 (P<0.01) genes revealed significantly higher expression in pigs fed the 0.321% aP in the thermoneutral environment. As show in figure 1, pigs fed 0.535% aP diet had higher expression of ND2 (P<0.01) and cytb (P<0.001) genes compared with those in the hot environment.
16 for these genes in pigs fed the 0.306% aP diet in the thermoneutral environment compared to those in hot environment. Pigs fed the dietary level 0.496% aP also had higher expression of the ND2 (P<0.001), SDHD (P<0.05), COX2 (P< 0.001), COX3 (P<0.05), CYTB (P<0.01) and ATP6 (P<0.001) genes in the thermoneutral environment than those in hot environment. There was no difference in ND1 gene expression between thermal environments irrespective aP levels.
Pigs in the thermoneutral environment (24.5 ± 1.2ºC) from phase 1 had higher expression of the ND1 (P<0.05), ND2 (P<0.05), COX3 (P<0.05), CYTB (P<0.05), ATP5J2 (P<0.01) and ATP6 (P<0.05) genes when fed the 0.321% aP diet compared with pigs fed the 0.535% aP diet (Figure 3). No difference in the expression of the ND2, ND1, SDHD, COX1 and COX2 genes between aP levels in thermoneutral environment. As shown in figure 3, results for ND2 by qRT-PCR analysis revealed significantly (P<0.01) lower expression in pigs fed 0.321% aP diet compared to those fed 0.535% of aP diet in hot environment.
Results for qRT-PCR analysis in LD of pigs from growth phase 1 between 0.107 and 0.535% aP within each thermal environment are shown in Figure 4. There were differences in the expression of COX3 (P<0.01), CYTB (P< 0.05), ATP5J2 (P<0.01) and ATP6 (P<0.05) genes which exhibited higher expression in pigs fed the 0.107% aP diet than in pigs fed 0.535% aP diet in thermoneutral environment. The ND2 gene exhibited significantly (P < 0.001) lower expression in pigs fed 0.107% aP diet compared with those fed 0.535% aP diet (Figure 4).There were no differences in the expression of the ND1, SDHD, COX2, COX3, CYTB, ATP5J2 and ATP6 genes in pigs kept under heat
17 Results for qRT-PCR analysis in pigs from growth phase 2 between 0.116% and 0.306% of aP within each thermal environment are shown in Figure 5. Only the COX3 gene exhibited higher expression (P<0.05) in pigs fed the 0.306% of aP compared to those fed the 0.116% of aP in the thermoneutral environment. As shown in Figure 6, this same gene revealed (P < 0.05) higher expression in pigs fed the 0.306% of aP compared with those fed 0.496% of aP in the thermoneutral environment. In the hot environment (31.6 ± 0.7ºC), it was observed that pigs from growth phase 2 fed the 0.306% of aP had 2.64-fold higher expression (P<0.05) of the ND2 gene than those fed the 0.116% of aP. This gene was also expressed 3.32-fold higher (P<0.01) in pigs fed the 0.306% of aP than in pigs fed the 0.496% of aP (Figure 6). There were no differences in the expression of ND1, SDHD, cytb, COX1, COX2, ATP5J2 and ATP6 genes across aP levels irrespective to thermal environments.
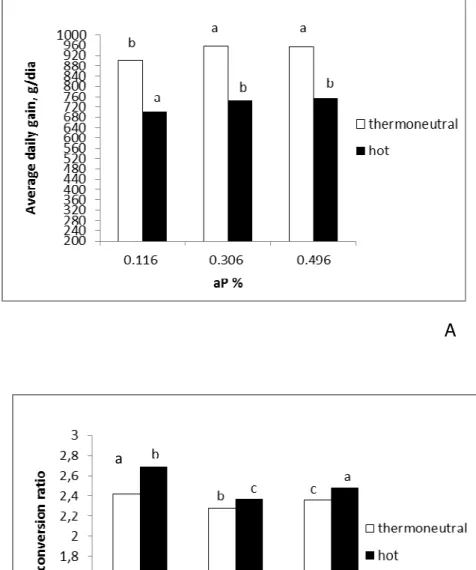
There was observed an interaction between the environmental temperature and dietary aP levels and on pigs performance from growth phase 1. As shown in figure 7, pigs maintained in the thermoneutral environment (24.5 ± 1.2ºC) and fed the 0.321% of aP had higher ADG (P<0.001) and better feed conversion than pigs fed the 0.107 or 0.535% of aP (P<0.001). But in the hot environment (34.1 ± 0.8ºC), pigs fed the 0.535% of aP had greater feed conversion than that pigs of fed the 0.321% or 0.107% of aP.
18 Discussion
Effects of the Environment on Electron Transport Chain Gene Expression
Several studies have demonstrated the negative impacts of high temperatures on pig performance in post weaning and growing pigs (Christon, 1988; Quiniou et al., 2000; Collin et al., 2002), including reduced voluntary feed intake and daily weight gain (Collin et al., 2001a; Kerr et al., 2003) as well as changes in muscular metabolic activity (Rinaldo and Le Dividich, 1991; Collin et al., 2001b). In contrast, very little has been published on the effects of the environment on the regulation of genes involved in energy metabolism, which is fundamentally important for understanding the mechanisms that underlie the metabolic changes in heat-stressed animals.
19 high temperatures resulted in hormonal changes, including a decrease in thyroid hormones, which are known to stimulate oxidative phosphorylation and ATP production. Studies by Nicol and Johnston (1981) and Rinaldo and Le Dividich (1991) revealed that the activities of enzymes involved in oxidative metabolism and glycolysis in muscles were reduced in pigs exposed to high temperatures.
Our results indicated that exposure to high temperatures (34.1 ± 0.8ºC) resulted in reduced expression of the gene ND1 and COX3 in growth phase 1 when fed diets containing 0.107 and 0.321% of aP and reduced ND2 gene expression when fed 0.535% of aP. Similarly, exposure of pigs in growth phase 2 to high temperatures (31.6 ± 0.7ºC) reduced the expression levels of the ND2, COX2 and COX3 genes irrespective to aP levels and reduced expression of the
COX1 gene in pigs fed 0.306% of aP. ND1 and ND2 are part of the P module of
20 (Carper et al., 1999; Iqbal et al., 2004). In addition, we also observed reduced expression of the ATP5J2 gene in growth phase 1 when pigs were fed 0.107 and 0.321% of aP and in phase 2 when pigs were fed 0.116% of aP, and also a reduction in ATP6 gene expression in phase 1 independent of dietary aP levels. ATP5J2 and ATP6 are proteins in the F0 domain of the F1F0 ATPase complex
(complex V). ATP6 is a key component of the proton channel (Nagley, 1988), and ATP5J2 is essential for the function of the F0 domain.
According to Drose and Brandt (2008) and Stowe and Camara (2009), mitochondria are the primary source of ROS (reactive oxygen species), such as superoxide (O2-), which are produced mainly by electron transport chain
complexes I and III. Mitochondria have been found to be especially sensitive to oxidative damage. In the presence of ROS, mitochondria undergo morphologic and biochemical changes, including loss of electron transport capacity (Zhang et al., 1990), decreased transcription and levels of mitochondrial gene products
(Kemp et al., 1994; Kristal et al., 1994; Crawford et al., 1997; Carper et al., 1999), protein oxidation (Marcillat et al.,1988; Grune et al., 1995) and lipid
peroxidation (Bindoli, 1988; Uchida, 2003). Thus, another factor that could be
associated with decreased transcription of these genes would be due to heat stress which induced oxidative stress (imbalance of ROS production and mitochondrial ROS removal systems). This would result in decreased activity of the enzymatic complexes due to oxidative damage and would lead to down-regulation of electron transport chain genes.
21 proteins. However, the actual mechanisms responsible for the induction of ROS production by heat stress are still not clear.
Effects of dietary P levels on Electron Transport Chain Gene Expression
Few studies have been done to elucidate the effects of dietary P levels on gene expression (Hittmeier et al., 2006; Alexander et al., 2008). The results obtained in this study revealed that different aP levels in the diet altered the expression of electron transport chain genes in both thermal environments.
Phosphate (Pi) has been demonstrated to directly influence
dehydrogenases and other enzymes involved in oxidative phosphorylation (Rodrigues-Zavala et al., 2000). In addition, Bose et al. (2003) studied the effects of Pi on various steps of oxidative phosphorylation in pig cardiac
mitochondria and showed that Pi regulated oxidative phosphorylation at several
levels, including the generation of NADH, the formation of the proton electrochemical gradient and directly as a substrate for ATP formation by the F1F0-ATPase. However, it has become evident that the cellular regulation of
oxidative phosphorylation is a complex network with various rate-limiting steps that are affected by a variety of signaling molecules, including Pi, Ca+2, creatine
and Mg+2 (Ernest et al., 1966; Brand and Kesseler, 1995), but the effects of each of these factors remain unclear.
22 0.535% of aP. This is in agreement with the performance results of pigs fed different of aP levels kept under thermoneutral environment, reported by Alebrante et al. (2011b) who verified that aP levels above 0.461%, which corresponded to a daily aP intake of 5.45 g, affected negatively the performance of the pigs. Thus, the consumption of P above the required level (0.535% aP) may compromise the expression of genes of the electron transport chain. Furthermore, this is consistent with the performance results of pigs fed 0.321% of aP had better feed conversion than pigs of fed 0.535% or 0.321% of aP. Thereby, it was evidenced that pigs are susceptible to inappropriate levels of phosphorus in the diet.
Interestingly, we observed higher expression of CYTB, ATP6, ATP5J2 and COX3 in pigs fed the 0.107% of aP compared with those fed the 0.535% of aP in the thermoneutral environment indicating that feeding sub-optimal aP levels may be less harmful to the expression of the electron transport chain genes in comparison with the excess. This is consistent with Fernández (1995) who evaluated the implications of increased aP intake on growing pigs and found that increased aP consumption did not result in higher P utilization for metabolism. On the contrary, pigs reduced bone resorption and increased urinary P excretion in response to increased intake of this nutrient.
23 by Alebrante et al. (2011b). This is confirmed by performance results of pigs fed 0.535% of aP had better feed conversion than pigs of fed 0.107% and 0.321% of aP.
During phase 2, we found a higher expression of COX3 gene in the pigs fed the 0.306% of aP compared to pigs fed the diets with 0.116 and 0.496% of aP in the thermoneutral environment. This is agreement with the performance results of pigs fed 0.306 % of aP had better feed conversion and great ADG than pigs fed 0.116% and 0.496% of aP in the thermoneutral environmental. Similarly, the diet with 0.306% aP led to increased ND2 gene expression compared with the other diets in the hot environment. These results provide evidence that 0.306% aP led to better respiratory chain function by providing P closer to the pigs requirement verified in the performance study conducted by P. H. R. F. Campos (unpublished results) in which the diets containing 0.331% aP, corresponding to a daily aP intake of 7.32 g in the thermoneutral environment, and 0.351% aP, corresponding to a daily aP intake of 6.36 g in hot environment, resulted in greatest performance of pigs.
Interaction between dietary levels of aP and the thermal environment
24 reflecting on different nutritional requirements (expressed in grams/day of feed) as demonstrated in this study by the reduction of requirement for daily aP intake.
The actual mechanisms responsible for the distinct patterns of the reduction of genes studied cannot be determined from this present study, but this may be reflected that electron transport chain genes are differentially affected to different dietary aP levels. However, we can state that in general, in pigs from phase1 the level of 0.321% aP diet under thermoneutral conditions and the level of 0.535% aP for pigs kept under high temperature conditions led to higher expression of electron transport chain genes and in pigs from growth phase 2, the level 0.306% of aP under both thermal environments led to an increased expression of electron transport chain genes. These results support that higher gene expression is associated with better respiratory chain function and likely better ATP production efficiency. The association between oxidative phosphorylation and animal performance suggested in our findings is consistent with studies that compared the performances of beef cattle (Archer et al., 1999; Castro-Bulle et al., 2007) and poultry (Bottje et al. 2002; Iqbal et al., 2004; Bottje and Carstens, 2009) with mitochondrial function. Bottje et al. 2002 suggested that the differences in performance of genetically similar animals might be partially due to mitochondrial inefficiency, as the mitochondria is responsible for 90% of the cellular production of ATP.
25 conducted by our team to assign expression profiles of genes that encode the mitochondrial antioxidant systems that neutralize ROS, such as glutathione peroxidase and superoxide dismutase. We also showed that different amounts of aP in the feed alter electron transport chain gene expression. These data reveal strong evidence that the nutrient phosphorus, as well as environmental temperature, are part of the key factors regulating oxidative phosphorylation with direct implications on animal performance.
Acknowledgment
The authors gratefully acknowledge CNPq, FAPEMIG and CAPES for their support of this research.
References
Alebrante, L., J. L. Donzele, R. F. M. Oliveira, A. Saraiva, S. E. F. Guimarães, and A. S. Ferreira. 2011a. Available phosphorus levels in diets for pigs with high genetic potential for lean meat kept in thermoneutral environment from 15 to 30 kg. Revista Brasileira de Zootecnia 40, 323-330.
Alebrante, L., J. L. Donzele, R. F. M. Oliveira, A. Saraiva, S. E. F. Guimarães, and A. S. Ferreira. 2011b. Available phosphorus levels in diets for pigs with high genetic potential for lean meat kept in hot environment from 15 to 30 kg. Revista Brasileira de Zootecnia 40, 2725-2731.
Alexander, L. S., A. Qu, S. A. Cutler, A. Mahajan, S. M. Lonergan, M. F. Rothschild, T. E. Weber, B. J. Kerr, and C. H. Stahl. 2008. Response to dietary phosphorus deficiency is affected by genetic background in growing pigs. Journal of Animal Science 86, 2538-2595.
Archer, J. A., E. C. Richardson, R. M. Herd, and P. F. Arthur. 1999. Potential for selection to improve efficiency of feed use in beef cattle: Review. Australian Journal of Agricultural Research 50, 147-161.
26 Brand, M. D., and A. Kesseler. 1995. Control analysis of energy metabolism in
mitochondria. Biochemical Society Transactions 23, 371-376.
Brandt, U. 2006. Energy converting NADH: Quinone oxidoreductase (complex I). Annual Review of Biochemistry 75, 69-92.
Bose, S., S. French, F. J. Evans, F. Joubert, and R. S. Balaban. 2003.
Metabolic network control of oxidative phosphorylation. Journal of Biological Chemistry 278, 39155-39165.
Bottje W., M. Iqbal, Z. X. Tang, D. cawthon, R. Okimoto, t. wing and M. Cooper.2002. Association of mitochondrial function with feed efficiency within a single genetic line of male broilers. Poultry Science 81, 546-555. Bottje, W. G., and G. E. Carstens. 2009. Association of mitochondrial function
and feed efficiency in poultry and livestock species. Journal of Animal Science 87, E48-E63.
Carper, D. A., J. K. Sun, T. Iwata, J. S. Sigler Jr., N. Ibaraki, L. R. Lin, and V. Reddy. 1999. Oxidative stress induces differential gene expression in human lens epithelial cell line. Investigative Ophthalmology& Visual Science 40, 400-406.
Castro-Bulle, F. C. P., P. V. Paulino, A. C. Sanches, and R. D. Sainz. 2007. Growth, carcass quality, protein and energy metabolism in beef cattle with different growth potentials and residual feed intakes. Journal of Animal Science 85, 928-936.
Christon, R. 1988. The effect of tropical ambient temperature on growth and metabolism in pigs. Journal of Animal Science 66, 3112-3123.
Coffey, R. D., G. R. Parker, and K. M. Laurent. Feeding growing-finishing pigs to maximize lean grow rate. 2000. University of Kentucky. College of Agriculture. Retrieved September 15, 2011, from http://www.animalgenome.org/edu/PIH/prod_grow_finish.pdf
Collin, A., J. van Milgen, S. Dubois, and J. Noblet. 2001a. Effect of high temperature on feeding behavior and heat production in group-housed young pigs. British Journal of Nutrition 86, 63-70.
27 Collin, A., M. J. Vaz, and J. Le Dividich. 2002. Effects of high temperature on body temperature and hormonal adjustments in piglets. Reproduction Nutrition Development 42, 45-53.
Crawford, D. R., Y. Wang, G. P. Schools, J. Kochheiser, and K. J. Davies. 1997. Down regulation of mammalian mitochondrial RNAs during oxidative stress. Free Radical Biology & Medicine 22, 551-559.
Drose, S., and U. Brandt. 2008. The mechanism of mitochondrial superoxide production by the cytochrome bc1 complex. Journal of Biological Chemistry
283, 21649-21654.
Ernest, L., C. Lee, and S. Jnada. 1966. Biochemistry of Mitochondria. Academic Press, London, UK.
Fernández, J. A. 1995. Calcium and phosphorus metabolism in growing pigs. III. A
model resolution. Livestock Production Science 41, 255-261.
Grune, T., T. Reinheckel, M. Joshi, K. J. Davies. 1995. Proteolysis in cultured liver ephitelial cells during oxidative stress: Role of multicatalytic roteinase complex, proteasome. Journal of Biological Chemistry 265, 1633-16336. Hendricks, L. J., and P. J. Moughan. 1993. Whole-body mineral composition of
entire male and female pig proteins at maximal rates. Livestock Production Science 33, 161-170.
Hittmeier, L. J., L. Grapes, R. L. Lensing, M. F. Rothschild, and C. H. Stahl. 2006. Genetic background influences metabolic response to dietary phosphorus restriction. Journal Nutrition of Biochemistry 17, 385-395.
Iqbal, M., N. R. Pumford, Z. X. Tang, K. Lassiter, T. Wing, M. Cooper, and W. Bottje. 2004. Low feed efficient broilers within a single genetic line exhibit higher oxidative stress and protein expression in breast muscle with lower mitochondrial complex activity. Poultry Science 83, 474-484.
Kemp, T. J., H. C. Causton, and A. Clerk. 2003. Changes in gene expression induced by H2O2 in cardiac myocytes. Biochemistry and Biophysical
Research Communications 307, 416-421.
28 Kristal B. S., Kim J. D., Yu B. P. 1994. Tissue-specific susceptibility to peroxyl radical- mediated inhibition of mitochondrial transcription. Redox Report 1, 51-55.
Lin, C.-S., Y.-L. Sun, C.-Y. Liu, P.-C. Yang, L.-C. Chang, I.-C. Cheng, S. J. T. Mao, and M.-C. Huang. 1999. Complete sequence of pig (Sus scrofa) mitochondrial genome and dating evolutionary divergence within Artidactyla. Gene 236, 107-114.
Marcillat, O., Y. Zhang, S. W. Lin, K. J. Davies. 1988. Mitochondrial contain a proteolytic system which can recognize and degrade oxidatively-denatured proteins. Biochemical Journal 254, 677- 683.
Mujahid, A., N. R. Pumford, W. Bottje, K. Nakagawa, T. Miyazawa, Y. Akiba, and M. Toyomizu. 2007. Mitochondrial oxidative damage in chicken skeletal muscle induced by acute heat stress. Poultry Science 44, 439-445.
Nagley, P. 1988. Eukaryote membrane genetics: The Fo sector of mitochondrial
ATP synthase. Trends in Genetics 4, 46-52.
Nicol, C. J. M., and I. A. Johnston. 1981. Energy metabolism of fast and slow-twitch skeletal muscle in the rat thyroid hormone induces changes. Journal of Comparative Physiology 142, 465-472.
Quiniou, N., S. Dubois, and J. Noblet. 2000. Voluntary feed intake and feeding behaviour of group-housed growing are affected by ambient temperature and body weight. Livestock Production Science 63, 245-253.
Rinaldo, D., and J. Le Dividich. 1991. Effects of warm exposure on adipose tissue and muscle metabolism in growing pigs. Comparative Biochemistry and Physiology 100, 995-1002.
Rodrigues-Zavala, J. S, J. P. Pardo, and R. Moreno-Sánchez. 2000. Modulation of 2-oxoglutarate dehydrogenase complex by inorganic phosphate, Mg2+, and other effectors. Archives of Biochemistry and Biophysics 379, 78-84. Rostagno, H. S., L. F. T. Albino, J. L. Donzele, P. C. Gomes, R. F. M. Oliveira,
D. C. Lopes, A. S. Ferreira, and S. L. T. Barreto. 2005. Brazilian Tables for Poultry and Swine: Composition of Feedstuffs and Nutritional Requirements. 2nd ed. Department of Animal Science, Viçosa Federal University, Viçosa, Minas Gerais, Brazil.
15-29 30 kg genetically selected for meat deposition. Revista Brasileira de Zootecnia 38, 307-313.
SAS Institute. 2007. SAS OnlineDoc, Version 9.1.3. SAS Institute Inc., Cary, NC.
Scheffler, I. 1999. Mitochondria. Wiley-Liss Inc., New York, NY.
Stahly, T. S., T. R. Lutz, and R. D. Clayton. 2000. Dietary available phosphorus needs of high lean pigs fed from 9 to 119 kg body weight. ISU Swine Research. Iowa State University extension. Retrieved December 20, 2010, from http://www.ipic.iastate.edu/reports/00swinereports/asl-655.pdf.
Steibel, J. P., R. Poletto, P. M. Coussens, and G. J. M. Rosa. 2009. A powerful and flexible linear mixed model framework for the analysis of relative quantification RT-PCR data. Genomics 94, 146–152.
Stowe, D. F., and A. K. S. Camara. 2009. Mitochondrial reactive oxygen species production in excitable cells: Modulators of mitochondrial and cell function. Antioxidants and Redox Signaling 11, 1373-1414.
Uchida, K. 2003. 4-Hydroxy-2-nonenal: a product and mediator of oxidative stress. Progress in Lipid Research 42, 318–343.
Yu, C. H. Tian, L. Zhang, K. Deng, S. K. Shenoy, L. Yu, D. Xia, H. Kim, and J. Deisenhofer. 1999. Structural basis of multifunctional bovine mitochondrial cytochrome bc1 complex. Journal of Bioenergetics and Biomembranes 31,
191-199.
30 Table 1. Diet composition from growth phase 1.
Dietary available P(aP), %
Item 0.107 0.324 0.535
Ingredient (%)
Corn 62.011 62.011 62.011
Soybean meal, 45% 32.00 32.00 32.00
Soybean oil 1.810 1.810 1.810
Dicalcium phosphate - 1.156 2.312
Limestone 1.837 1.098 0.360
Kaolin 1.200 0.783 0.365
Salt 0.456 0.456 0.456
Vitamin premix1 0.100 0.100 0.100
Mineral premix2 0.050 0.050 0.050
Growth promoter3 0.075 0.075 0.075
Growth promoter3 0.030 0.030 0.030
L-lisine HCL 0.282 0.282 0.282
DL- methionine 0.073 0.073 0.073
L- threonine 0.066 0.066 0.066
BHT (butylhydroxytoluene) 0.010 0.010 0.010
Calculated composition
ME (kcal/kg) 3250 3250 3250
Crude protein (%)4 19.891 19.891 19.891
Digestible lysine (%)4 1.146 1.146 1.146
Calcium (%) 0.800 0.800 0.800
Sodium (%) 0.200 0.200 0.200
Total P analyzed (%) 0.344 0.546 0.782
Available P (%) 0.107 0.321 0.535
¹ Provided per kg: A vitamin 8.000.000 IU; D3 vitamin 2.000.000 IU; E vitamin -10.000 mg; K3 vitamin - 1.500 mg; B12 vitamin - 20.000 mg; B2 vitamin - 5.000 mg; biotin - 50 mg; calcium pantothenate - 12.000 mg; niacin - 25.000 mg; antioxidant - 30.000 mg; B1 vitamin - 1.500 mg; B6 vitamin - 2.000 mg; folic acid - 800 mg; selenium - 320 mg; vehicle q.s.q - 1.000 g.
² Provide per kg of product: iron 100.000 mg; copper 30.000 mg; manganese -70.000 mg; zinc - 160.000 mg; iodine - 1900 mg; and vehicle q.s.p. - 1000 g.
³ Provided per kg of product: colistin - 80.000 mg; and tylosin- 400.000mg.
4
31 Table 2. Diet composition from growth phase 2.
Dietary available P(aP), %
Item 0.116 0.306 0.496
Ingredient (%)
Corn 55.930 55.930 55.930
Soybean meal (45% CP) 39.485 39.485 39.485
Soybean oil 1.483 1.483 1.483
Dicalcium phosphate - 1.029 2.056
Limestone 1.353 0.696 0.041
Salt 0.415 0.415 0.415
Vitamin premix1 0.100 0.100 0.100
Mineral premix2 0.050 0.050 0.050
Growth promoter3 0.050 0.050 0.050
Growth promoter3 0.013 0.013 0.013
L-lisine HCL 0.282 0.282 0.282
DL- methionine 0.025 0.025 0.025
BHT (butylhydroxytoluene) 0.010 0.010 0.010
Calculated composition
ME (kcal/kg) 3238 3238 3238
Crude protein (%)4 22.5 22.5 22.5
Digestible lysine (%)4 1.105 1.105 1.105
Calcium (%) 0.631 0.631 0.631
Sodium (%) 0.183 0.183 0.183
Total P analyzed (%) 0.344 0.534 0.724
Available P (%) 0.116 0.306 0.496
¹ Provided per kg: A vitamin 8.000.000 IU; D3 vitamin 2.000.000 IU; E vitamin -10.000 mg; K3 vitamin - 1.500 mg; B12 vitamin - 20.000 mg; B2 vitamin - 5.000 mg; biotin - 50 mg; calcium pantothenate - 12.000 mg; niacin - 25.000 mg; antioxidant - 30.000 mg; B1 vitamin - 1.500 mg; B6 vitamin - 2.000 mg; folic acid - 800 mg; selenium - 320 mg; vehicle q.s.q - 1.000 g.
² Provide per kg of product: iron 100.000 mg; copper 30.000 mg; manganese -70.000 mg; zinc - 160.000 mg; iodine - 1900 mg; and vehicle q.s.p. - 1000 g.
³ Provided per kg of product: colistin - 54.000 mg; and tylosin- 174.000mg.
4
32 Table 3. Gene names, primer pair sequences, annealing temperatures and amplification efficiencies of each target.
Gene Name Primer sequence (5’-3’)a Annealing temperature , ºC
Efficiency
ND1 F- TCAACCCTAGCAGAAACCAACGA R- AAGAATATGGCGAAAGGTCGGCT
60.5 0.90
ND2 F- TTTCCTAACACAAGCCACAGCCTC R- ATGCCTTGGGTTACTTCTGGGACT
60 0.90
SDHD F- TACAGCACATTCACCTGTCACCCA R- AGTCCATCGCAGAGCAAGGATTA
60.3 0.95
CYTB F- TCACACGATTCTTCGCCTTCCACT R- TAGGGTTGTTGGATCCGGTTTCGT
60.4 0.93
COX1 F- ATGGGCTCACCACATATTCACCGT R- TTAATATTGCCGCCGTGCAGGGTA
60.5 0.90
COX2 F-TGGCTTACCCTTTCCAACTAGGCT R- TTGGGCATCCATTGTGCTAGTGTG
60.1 0.92
COX3 F- ACACCCGAATTAGGAGGTTGCTGA R- TACGCCTAGTGCAATGGTGATGGA
60.2 0.90
ATP5J2 F- GGCATTGCCGGAGCATTTCAAAGA R- GTATTTGCGCAGCCGCTCATGTTT
60.6 0.95
ATP6 F- TACCACACTCATTCACACCCACCA R- TGTTCCTTGTGGTAGAAAGTGGGC
59.9 0.92
GAPDH F- CAAAGTGGACATTGTCGCCATCA R- AGCTTCCCATTCTCAGCCTTGACT
60 0.97
aF = forward; R = reverse.
ND1- NADH dehydrogenase subunit 1; ND2- NADH dehydrogenase subunit 2;
35 Figure 3. Quantitative RT-PCR results for six genes that exhibited differential expression on LD of pigs from growth phase 1 between 0.321 and 0.535 % aP within each thermal environment. Results are presented as fold change for expression at level 0.321% aP relative to expression at 0.535 % aP, such that the bars above the origin indicate higher expression at level 0.321% aP and bars below the origin indicate lower expression at level 0.321% aP. *P < 0.05; **P < 0.01.
38 Figure 6. Quantitative RT-PCR results for two genes that exhibited differential expression on LD of pigs from growth phase 2 between 0.306 and 0.496% aP within each thermal environment. Results are presented as fold change for expression at level 0.306% aP relative to expression at 0.496% aP, such that the bars above the origin indicate higher expression at level 0.306% aP and bars below the origin indicate lower expression at level 0.306 % aP. *P < 0.05;
39
A
B
40
A A
B
Figure 8. Average daily gain (A), and feed conversion ratio (B) of pigs from growing phase 2 submitted to treatments (3 different levels of aP levels within each thermal environment). Letters above the bars represent the comparison among treatment means. Different letters indicate statistical difference (P<0.05) by the test of Tukey.
41 CHAPTER II
(Article II)
Heat stress stimulates mitochondrial production of reactive oxygen species in pig skeletal muscle
M. M. D. C. A. Weller*, L. Alebrante*, P. H. R. F. Campos*, A. Saraiva*,C.S. Nascimento*, B.A.N. Silva§, J. L. Donzele*, R.F.M. Oliveira*, F.F Silva†, P.S.Lopes*
and S. E. F. Guimarães*
*Animal Science Departament/Departamento de Zootecnia, Universidade Federal de Viçosa, 36570-000, Viçosa, MG, Brasil
§IPG, Institute for Pig Genetics B.V., P.O. Box 43, 6640 AA Beuningen, The Netherlands
†Departament of Statistic, Universidade Federal de Viçosa, 36570-000, Viçosa, MG, Brasil
ABSTRACT
42 results provide evidences that heat stress stimulates mitochondrial ROS production on LD muscle of pigs.
Keywords: antioxidants enzymes, pig production, qRT-PCR
RESUMO
Estresse por calor é um fator ambiental que poderia ser responsável por estimular a produção de espécies reativas de oxigênio (ROS). Assim, este estudo foi realizado para avaliar o perfil de expressão dos genes superóxido dismutase 2 (SOD2), glutatinona peroxidase 1 (GPx1) e catalase (CAT) no músculo Longissimus dorsi (LD) de suínos de 2 diferentes fases de crescimento: 15 a 30 kg e 30 a 60 kg, submetidas ao estresse por calor. Oito suínos da fase 1 de crescimento de pesos similares, foram designados aleatoriamente para um dos dois grupos de tratamentos: O grupo 1 (n=4) foi mantido em uma sala climatizada mantida em 24.5 ± 1.2ºC e 76.3 ± 8.5% UR, enquanto que, o grupo 2 foi mantido em uma sala climatizada à 34.1 ± 0.8ºC e 70.1 ± 8.1% UR. Da mesma forma, oito porcos da fase 2 de pesos similares, foram designados aleatoriamente para um dos dois grupos de tratamentos: O grupo 1 (n=4) foi mantido em uma sala climatizada à 21.9 ± 1.4ºC e 76.9 ± 5.7% UR, enquanto que, o grupo 2 (n=4) foi mantido em uma sala climatizada à 31.6 ± 0.7 ºC e 72.8 ± 5.9% UR. As análises de qRT-PCR mostraram que os genes GPx1, SOD2 e CAT foram (P<0.05) mais expressos nos suínos expostos à altas temperaturas. Esses resultados provêm evidências de que estresse por calor estimula a produção mitocondrial de ROS no musculo LD de suinos.
43 Introduction
Heat stress is of major concern for pig industry, especially in tropical countries because of the resulting deleterious effects on fertility in sows (Omtvedt et al., 1971), negative impacts on pig performance in post weaning, growing pigs (Christon, 1988; Quiniou et al., 2000; Collin et al., 2002) including reduced voluntary feed intake and daily weight gain (Collin et al., 2001a; Kerr et al., 2003) as well as changes in muscle metabolism (Rinaldo and Le Dividich, 1991; Collin et al., 2001b). From the viewpoint of environmental health, the harmful effects of heat stress on organism have become matter of concern.
Heat stress was proposed to be responsible for stimulating reactive oxygen species (ROS) production because of similarities in gene expression patterns observed following heat stress compared with that following exposure to oxidative stress (Schiaffonati et al., 1990; Salo et al., 1991; Flanagan et al., 1998; Wang et al., 2000; Zuo et al., 2000). Heat-induced ROS formation may be the factor that causes molecular changes in DNA, proteins and lipids (Bruskov et al., 2002) which may be result at mitochondrial level in bioenergetics dysfunctions. Given that the mitochondria serve as the principal source of ROS in cells (Chance et al., 1979), it is likely that in heat-stressed animals ROS are mainly produced in skeletal muscle mitochondria. More recently Mujahid et al. (2005) reported the mitochondrial ROS generation in skeletal muscle of heat-exposed broilers. However, there is still no evidence of the increased ROS production in heat-stressed pigs.
44 Materials and Methods
All methods involving animal handling was done in accordance with regulations approved by the Institutional Animal Welfare and Ethics/Protection commission from the Universidade Federal de Viçosa, Brazil.
Data
Sixteen pigs (male castrated) from a commercial lines of two different growth phases: phase 1 (15 to 30 kg) and phase 2 (from 30 to 60 kg) were used in this trial. Eight pigs from growth phase 1 of similar BW, were assigned randomly to one of the two treatment groups: one group (n=4) were reared in suspended metal cages and kept in a climate-controlled room maintained at 24.5 ± 1.2ºC and the RH (relative humidity) at 76.3 ± 8.5%, whereas the other 4 phase 1 pigs were kept in a climate-controlled room maintained at 34.1 ± 0.8ºC and RH at 70.1 ± 8.1% considered as heat stress environment for this animal category (Coffey et al., 2000).
Likewise, 8 pigs from growth phase 2 of similar BW, were assigned randomly to one of the two treatment groups: one group (n=4) was reared in suspended metal cages and kept in a climate-controlled room maintained at 21.9 ± 1.4ºC and relative humidity of 76.9 ± 5.7% considered as thermoneutral environment for this animal category (Coffey et al., 2000) whereas others 4 pigs of growth phase 2 were kept in a climate-controlled room maintained at 31.6 ± 0.7ºC and RH at 72.8 ± 5.9%, considered as heat stress for this animal category (Coffey et al., 2000).
45 RNA Extraction and cDNA Synthesis
The samples of Longissimus dorsi (LD) were collected during slaughter and immediately immersed in tubes containing 15 ml of RNAHolder® (BioAgency, São Paulo, Brasil) and stored at -20°C for subsequent RNA extraction.
The total RNA from each LD sample was isolated using approximately 40 mg of tissue previously stored in RNAHolder®. The samples were homogenized in buffer RLT containing 1% -mercaptoethanol (RNeasy Mini Kit) and lysed with a tissue ruptor (Qiagen, Valencia, CA) homogenizer. The total RNA from the LD muscle samples was extracted with the RNeasy Mini Kit (Qiagen, Valencia, CA) following the manufacturer’s recommendations. Additional treatment with DNase was performed on the columns using the RNase-free DNase Set (Qiagen, Valencia, CA), according to the manufacturer’s recommendations. RNA concentrations were checked by NanoVue Plus Spectrophotometer (GE Healthcare) with an optimal 260/280 ratio between 1.8 and 2.1. Purity and integrity were determined with an Agilent RNA 6000 Nano Kit using the Agilent 2100 Bioanalyzer (Agilent Technologies, Inc.)
46 Quantitative Real-time PCR
The genes GPx1, glutathione peroxidase 1; SOD2- superoxide dismutase 2 mitochondrial; CAT – catalase and GAPDH, Glyceraldehyde 3-phosphate dehydrogenase, were obtained from the nuclear genome of Sus scrofa (Accession No. NM_ 214201.1, NM_214127.2, NM_214301.1 and AF017079.1, respectively). The primers for the 4 genes were designed using PrimerQuest (www.idtdna.com/Scitools/Applications/PrimerQuest), provided by Integrated DNA Technologies, Inc. (Coralville, IA). The gene GAPDH (Glyceraldehyde 3-phosphate dehydrogenase) was used as a reference gene for normalization as it showed better efficiency and less variation across treatments than -actin (data not shown). The primer pairs are listed in Table 3.
47 from replicates within each sample was low, less than 5%, indicating acceptable accuracy and reproducibility (not shown).
Statistical Analyses
To study the effects of the thermal environment at each growing phase, it was used a completely randomized design with four replicates per thermal environment. All statistical procedures were performedusing SAS (v. 9.1.3). The routine QPCR_MIXED SAS® [https://www.msu.edu/~steibelj/JP files/QPCR.html] developed to generate commands in SAS PROC MIXED suitable to analyze data from qRT-PCR, assuming independent random effects for reference gene and target genes in each biological replicate, was used in the analysis (Steibel et al., 2009). Data was analyzed using the linear mixed model:
ygikr = TGgi+ Cgik+ Dik + egikr
In this equation, ygikr corresponds to the Ct for the gth gene (control or target) from the rth well, which corresponds to the kth animal submitted to the ith thermal environment; TGgi is the effect of thermal environment on the expression of gene g; Cgik ~ N(0, 2
C) is the gene-specific random effect of the kth animal;Dik ~ N(0, 2D) is the
sample-specific random effect (common to both genes); and egikr ~ N(0, 2e) is the residual term.
48 values between the treatments under evaluation and were used to estimate the fold change (relative expression).
The fold change values were obtained by transformation of the estimates (Ct) detected after statistical analyses by calculation: fold change = 2-Estimate. Once the efficiency (E) of the qRT-PCR reaction was close or equal to 2.0, one cycle (Ct) of difference between two levels (or samples) means 2.0 fold change of difference, or still, twice as much expression in the first level in comparison with the second level. Also, understanding that higher Ct values means lower transcriptional expression of a specific gene for a specific sample relatively to others and that lower Ct values means higher transcriptional expression, negative values of “estimates” indicate a positive fold change (relative expression) of the first level relatively to the second under investigation, after applying the transformation (Fold change = 2-Estimate).
Results and Discussion
Our previous study (chapter I) revealed that exposing pigs to high temperatures resulted in decreased transcription of mitochondrial electron transport chain (ETC) genes which may be linked to the heat-induced ROS production. It has been shown that heat-induced ROS formation may be the factor that causes molecular damages in DNA, proteins, lipids and others biological molecules (Bruskov et al., 2002). Ando et al. (1997) reported that heat stress has potential to cause increases of ROS, possibly by the disruption of electron transport assemblies of the membrane.
49 flux of ROS in rat intestinal epithelial cell monolayers following exposure to a temperature of 45ºC. Zuo et al. (2000) also showed heat-stress stimulated intracellular and extracellular ROS production, particularly superoxide formation, in mouse diaphragm muscle.
Oxidative stress is an expression used to describe various deleterious processes resulting from an imbalance between the excessive formation of ROS and limited antioxidants defenses. The triggering factors for the oxidative stress may be diverse, ranging from hereditary or acquired genetic defects (mutations) or environmental factors, such as radiation, toxins (Andreyev et al., 2005), beyond the suggested heat stress. More recently Mujahid et al. (2005) revealed overproduction of ROS in the skeletal muscle mitochondria of heat-exposed broilers. However, there is still no evidence of the increased ROS production in pigs exposed to heat stress.
50 Results for qRT-PCR analyses of three genes showed that expression was (P<0.05) higher in stressed pigs from growth phase 1 (Figure 1) and in heat-stressed pigs growth phase 2 (Figure 2). The statistical results for each contrast between treatments within eachgrowth phase can be checked in the supplementary table 1 and 2 (Appendix 2).
Cells are equipped with many enzymes to detoxify cytoplasmic and mitochondrial ROS (Andreyev et al., 2005; Koehler et al., 2006). Up to a limit, mitochondrial and cytoplasmic antioxidant systems are capable of neutralizing excess of ROS. Superoxide dismutases (SODs) are the major ROS detoxifiers of the cell (Fridovich, 1989). Three types of SOD, encoded by different genes, exist in the cell (Fridovich, 1989). Superoxide dismutase 2 (SOD2), also known as manganese-superoxide dismutase (Mn-SOD), is expressed exclusively within the mitochondrial matrix (Weisiger and Fridovich, 1973; Okado-Matsumodo and Fridovich, 2001) and thus is an essential defender against mitochondrial superoxide radicals among antioxidative enzymes. It catalyzes the dismutation of superoxide radicals to hydrogen peroxide (H2O2) and molecular oxygen (Fridovich, 1995). In this study, SOD2 gene was 12.82-fold higher (P<0.05) in heat-stressed pigs from phase 1(figure 1) and 15.46-fold higher (P<0.01) in heat-stressed pigs from phase 2 (Figure 2). Similarly, Yamashita et al. (1997) reported significant increase in levels of Mn-SOD mRNA, in rat myocytes after exposure to heat stress. Wang et al.( 2000), also demonstrated heat stress stimulated overproduction of ROS in rat myocytes which led to increased activity of superoxide dismutases (Mn-SOD, Zn-SOD).
51 various cellular compartments including the mitochondrial matrix (Asayama et al., 1994; Esworthy et al., 1997) and intermembrane space (Panfili et al., 1991).
GPx1 has long been viewed as one of the most important parts of cellular and mitochondrial ROS-defense network, and apparently it is involved in protecting tissues and mitochondria against acute oxidative stress rather than providing a major defense against low-level endogenous mitochondrial ROS production (Andreyev et al., 2005). In this study, GPx1 gene was 8.42-fold higher (P<0.05) in heat-stressed pigs from phase 1 (figure 1) and 9.84-fold higher (P<0.05) in heat-stressed pigs from phase 2 (Figure 2). These results are consistent with the study of Kemp et al. (2003) who reported overexpression of genes associated with detoxification and removal of ROS (superoxide dismutase, glutathione peroxidase) in rat myocytes exposed oxidative stress induced by different concentrations of H2O2.
Catalase is another important H2O2 detoxifying enzyme (Chelikani et al., 2004; Zamocky et al., 2008), which was 2.94 fold higher (P<0.05) in heat-stressed pigs from phase 1 (figure 1) and 3.11-fold higher (P<0.01) in heat-stressed pigs from phase 2 (Figure 2). There is some controversy with respect to mitochondrial catalase, this enzyme has been found in the nucleus, peroxisomes, sarcoplasm, but not mitochondria (Zhou and Kang, 2000). However, other labs have reported mitochondrial localization of catalase (Salvi et al., 2007), and the presence of catalase within the matrix of rat heart mitochondria (Radi et al., 1991). The higher expression of CAT gene in heat-stressed pigs indicates importance of this enzymes for neutralize increased fluxes of H2O2 that may diffuse from mitochondria to cytosol during oxidative stress phenomena.
52 support that an increase of ROS in mitochondria may lead to oxidative damages, such as, nonspecific modification of lipids, proteins and nucleic acid, which then result perturbations in the physiological function of mitochondria inevitably disturb metabolism, leading to reduction in growth performance. This approach is consistent with previous study that shown downregulation of mitochondrial electron transport chain genes, and consequently, worst performance pigs resulting from heat stress. Thus, it is clear that the increase of mitochondrial ROS production by heat stress affects directly mitochondrial function and also interfere normal growth of animals.
This study reported, for the first time, the high temperatures not only cause reduction in oxidative metabolic capacity, but also stimulate the ROS production in skeletal muscle mitochondria which leading reduction in mitochondrial activity of electron transport chain complexes, repression of their transcriptions with direct implications on pigs performance.
These findings will help to elucidate the physiological mechanism response of pigs to heat stress that still is partially understood.
Acknowledgment
53 Literature cited
Ando, M., K. Katagiri, S. Yamamoto, K. Wakamatsu, I. Kawahara, S. Asanuma, M. Usuda, and K. Sasaki. 1997. Age-related effects of heat stress on protective enzymes for peroxides and microsomal monooxygenase in rat liver. Environmental Healthy Perspectives. 105:726-733.
Andreyev, A. Y., Y. E. Kushnareva, A. A. Starkov. 2005. Mitochondrial metabolism of reactive oxygen species. Biochemistry (Moscow). 70:246-264.
Asayama, K., S. Yokota, K. Dobashi, H. Hayashibe, A. Kawaoi, and S. Nakazawa. 1994. Purification and immunoelectron microscopic localization of cellular glutathione peroxidase in rat hepatocytes: quantitative analysis by postembedding method. Histochemistry. 102:213-219.
Brand, M. D., C. Affourtit, T. C. Esteves, K. Green, A. J. Lambert, S. Miwa, J. L. Pakay, and N. Parker. 2004. Mitochondrial Superoxide: production, biological effects, and activation of uncoupling proteins. Free Radical Biology & Medicine. 37:755-767.
Barja, G. 1999. Mitochondrial oxygen radical generation and leak: sites of production I states 4 and 3, organ specificity, and relation to aging and longevity. Journal of Bioenergetics and Biomembranes. 31:347-366.
Bruskov, V. I., L. V. Malakhova, Z. K. Masalimov, and A.V. Chernikov. 2002. Heat-induced formation of reactive oxygen species and 8-oxoguanine, a biomarker of damage to DNA. Nucleic Acids Research. 30:1354-1363.
Cadenas, E., and K.J. Davies. 2000. Mitochondrial free radical generation, oxidative stress, and aging. Free Radical Biology & Medicine. 29:222-230.
Chance, B., H. Sies, and A. Boveris. 1979. Hydroperoxide metabolism in mammalian organs. Physiological Reviews. 59:527-605.
Chelikani, P., I. Fita, and P. C. Loewen.2004. Diversity of structures and properties among catalases. Cellular and Molecular life Science. 61:192-208.
Cheng W.H., Y-S. Ho, D. A. Ross, B. A. Valentine, G. F. Combs, X. G. Lei. 1997. Cellular glutathione peroxidase knockout mice express normal levels of selenium-dependent plasma and phospholipid hydroperoxide glutathione peroxidases in various tissues. Journal of Nutritional. 127:1445–50.