ACPD
10, 22131–22218, 2010Airborne observations of the Eyjafjalla volcano ash
U. Schumann et al.
Title Page
Abstract Introduction
Conclusions References
Tables Figures
◭ ◮
◭ ◮
Back Close
Full Screen / Esc
Printer-friendly Version Interactive Discussion
Discussion
P
a
per
|
Dis
cussion
P
a
per
|
Discussion
P
a
per
|
Discussio
n
P
a
per
|
Atmos. Chem. Phys. Discuss., 10, 22131–22218, 2010 www.atmos-chem-phys-discuss.net/10/22131/2010/ doi:10.5194/acpd-10-22131-2010
© Author(s) 2010. CC Attribution 3.0 License.
Atmospheric Chemistry and Physics Discussions
This discussion paper is/has been under review for the journal Atmospheric Chemistry and Physics (ACP). Please refer to the corresponding final paper in ACP if available.
Airborne observations of the Eyjafjalla
volcano ash cloud over Europe during air
space closure in April and May 2010
U. Schumann1, B. Weinzierl1, O. Reitebuch1, H. Schlager1, A. Minikin1, C. Forster1, R. Baumann1, T. Sailer1, K. Graf1, H. Mannstein1, C. Voigt1, S. Rahm1, R. Simmet1, M. Scheibe1, M. Lichtenstern1, P. Stock1, H. R ¨uba1, D. Sch ¨auble1, A. Tafferner1, M. Rautenhaus1, T. Gerz1, H. Ziereis1,
M. Krautstrunk2, C. Mallaun2, J.-F. Gayet3, K. Lieke4, K. Kandler4, M. Ebert4, S. Weinbruch4, A. Stohl5, J. Gasteiger6, H. Olafsson7, and K. Sturm8
1
Deutsches Zentrum f ¨ur Luft- und Raumfahrt (DLR), Institut f ¨ur Physik der Atmosph ¨are, Oberpfaffenhofen, Germany
2
DLR, Flugexperimente, Oberpfaffenhofen, Germany
3
Laboratoire de M ´et ´eorologie Physique UMR 6016/CNRS, Universit ´e Blaise Pascal, Clermont-Fd, France
4
Institut f ¨ur Angewandte Geowissenschaften, Technische Universit ¨at Darmstadt, Germany
5
Norwegian Institute for Air Research (NILU), Kjeller, Norway
6
ACPD
10, 22131–22218, 2010Airborne observations of the Eyjafjalla volcano ash
U. Schumann et al.
Title Page
Abstract Introduction
Conclusions References
Tables Figures
◭ ◮
◭ ◮
Back Close
Full Screen / Esc
Printer-friendly Version Interactive Discussion
Discussion
P
a
per
|
Dis
cussion
P
a
per
|
Discussion
P
a
per
|
Discussio
n
P
a
per
7
University of Iceland and Icelandic Meteorological Office, Reykjavik, Iceland, and University of Bergen, Norway
8
Deutscher Wetterdienst, Offenbach, Germany
Received: 25 August 2010 – Accepted: 14 September 2010 – Published: 27 September 2010
Correspondence to: U. Schumann (ulrich.schumann@dlr.de)
ACPD
10, 22131–22218, 2010Airborne observations of the Eyjafjalla volcano ash
U. Schumann et al.
Title Page
Abstract Introduction
Conclusions References
Tables Figures
◭ ◮
◭ ◮
Back Close
Full Screen / Esc
Printer-friendly Version Interactive Discussion
Discussion
P
a
per
|
Dis
cussion
P
a
per
|
Discussion
P
a
per
|
Discussio
n
P
a
per
|
Abstract
Airborne measurements of Lidar backscatter, aerosol concentrations (particle diam-eters of 4 nm to 50 µm), trace gas mixing ratios (SO2, CO, O3, H2O), single
parti-cle properties, and meteorological parameters have been performed in volcanic ash plumes with the Falcon aircraft operated by Deutsches Zentrum f ¨ur Luft- und Raumfahrt
5
(DLR). A series of 17 flights was performed over Europe between Southern Germany and Iceland during the eruption period of the Eyjafjalla1volcano between 19 April and 18 May 2010. Flight planning and measurement analyses were supported by a refined Meteosat ash product and trajectory model analysis. The volcanic ash plume was ob-served with Lidar directly over the volcano and up to a distance of 2700 km downwind.
10
Lidar and in-situ measurements covered plume ages of 7 h to 120 h. Aged ash layers were between a few 100 m to 3 km deep, occurred between 1 and 7 km altitude, and were typically 100 to 300 km wide. Particles collected by impactors had diameters up to 20 µm diameter, with size and age dependent composition. Ash mass concentration was evaluated for a material density of 2.6 g cm−3and for either weakly or moderately
15
absorbing coarse mode particles (refractive index 1.59+0i or 1.59+0.004i). In the absorbing case, the ash concentration is about a factor of four larger than in the non-absorbing limit. Because of sedimentation constraints, the smaller results are the more realistic ones for aged plumes. The Falcon flew in ash clouds up to about 1 mg m−3for a few minutes and in an ash cloud with more than 0.2 mg m−3mean-concentration for
20
about one hour without engine damages. In fresh plumes, the SO2 concentration was
correlated with the ash mass concentration. Typically, 0.5 mg m−3 ash concentration was related to about 100 nmol mol−1 SO2 mixing ratio and 70 nmol mol−1 CO mixing ratio increases for this volcano period. In aged plumes, layers with enhanced coarse mode particle concentration but without SO2 enhancements occurred. To first order,
25
ash concentration and SO2 mixing ratio in the plumes decreased by a factor of two
1
ACPD
10, 22131–22218, 2010Airborne observations of the Eyjafjalla volcano ash
U. Schumann et al.
Title Page
Abstract Introduction
Conclusions References
Tables Figures
◭ ◮
◭ ◮
Back Close
Full Screen / Esc
Printer-friendly Version Interactive Discussion
Discussion
P
a
per
|
Dis
cussion
P
a
per
|
Discussion
P
a
per
|
Discussio
n
P
a
per
within less than a day. The ash plumes were often visible as faint dark layers even for concentrations below 0.1 mg m−3. The ozone concentrations and the humidity inside the plumes were often reduced compared to ambient values. The large abundance of volatile Aitken mode particles suggests nucleation of sulfuric acid droplets. Ammonium sulfate particles were also found on the impactors. The effective diameters decreased
5
from about 5 µm in the fresh plume to about 1 µm for plume ages of up to 6 days. The distal ash mass flux on 2 May was of the order 1800 kg s−1; the SO2 mass flux was
about a factor of 3–4 smaller. The volcano ejected about 40 Tg of ash mass and 10 Tg of SO2 during the whole eruption period. The results of the Falcon flights were used
to support the responsible agencies in their decisions concerning air traffic in the
pres-10
ence of volcanic ash. The data described may be used for further studies, including comparisons to satellite and ground or space based Lidar observations, and for model improvements.
1 Introduction
Iceland’s Eyjafjallaj ¨okull (63.63◦N, 19.62◦W, 1666 m a.s.l.) erupted on 14 April 2010
15
ejecting a volcanic ash (VA) plume over 9 km a.s.l. into the atmosphere (IES: Institute of Earth Sciences, University of Iceland, http://www.earthice.hi.is). Though the erup-tion of the Eyjafjalla volcano rates among the mid-sized eruperup-tions (Mason et al., 2004; Mastin et al., 2009), it had strong impact on aviation over Europe. The eruption oc-curred in a weather situation with strong winds causing VA to drift within 1–2 days from
20
Iceland toward Central Europe where it resided for several days, as observed, e.g., with ground based Lidar (Ansmann et al., 2010; Flentje et al., 2010). Advisories of areas at risk from the volcano plume were issued by the responsible Volcanic Ash Ad-visory Center (VAAC) of UK Meteorological Office based on model predictions. Based on these advisories, European aviation authorities decided on air space closure. As
25
ACPD
10, 22131–22218, 2010Airborne observations of the Eyjafjalla volcano ash
U. Schumann et al.
Title Page
Abstract Introduction
Conclusions References
Tables Figures
◭ ◮
◭ ◮
Back Close
Full Screen / Esc
Printer-friendly Version Interactive Discussion
Discussion
P
a
per
|
Dis
cussion
P
a
per
|
Discussion
P
a
per
|
Discussio
n
P
a
per
|
million passenger journeys, in the time period 14 April to 20 April (as reported by EU-ROCONTROL). Further incursions of VA over Western Europe caused again airspace closures at various places and periods until 18 May 2010, leading to cancelling of about 7000 more flights.
Never before was such a large and busy air space impacted by a volcanic eruption.
5
So far, air space was closed whenever any notable trace of VA was expected in the air space without specifying an acceptable safety limit of ash loading (Casadevall, 1993). In desert vicinity regions, such as Saudia Arabia, annual mean dust mass levels of 0.2 mg m−3 are not uncommon (Sch ¨utz, 1980; Weinzierl et al., 2009). In comparison to desert dust, VA is considered more dangerous because of its lower melting
tem-10
perature (Casadevall, 1993). During the past 30 years, more than 120 airplanes have inadvertently flown through clouds of VA from erupting volcanoes (Webley and Mastin, 2009). In a few cases, serious engine or aircraft damages have been reported, af-ter a few minutes of flight time in volcanic plume with ash loading of possibly 2 g m−3 as estimated from engine damage analysis (Dunn and Wade, 1994; Przedpelski and
15
Casadevall, 1994). Shortly after the Eyjafjalla eruption, since 20 April 2010, aviation experts agreed preliminarily on new thresholds: 0.2 mg m−3 as the limit below which aircraft may fly without special attention, and 2 mg m−3as the limit above which flights should be avoided. At the end of this volcanic eruption (since 19 May), areas with low (<0.2 mg m−3), medium (0.2 to 2 mg m−3) and high (>4 mg m−3) contamination were
20
distinguished (ICAO, 2010) by the UK Meteorological Office.
A few airborne studies have been performed in distal plumes of eruptive volcanoes before, as reviewed in Watson and Oppenheimer (2001). The concentrations and fluxes of trace gases were measured in the Mt. St. Helens plume in 1980 (Bandy et al., 1982; Cronn and Nutmagul, 1982). The SO2 concentration reached 440 nmol mol
−1
,
25
CO was in the order of 200 nmol mol−1. Source rates of SO2of up to 10 and 140 kg s
−1
ACPD
10, 22131–22218, 2010Airborne observations of the Eyjafjalla volcano ash
U. Schumann et al.
Title Page
Abstract Introduction
Conclusions References
Tables Figures
◭ ◮
◭ ◮
Back Close
Full Screen / Esc
Printer-friendly Version Interactive Discussion
Discussion
P
a
per
|
Dis
cussion
P
a
per
|
Discussion
P
a
per
|
Discussio
n
P
a
per
Mexico, in November 1982 (Kotra et al., 1983; Arnold et al., 1990). Hydrogen sulfide was the primary gaseous sulfur species in that plume. Lidar and in-situ measurements were used to determine the cross-sectional area and the fluxes of particles and gases from the Mt. Redoubt Volcano in 1990 (Hobbs et al., 1991). The young stratospheric plume of the Mt. Pinatubo eruption in June 1991 was observed mainly by remote
sens-5
ing techniques, including airborne Lidar (Winker and Osborn, 1992; McCormick et al., 1995). The volcanic eruptions of the Mt. Okmok (53.4◦N, 168.1◦W; 12 July 2008) and Mt. Kasatochi (52.2◦N, 175.5◦W; 7 August 2008) injected about 1.7 Mt SO2into the at-mosphere. The eruption reached up to the stratosphere in 15.2 km altitude and resulted in a cancellation or delay of 44 aircraft flights. Increased SO2(and particulate sulfate)
10
concentrations up to 0.5 nmol mol−1was repeatedly detected in the lower stratosphere above Europe up to 4 months after eruption (Martinsson et al., 2009; Heue et al., 2010; Jurkat et al., 2010; Schmale et al., 2010; Voigt et al., 2010). In February 2000, a 33– 34 h aged volcanic cloud from Hekla volcano, Iceland, was incidentally encountered by the DC-8 research aircraft during a larger atmospheric observation experiment (Hunton
15
et al., 2005; Rose et al., 2006). During this flight, the DC-8 sampled various gaseous (including SO2, HCl and HF) and particulate properties at 10.4 km altitude, for about 12 min inside a cirrus cloud. The SO2 concentration exceeded 1 µmol mol−1. Engine damages diagnosed for this case (perhaps for other reasons) were later interpreted indicating that flying in even minor VA plume remnants may cause major damage to
20
the aircraft (Grindle and Burcham Jr., 2002, 2003; Pieri et al., 2002).
The size spectra of ash particles available in the literature were mostly derived from tephra deposited at ground (Rose and Durant, 2009; Webley and Mastin, 2009). Sam-ples taken at ground near the Eyjafjallaj ¨okull indicate particle sizes up to 300 µm, with more than 50% mass in particles larger than about 50–150 µm, varying during the
25
ACPD
10, 22131–22218, 2010Airborne observations of the Eyjafjalla volcano ash
U. Schumann et al.
Title Page
Abstract Introduction
Conclusions References
Tables Figures
◭ ◮
◭ ◮
Back Close
Full Screen / Esc
Printer-friendly Version Interactive Discussion
Discussion
P
a
per
|
Dis
cussion
P
a
per
|
Discussion
P
a
per
|
Discussio
n
P
a
per
|
Only a few airborne measurements of the ash size spectrum and total mass con-centrations have been taken inside VA plumes (Hobbs et al., 1982). Particle counters inside the fuselage measure only small particles (<2 µm) because of strong losses at the inlets (Hunton et al., 2005). Larger particles can be measured by particle coun-ters mounted outside the fuselage, but care is needed to separate ash particles from
5
cloud particles. For example, the particle size distribution measured in the Hekla ash plume is dominated by cirrus ice crystals (Rose et al., 2006). The mass concentration of ash particles, which is essential for this study, cannot be directly measured. The volume concentration can be derived from particle number size distributions derived from optical laser aerosol spectrometer measurements (Weinzierl et al., 2009). Such
10
spectrometers count the particles and measure the amount of light scattered by single particles into the collection optics of the particular instruments. The particle size must be analyzed from the measured amount of light, which requires knowledge of the light scattering for the given geometry. The scattering is a function of complex refractive in-dex and shape of the particles (Mishchenko and Travis, 1994; Borrmann et al., 2000).
15
The optical properties of VA particles (and their material density) are not well known but can be estimated once the composition of the particles is known (Patterson et al., 1983; Kandler et al., 2009).
The predictions of ash plumes by the UK VAAC are based on a Lagrangian model (Jones et al., 2007), which computes the trajectories of ash particles as a function
20
of ambient winds. The results of this and similar models depend crucially on the volcanological input data, such as plume height, mass eruption rate, eruption dura-tion, ash distribution with altitude, and particle-size distribution. These inputs must be assigned in real time during an event, often with limited observations (Webley and Mastin, 2009). Moreover, the results depend strongly on the meteorological fields used
25
ACPD
10, 22131–22218, 2010Airborne observations of the Eyjafjalla volcano ash
U. Schumann et al.
Title Page
Abstract Introduction
Conclusions References
Tables Figures
◭ ◮
◭ ◮
Back Close
Full Screen / Esc
Printer-friendly Version Interactive Discussion
Discussion
P
a
per
|
Dis
cussion
P
a
per
|
Discussion
P
a
per
|
Discussio
n
P
a
per
Besides the obvious operational implications, the impact of VA and gaseous emis-sions on the atmosphere is of high scientific interest. Volcanic emisemis-sions may con-tribute to changes of air composition and cloudiness. Much can be learned about atmospheric chemistry and cirrus formation (Hunton et al., 2005; Rose et al., 2006; Durant et al., 2008) from well-instrumented flights in VA layers. We were in particular
5
interested in understanding the plume dispersion, the ash particle properties, and the chemical plume composition. The data are of interest also for validation of Lidar and satellite based aerosol and sulfur dioxide (SO2) observations.
Between 19 April and 18 May 2010, we performed measurements in VA plumes with the research aircraft Falcon of the Deutsches Zentrum f ¨ur Luft- und Raumfahrt (DLR).
10
The measurements were supported by satellite data analysis, VA model predictions, and weather forecasts. The principal motivation of these measurement flights was to provide as quickly as possible airborne measurements of VA plume properties over Central Europe. The data should provide information useful to assess the VA load predictions, which were used in the decisions on air space closure over Central Europe.
15
This paper describes the Falcon measurements, summarizes the data obtained and presents some early analyses and experiences. It should serve as a basis for more detailed analyses and upcoming studies.
2 Experimental methods
2.1 Falcon measurement system
20
The Falcon 20E, a twin-engine jet aircraft, see Fig. 1, was built by Dassault in 1975. The turbofan jet engines of type Honeywell TFE 731-5BR-2C (2×21 kN thrust) were re-newed in 1995. The aircraft ceiling is 12.8 km, cruise speed near 200 m s−1, endurance about 4.5 h, with about 3100 km range. The aircraft has been used in recent years for many atmospheric research projects (Schlager et al., 1997; Schumann et al., 2002;
25
ACPD
10, 22131–22218, 2010Airborne observations of the Eyjafjalla volcano ash
U. Schumann et al.
Title Page
Abstract Introduction
Conclusions References
Tables Figures
◭ ◮
◭ ◮
Back Close
Full Screen / Esc
Printer-friendly Version Interactive Discussion
Discussion
P
a
per
|
Dis
cussion
P
a
per
|
Discussion
P
a
per
|
Discussio
n
P
a
per
|
Voigt et al., 2010). In particular, the Falcon has been measuring in desert dust regions at dust loads of up to 5 mg m−3, without notable damage to the engines (Weinzierl et al., 2009).
For the VA flights, the aircraft had been instrumented within a few days after the volcanic eruption onset with instruments that were available quickly from previous
ex-5
periments, see Table 1. The instruments include a Lidar, in-situ instruments for aerosol microphysics, chemical species, and meteorological parameters like temperature, hu-midity and wind. Furthermore, aircraft parameters (position, aircraft speed etc.) were recorded. The 2D-C and the particle impactor instruments, see Table 1, were provided by the Laboratoire de M ´et ´eorologie Physique, Clermont-Ferrand and by the
Techni-10
cal University Darmstadt, respectively. All other instruments were provided by DLR. For possible early detection of engine damages, the pilots controlled temperature and pressure indicators for normal engine operations during flight. Satellite (Iridium) tele-phone connections were available and important for real-time communication of the results from the observers on board to the decision-making agencies.
15
2.1.1 Lidar
The 2-µm Doppler wind Lidar (Light detection and ranging) was deployed on the Falcon aircraft in a downward looking direction performing conical scans for the retrieval of ver-tical profiles of the horizontal wind vector and attenuated aerosol backscatter. The co-herent, heterodyne-detection Lidar is based on a transceiver unit from Lockheed Martin
20
Coherent Technologies. The laser is transmitting pulses with a wavelength of 2.02 µm, length of 400 ns, energy of 1–2 mJ, and a repetition rate of 500 Hz (K ¨opp et al., 2004). Measurements are obtained from an altitude of 400 m below the aircraft to the ground with a vertical resolution of 100 m. The wind vector is derived by a velocity-azimuth-display technique from 20 line-of-sight (LOS) directions during one conical scan with
25
num-ACPD
10, 22131–22218, 2010Airborne observations of the Eyjafjalla volcano ash
U. Schumann et al.
Title Page
Abstract Introduction
Conclusions References
Tables Figures
◭ ◮
◭ ◮
Back Close
Full Screen / Esc
Printer-friendly Version Interactive Discussion
Discussion
P
a
per
|
Dis
cussion
P
a
per
|
Discussion
P
a
per
|
Discussio
n
P
a
per
ber of 500 laser pulse-returns during 1 s for each LOS and applying a correction for rangeR with a factor ofR2. Thus, the signal profiles are obtained with a horizontal res-olution of 150–200 m for typical aircraft speeds. The range-corrected signal depends on the vertical profile of the atmospheric backscatter and extinction coefficient, which are both depending on the particle (aerosol, cloud, ash) content of the atmosphere,
5
their size distributions and scattering properties. The 2-µm laser wavelength is higher than the typical wavelengths of up to 1.064 µm for ceilometers (Flentje et al., 2010) or aerosol Lidars (Ansmann et al., 2010), which were used to observe the VA plumes from the ground. Thus, the 2-µm Lidar observations complement those ground observations for a wavelength, which is comparable to the size of the VA particles. The heterodyne
10
detection method is more sensitive to lower aerosol contents in the atmosphere com-pared to a direct-detection aerosol Lidar, because the heterodyne signal is analyzed in a much lower frequency bandwidth, making it insensitive to the solar background. On the other hand, the volume backscatter and extinction coefficient cannot be derived di-rectly from the heterodyne signal, as it is performed for aerosol Lidars (Ansmann et al.,
15
2010). Nevertheless, the real-time display of the signal-to-noise ratio was used during flights to detect the presence of VA layers, their vertical and horizontal extent and their relative signal strength compared to water or ice clouds. Thus, the Lidar observations were essential as a pathfinder for subsequent in-situ observations.
In the post-flight analysis, the lower and upper boundary of the measured VA layers
20
was determined from the range-corrected attenuated backscatter signal of the Lidar by visual inspection. Layers were assigned where they were clearly separated ver-tically from the atmospheric aerosol boundary layer, showed signal levels lower than from water clouds but higher than typically observed in the free troposphere, and are characterized by a strong signal gradient. As the VA layers showed high signal levels
25
ACPD
10, 22131–22218, 2010Airborne observations of the Eyjafjalla volcano ash
U. Schumann et al.
Title Page
Abstract Introduction
Conclusions References
Tables Figures
◭ ◮
◭ ◮
Back Close
Full Screen / Esc
Printer-friendly Version Interactive Discussion
Discussion
P
a
per
|
Dis
cussion
P
a
per
|
Discussion
P
a
per
|
Discussio
n
P
a
per
|
2.1.2 In-situ aerosol instruments
The in-situ aerosol instrumentation covered the whole particle size spectrum including particles in the nucleation mode (4–10 nm), Aitken mode (10–160 nm), accumulation mode (160 nm–1 µm), coarse mode (1–50 µm) and particles in the far super-micron diameter range (up to 800 µm). The super-160 nm particle fraction was sized by
5
a combination of optical particle counters: Optical Particle Counter (OPC), Passive Cavity Aerosol Spectrometer Probe (PCASP), and Forward Scattering Spectrometer Probe (FSSP) of type Grimm SKY-OPC 1.129, PMS PCASP-100X, and PMS FSSP-300 (Weinzierl et al., 2009), see Table 1. The measurement principle of these instru-ments is the sizing of particles based on the detection of the amount of light scattered
10
by single particles. The instruments convert the scattering signal into an electrical sig-nal, which corresponds to size information and is resolved into an array of channels which is fixed in case of the three aerosol spectrometers used in this study. The instru-ments differ mainly in optical geometry and electronic signal processing, and, as a re-sult, cover different particle size ranges. According to the manufacturers, the PCASP
15
covers nominally the size range 0.12–3.5 µm (15 channels), the OPC 0.25–32 µm (31 channels) and the FSSP 0.3–20 µm (31 channels). During the Falcon flights discussed in this study, we found the FSSP to show false counts due to electronic noise in some lower channels as well as in the two highest channels, and these channels were disre-garded in the data analysis, therefore. For the PCASP the two lowest channels were
20
disregarded, raising the lower end of the PCASP size range to approx. 0.16 µm. Below this size, the total number of particles larger than 4 nm and larger than 10 nm is known from CPC measurements which were operated at different cut-offdiameters (Schr ¨oder and Str ¨om, 1997). In addition to the total size distribution, the size distribution of the non-volatile aerosol compounds was also measured. For this purpose, a second optical
25
com-ACPD
10, 22131–22218, 2010Airborne observations of the Eyjafjalla volcano ash
U. Schumann et al.
Title Page
Abstract Introduction
Conclusions References
Tables Figures
◭ ◮
◭ ◮
Back Close
Full Screen / Esc
Printer-friendly Version Interactive Discussion
Discussion
P
a
per
|
Dis
cussion
P
a
per
|
Discussion
P
a
per
|
Discussio
n
P
a
per
ponents of sulfuric acid-like and ammonium sulfate-like behavior from non-volatile or refractory components like crustal material in VA layers (Clarke, 1991). The size range from about 25 to 800 µm, depending on airspeed, was covered by the 2D-C probe (Law-son et al., 2006; Gayet et al., 2009). The 2D-C instrument records the two-dimensional shadows of particles as they pass through a focused laser beam and provides
informa-5
tion about particle shape and size from the analysis of the recorded shadow. Beyond particle sizing, the instrumentation was designed to provide information on the aerosol absorption coefficient at the wavelengths of 467, 530 and 660 nm with a 3-λ Particle Soot Absorption Photometer (PSAP) (Virkkula, 2010). These absorption data can be used to determine the complex refractive index of aerosols (Petzold et al., 2009). Three
10
impactor-sampling devices were mounted inside the aircraft to collect VA particles for off-line single particle analysis (Ebert et al., 2002; Kandler et al., 2009). The PCASP, FSSP, 2D-C, and a Giant Particle Collector (GPaC) were mounted under the wings of the aircraft. All other instruments were operated in the cabin, sampling air from the Falcon aerosol inlet, which is sampling in forward direction close to isokinetic sampling
15
conditions. For large particles, the sampling efficiency of this inlet falls offrigorously. The cut-offdiameter, at which 50% of the particles pass the isokinetic inlet, depends on outside pressure and air speed. For typical Falcon speed, the cut-offis near 2.5 µm at ground level and decreases to about 1.5 µm at 10 km altitude (Fiebig, 2001; Wendisch et al., 2004).
20
2.1.3 Method for derivation of the ash mass concentration
The mass concentration of ash particles is derived from particle number size distribu-tions measured by the three optical laser aerosol spectrometers, PCASP, OPC, FSSP, specified above (Table 1). The amount of light scattered by a single particle into the in-strument’s collection optics depends on particle size, the complex refractive index and
25
the shape of the particle.
ACPD
10, 22131–22218, 2010Airborne observations of the Eyjafjalla volcano ash
U. Schumann et al.
Title Page
Abstract Introduction
Conclusions References
Tables Figures
◭ ◮
◭ ◮
Back Close
Full Screen / Esc
Printer-friendly Version Interactive Discussion
Discussion
P
a
per
|
Dis
cussion
P
a
per
|
Discussion
P
a
per
|
Discussio
n
P
a
per
|
For visible wavelengths, the real part of the refractive index varies between 1.5 and 1.6 for silicate glasses similar to volcanic ashes (Patterson, 1981) and between 1.48 and 1.57 for naturally occurring rocks (obsidian, basaltic glass and andesite) (Pollack et al., 1973). While the size distributions for small particles (OPC, PCASP) are rather insen-sitive to the variation of the imaginary part of the refractive index, this is not the case
5
for the FSSP instrument (Weinzierl et al., 2009) because it is much more selective for forward scattering angles only. With increasing particle absorption, the size distribu-tion of the FSSP in general shifts towards larger particle sizes. The imaginary part of the refractive index of volcanic ash varies widely. Values between 0.00027 and 0.0015 have been reported for naturally occurring rocks (Pollack et al., 1973). Patterson et al.
10
(1983) investigated ash samples of the 1982 El Chich ´on eruption collected at three surface sites at distances between 12 and 80 km from the volcano. The imaginary part of the refractive index at 632 nm (the laser wavelength of the PCASP and FSSP) decreased from about 0.0015 for the sample collected at a distance of 12 km to the vent to 0.0008 for an 80 km distance sample. Clarke et al. (1983) obtained a value of
15
0.0034 at 550 nm for the imaginary part of the El Chichon ash. Patterson (1981) found an imaginary part of the refractive index for Fuego ash of 0.02 at 650 nm. In this study, the refractive index value is derived from the composition of particles collected by the impactors.
In the analysis of the particle size distributions of the optical aerosol
spectrome-20
ter probes, we use Mie calculations assuming spherical particles. The channels are grouped into larger size bins to account for ambiguities in the Mie scattering cross sec-tion as a funcsec-tion of particle size, to improve counting statistics in particular for high channel numbers, and to smooth the resulting size spectra. To estimate the impact of particle non-sphericity of ash particles (Munoz et al., 2004) we assessed the
instru-25
ACPD
10, 22131–22218, 2010Airborne observations of the Eyjafjalla volcano ash
U. Schumann et al.
Title Page
Abstract Introduction
Conclusions References
Tables Figures
◭ ◮
◭ ◮
Back Close
Full Screen / Esc
Printer-friendly Version Interactive Discussion
Discussion
P
a
per
|
Dis
cussion
P
a
per
|
Discussion
P
a
per
|
Discussio
n
P
a
per
The mass distribution follows from the volume distribution after multiplication with the particle densityρP. The density of ash particles including rock fragments varies from
0.7 to 3.2 g cm−3. (http://volcanoes.usgs.gov/ash/properties.html#density). Here, the densityρPis estimated based on the impactor samples of 2 May 2010, see below. We
assumedρP=2.6 g cm−3to hold for all VA layers investigated in this study.
5
2.1.4 Trace gas instruments
The trace gases ozone (O3), carbon monoxide (CO), and sulfur dioxide (SO2), and
wa-ter vapor (H2O) were measured with in-situ instruments inside the cabin. The individual
instruments in the fuselage sampled air through rearward facing inlets mounted on top of the Falcon. Teflon (PFA) was used for the inlet tubes of the SO2and O3instruments
10
to avoid wall losses. The inlet tubing of the CO instrument was stainless steal.
Sulfur dioxide was measured using pulsed fluorescence (Luke, 1997). The instru-ment deployed was a Thermo Electron SO2Analyzer (Model 43C Trace Level). In the optical cell of the instrument, SO2 is electronically excited by radiation in the
wave-length range 190–230 nm generated by a Xenon flash lamp pulsed at 10 Hz. Excited
15
SO2∗is partly quenched and photolyzed, and partly fluoresces at 320 nm. This radia-tion is detected by a photomultiplier tube. The photomultiplier sampling gate is delayed by 30 µs from the trigger of the flash lamp to reduce electronic noise associated with the flash. The fluorescence intensity is linearly proportional to the SO2 mixing ratio. The fluorescence technique is subject to a weak positive interference from aromatic
20
hydrocarbons, CS2 and NO. Hydrocarbons are removed from the sample air in the
instrument by diffusion through a semi-permeable membrane (hydrocarbon kicker). Rejection ratios (ratio of the concentration of interferant to SO2 required to produce
an equivalent instrument signal) for CS2 and NO were determined in laboratory
ex-periments to 20 (Luke, 1997) and 35 (Roiger, 2007), respectively. Interferences from
25
CS2 and NO are considered to be negligible for the present measurements in view of
Nut-ACPD
10, 22131–22218, 2010Airborne observations of the Eyjafjalla volcano ash
U. Schumann et al.
Title Page
Abstract Introduction
Conclusions References
Tables Figures
◭ ◮
◭ ◮
Back Close
Full Screen / Esc
Printer-friendly Version Interactive Discussion
Discussion
P
a
per
|
Dis
cussion
P
a
per
|
Discussion
P
a
per
|
Discussio
n
P
a
per
|
magul, 1982) and 0.001 (Rose et al., 2006) in volcanic plumes. The detection limit of the SO2 monitor is 0.2 nmol mol−1. The precision and accuracy are 3% and 5%, respectively. The response time of the instrument is 80 s (t95%).
Ozone was measured with a Thermo Environment ultra-violet (UV) photometric ozone analyzer (Model 49C). The instrument employs a mercury lamp to produce UV
5
light at a wavelength of 254 nm. The degree of absorption of the UV light is linearly proportional to the ozone concentration in the optical cell. The sample air drawn into the instrument is passed to two optical cells, one equipped with an ozone scrubber to serve as a reference gas. The flow to the reference and measurement cell is alternated every 4 s using solenoid valves. The light intensity of each cell is measured by separate
10
detectors. A particle filter (Teflon, 5 micro pore) is installed upstream of the optical cells to avoid scattering or absorption of UV light by particles. A weak interference of the UV absorption technique with SO2 (rejection ratio of 70) was considered during data
reduction. The detection limit and response time of the instrument is 1 nmol mol−1and 15 s with a 10 s lag time. Precision and accuracy are 3%/1 nmol mol−1 (whichever is
15
larger) and 5%, respectively.
Carbon monoxide was measured using a fast-response (<2 s) vacuum UV reso-nance fluorescence detector (Model AEROLASER AL 5001). UV light at a wavelength of 150 nm is mirrored by an optical filter into a fluorescence cell. The light is produced by a resonance lamp excited by a radio frequency discharge. The fluorescence is
de-20
tected by a photomultiplier tube. The detection limit of the instrument is 3 nmol mol−1. Precision and accuracy are 3% and 5%, respectively (Gerbig et al., 1999).
Water vapor was measured with two independent instruments: a Lyman-α absorp-tion water vapor instrument operated by the DLR flight department and a dew point hygrometer (Voigt et al., 2010). The Lyman-α instrument has an accuracy of 5% for
25
ACPD
10, 22131–22218, 2010Airborne observations of the Eyjafjalla volcano ash
U. Schumann et al.
Title Page
Abstract Introduction
Conclusions References
Tables Figures
◭ ◮
◭ ◮
Back Close
Full Screen / Esc
Printer-friendly Version Interactive Discussion
Discussion
P
a
per
|
Dis
cussion
P
a
per
|
Discussion
P
a
per
|
Discussio
n
P
a
per
hygrometer is better than 1 µmol mol−1 for a time resolution of 2 s. The uncertainty in the water vapor mixing ratio is mainly determined by the uncertainty in the temperature measurement and amounts to±8%. This uncertainty does not include oscillations of the mirror temperature induced by the control circuit after steep gradients in humidity, which have to be removed from the data set. Hence, depending on water vapor
gradi-5
ents the response time of the frost point hygrometer is in the order of one minute to few seconds. The ambient air temperature was measured with an accuracy of 0.3 K with a PT100 sensor with a Rosemount inlet.
2.2 Modeling methods
For flight planning (see below) and for analysis of the plume age and source altitude
10
and the source strength at time of emission at the volcano, we use the FLEXPART model (at Norwegian Institute for Air Research (NILU) and DLR) and the HYSPLIT model (at DLR) in backward or forward mode driven with different meteorological re-analysis data. The use of different models, different atmospheric datasets and different methodologies serves to provide a first guess of the robustness of the corresponding
15
results.
The FLEXPART model (Stohl et al., 2005) driven with ECMWF reanalyzed data with 0.5◦×0.5◦ horizontal resolution is used for age analysis from backward trajectories of virtual particles released at the points of measurements along the flight paths. The backward transport method accounts for turbulence and convection and has been
val-20
idated by comparison to other methods (Seibert and Frank, 2004). For each grid cell along the flight tracks, 10 000 particles are released. The particles are classified as passing over the volcano when approaching the volcano within 50 km distance. For those particles, the information of altitude, time, release point, release time and resi-dence time over the volcano were kept. Some particles passed over the volcano
sev-25
ACPD
10, 22131–22218, 2010Airborne observations of the Eyjafjalla volcano ash
U. Schumann et al.
Title Page
Abstract Introduction
Conclusions References
Tables Figures
◭ ◮
◭ ◮
Back Close
Full Screen / Esc
Printer-friendly Version Interactive Discussion
Discussion
P
a
per
|
Dis
cussion
P
a
per
|
Discussion
P
a
per
|
Discussio
n
P
a
per
|
Alternatively, the ash-plume age was computed using the National Oceanic and At-mospheric Administration (NOAA) Air Resources Laboratory (ARL) HYSPLIT model (Draxler and Hess, 1998; Draxler, 2003). The model was driven with reanalyzed atmospheric data from the Global Forecast System/Global Data Analysis System (GFS/GDAS) model. The calculations were performed using GFS data with 0.5◦×0.5◦
5
or 1◦×1◦ horizontal resolution. The physics in HYSPLIT was parameterized using the recommended standard settings. For the forward simulations, the Eyjafjalla ash emis-sion was modeled using a vertical line source located at the volcano with varying mass flow rate and vertical extent. The top height ht of the source was taken from the
6-hourly updated graphics issued by the VAAC (files on http://www.metoffice.gov.uk/
10
aviation/vaac/vaacuk vag.html). The bottom end of the line source was estimated to be 0.5∗(ht,min−hS), were hS is the volcano height and ht,min the minimum top-height
reported for the 6-h period. The mass flow rate is computed from
˙
m=m˙ref
h
t−hS ht,ref−hS
1/a
(1)
using a=0.25, which is between the values 0.241 and 0.259 given in Mastin et al.
15
(2009) and Sparks et al. (1997), respectively. The reference mass flow rate ˙mref was
adjusted such that the total ash mass ejected during the first 72 h of the volcano erup-tion equals the total airborne tephra mass, mt times the fraction of fine-grained ash
below 63 µm, m63 (grain size Φ=4). For mt an average value of 5×10 5
kg s−1 dur-ing the first three days was used accorddur-ing to the preliminary estimates published by
20
the IES (http://www.earthice.hi.is/page/ies Eyjafjallajkull eruption, estimates an aver-age discharge rate of 7.5×10⁵kg s−1with±50% uncertainty, about two-thirds of which have gone airborne). A lower bound of the fine ash fraction m63 was estimated to
be ≥3% from an ash sample taken 2 km west of the active vent on 28 April (Bj ¨orn Oddsson, IES, http://www.earthice.hi.is/page/ies EYJO2010 Grain). The true fine-ash
25
ACPD
10, 22131–22218, 2010Airborne observations of the Eyjafjalla volcano ash
U. Schumann et al.
Title Page
Abstract Introduction
Conclusions References
Tables Figures
◭ ◮
◭ ◮
Back Close
Full Screen / Esc
Printer-friendly Version Interactive Discussion
Discussion
P
a
per
|
Dis
cussion
P
a
per
|
Discussion
P
a
per
|
Discussio
n
P
a
per
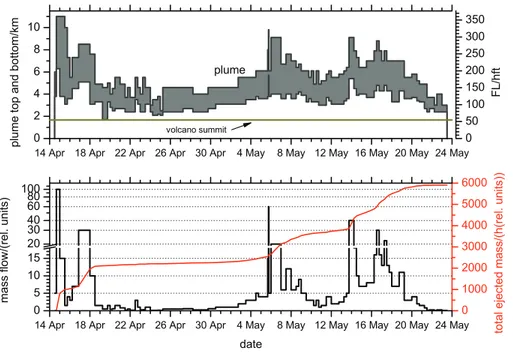
particle’s frequency. The total “fine” ash mass was distributed equally on six represen-tative ash particle size classes with diameters of 2, 6, 15, 25, 40 and 60 µm, which are handled in HYSPLIT as different pollutant species in order to account for the different sedimentation velocity of the particles. Figure 2 shows the time-series of the source characteristics as used in this study. For a given point of measurements, an ensemble
5
of backward trajectories was computed, to obtain a first estimate of the plume age and source altitude at the time of eruption. The results were checked and corrected based on forward trajectories. The source strength was then taken from the lower panel of Fig. 2. From the same figure, the integrated mass flow during the April/May eruption is about 3 times the amount released in the days 14–18 April. This ratio and preliminary
10
data by IES on the amount of tephra released during 14–18 April imply a total distal ash load of about 10 Tg to some 100 Tg during the whole eruption period.
2.3 Volcano plume identification from Meteosat SEVIRI data
In order to monitor the VA plume, the so-called dust image is a standard product used for visualization. This dust image is a red-green-blue (RGB) composite based on the
15
brightness temperature differences between the 12 µm and 10.8 µm channel in red, the 10.8 µm and the 8.7 µm channel in green and the brightness temperature of the 10.8 µm channel in blue. This image allows not only identifying and tracking the ash cloud independent from daylight, but also indicates those regions, where the ash might be hidden due to ice on the dust particles or by clouds above. The time series of
20
these images available every 15 min allows a very good judgment of the position (but not of altitude and density) of the ash cloud if correctly interpreted. However, such an interpretation is not possible from single images without further information, since the image sometimes exhibits weak contrast between ash and water clouds (see Sect. 3.4, Fig. 15 below). Therefore, we have developed a variant of this method for ash detection
25
ACPD
10, 22131–22218, 2010Airborne observations of the Eyjafjalla volcano ash
U. Schumann et al.
Title Page
Abstract Introduction
Conclusions References
Tables Figures
◭ ◮
◭ ◮
Back Close
Full Screen / Esc
Printer-friendly Version Interactive Discussion
Discussion
P
a
per
|
Dis
cussion
P
a
per
|
Discussion
P
a
per
|
Discussio
n
P
a
per
|
so-called reverse absorption effect (Prata and Grant, 2001; Prata, 2009). Usually the BT(10 µm)–BT(12 µm) is<0 K for ash particles and>0 for clouds, but atmospheric hu-midity, surface properties and the satellite viewing angle modify this threshold. For a refined ash product, the threshold was tuned to −1.0 K by visual judgment to pro-vide a fair balance between a low false alarm rate and high detection efficiency. In
5
a further step, the data was low-pass filtered in order to reduce the pixel noise inherent in the temperature difference data. As background we have chosen the BT(10.8 µm) grayscale image for better assessment of cloudiness in the meteorological situation. It has to be kept in mind, that the intensity of the ash product is not linearly related to ash concentration.
10
2.4 Flight planning
Flight planning at DLR was based on numerical weather forecasts, trajectory-based particle-dispersion models, satellite observations and ground based Lidar observations from many sources. The Falcon was operated as a “state aircraft” allowing for opera-tions in otherwise closed air space. If necessary, the Falcon pilots were able to change
15
the flight plan in-flight in direct contact with air traffic control.
In order to estimate the current and future spatial and temporal distribution of VA layers, the flight planning team relied on satellite products from Meteosat SEVIRI. In addition we used model predictions from various sources, including VAAC (http: //www.metoffice.gov.uk/aviation/vaac/vaacuk vag.html), the Lagrangian particle
disper-20
sion model FLEXPART (Stohl et al., 2005) of NILU (http://transport.nilu.no/browser/fpi), and calculations with the same model at DLR. Other VA forecasts like those from the EURAD model of the Rheinisches Institut f ¨ur Umweltforschung, University of Cologne (http://db.eurad.uni-koeln.de/), from the COSMO-ART model of the Deutscher Wet-terdienst (DWD, German Weather Service) and FLEXPART results from the Austrian
25
ACPD
10, 22131–22218, 2010Airborne observations of the Eyjafjalla volcano ash
U. Schumann et al.
Title Page
Abstract Introduction
Conclusions References
Tables Figures
◭ ◮
◭ ◮
Back Close
Full Screen / Esc
Printer-friendly Version Interactive Discussion
Discussion
P
a
per
|
Dis
cussion
P
a
per
|
Discussion
P
a
per
|
Discussio
n
P
a
per
Hence, the model results were mainly interpreted qualitatively to identify regions with high or low ash concentration. Later ground-based and in-situ observations allowed a better estimate of the source strength, and the model predictions provided increas-ingly reliable quantitative predictions of the VA mass concentration distribution.
A critical part of the flight planning process was the forecast of the expected (water)
5
cloud cover to decide on whether the predicted ash plumes were embedded in clouds. The objective was to avoid measurements in VA plumes inside clouds, as Lidar sig-nals are strongly attenuated in water clouds and the optical particle counters cannot easily distinguish between ash particles and water droplets. For this purpose, both VA prediction and weather prediction data were inspected simultaneously. Weather
pre-10
diction was based on deterministic meteorological forecasts from the European Centre for Medium Range Weather Forecasts (ECMWF) and on COSMO-EU and COSMO-DE forecasts of DWD. For forecasting, we strongly built on experience gained in previous campaigns. For instance, refined versions of software used during a recent campaign (Voigt et al., 2010) were employed. For long distance flights, airports had to be selected
15
for refueling which with high probability were free of VA impact.
When possible, the flight path of the Falcon was directed to pass over several ground-based Lidars: Munich-Maisach (48.21◦N, 11.26◦E, operated by the Meteorological In-stitute of the Ludwig-Maximilians University, MIM-LMU), Leipzig (51.35◦N, 12.44◦E; Institute of Tropospheric Research, IfT), Cabauw and Bilthoven, Netherlands (52◦N,
20
5◦E, Royal Netherlands Meteorological Institute, KNMI, and National Institute for Pub-lic Health and the Environment, RIVM), and Stuttgart (48.71◦N, 9.21◦E, Institute of Physics and Meteorology of the University Hohenheim).
After landing and cooling of the engines (minimum 2 h duration), the Falcon engines were inspected for ash deposit or damage visually and by using boroscopy (endoscopy
25
ACPD
10, 22131–22218, 2010Airborne observations of the Eyjafjalla volcano ash
U. Schumann et al.
Title Page
Abstract Introduction
Conclusions References
Tables Figures
◭ ◮
◭ ◮
Back Close
Full Screen / Esc
Printer-friendly Version Interactive Discussion
Discussion
P
a
per
|
Dis
cussion
P
a
per
|
Discussion
P
a
per
|
Discussio
n
P
a
per
|
replacement in July 2003. This needed to be repaired before the Falcon was ready to fly again. Inspection showed that the nozzle damages were not caused by the VA. The repair was performed within 3 days.
3 Results
3.1 Overview
5
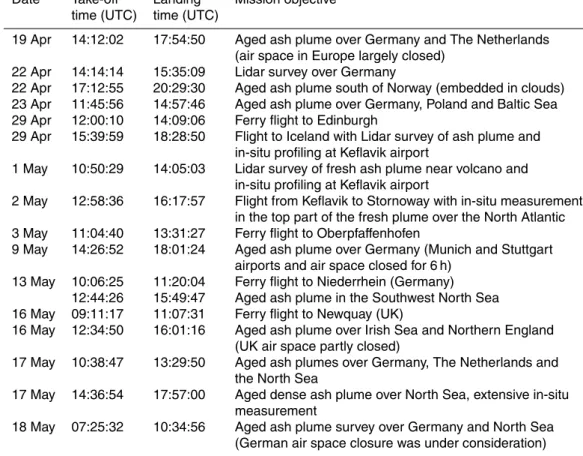
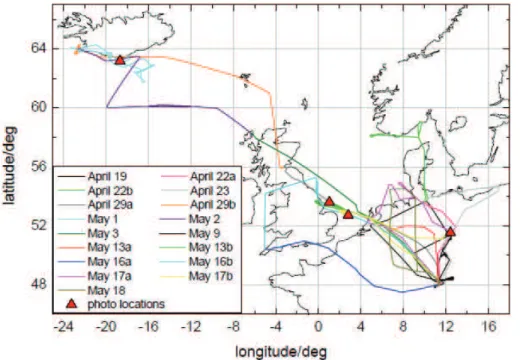
In this section, we describe the observation results for eight missions, partly compris-ing several flights. Table 2 lists information on the 17 flights performed by the DLR Falcon research aircraft to survey and sample the emissions of the Eyjafjalla volcano on Iceland. The table includes takeoff/landing times and a short mission objective. A compilation of the flight tracks is shown in Fig. 3. Data from the instruments listed
10
in Table 1 are available for all flights with following exceptions: Impactor sampling and SO2 detector were not flown on the first flight. The GPaC instrument sampled large particles successfully only on 2 May 2010. The dew point hygrometer was only flown on 8 flights between 22 April and 3 May 2010. The 2D-C probe was added for all flights from 29 April onward.
15
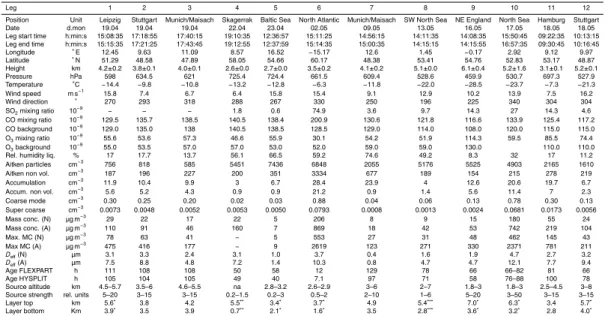
From all flights, 35 flight legs were identified, when the Falcon was inside a VA plume. Table 3 lists 12 representative examples. These legs were selected based on increases in the particle concentration of coarse mode particles and SO2mixing ratio significantly
above background. The Lidar signal was used to check whether a homogeneous ash layer was detectable. Moreover, the legs were checked for consistency of the
com-20
puted backward trajectories with an ash source form the Eyjafjalla eruption. In fact, we excluded observations of aerosol traces measured over Leipzig at about 14:00 UTC 23 April, which may possibly result from other dust sources such the Taklimakan Desert in China (a possibility pointed out to us by Mike Fromm, personal communication). Most legs extend over about minutes to some tens of minutes. The variability of aerosol
25
ACPD
10, 22131–22218, 2010Airborne observations of the Eyjafjalla volcano ash
U. Schumann et al.
Title Page
Abstract Introduction
Conclusions References
Tables Figures
◭ ◮
◭ ◮
Back Close
Full Screen / Esc
Printer-friendly Version Interactive Discussion
Discussion
P
a
per
|
Dis
cussion
P
a
per
|
Discussion
P
a
per
|
Discussio
n
P
a
per
deviation of the average). In all cases, the Falcon altitude information is derived from Global Positioning System (GPS) data. The results for 17 May, listed in Table 3 are the mean values over the descending and ascending legs over the North Sea within the altitude range of 3.2 to 6.3 km. The aerosol parameters reported in Table 3 refer to am-bient pressure and temperature. The mass concentrations are computed as discussed
5
below. All mass concentrations reported in the figures refer to “case N” (no absorp-tion for FSSP). Besides leg-mean values, Table 3 also reports the maximum values of the 10-s mean values in these legs. Though not directly comparable, the maxi-mum values are of interest because the VAAC reported maximaxi-mum values, not mean values. Moreover, the ratio of maximum and mean values characterizes the scatter of
10
the data. For analysis of CO and O3 changes in the plumes, background concentra-tions are estimated from the data near the plumes; for SO2, a constant background
of 0.2 nmol mol−1 is assumed for this purpose. The relative humidity listed was mea-sured with the Lyman-α-hygrometer. The CR-2 instrument results differ by less than 7% root-mean-square.
15
Table 3 lists also the effective diameterDeff=3V/(2A), i.e. the ratio between particle volume V and projected particle cross-section areaA, each per unit ambient volume (Hansen and Travis, 1974; McFarquhar and Heymsfield, 1998). Here, V and A are computed by integrating over the respective size distributions from the accumulation mode and coarse mode particles (D>160 nm) assuming spherical particles. For ash
20
particles of equal volume but spheroidal shapes and aspect ratio, e.g., 3:1, the effective diameter would be about 20% larger (Krotkov et al., 1999; Schumann et al., 2010).
Based on the Lidar signals, many of the VA layers show a multi-layer structure with two or even more layers separated by gaps of 100–300 m thickness with significant lower signal. The boundaries given in Table 3 refer to the maximum extent in case of
25
ACPD
10, 22131–22218, 2010Airborne observations of the Eyjafjalla volcano ash
U. Schumann et al.
Title Page
Abstract Introduction
Conclusions References
Tables Figures
◭ ◮
◭ ◮
Back Close
Full Screen / Esc
Printer-friendly Version Interactive Discussion
Discussion
P
a
per
|
Dis
cussion
P
a
per
|
Discussion
P
a
per
|
Discussio
n
P
a
per
|
determined (Table 3). Thus, the detection limit for separated VA layers with enhanced aerosol backscatter is in the order of 8 µg m−3.
3.2 Volcanic particle properties
Well loaded samples of VA particles suitable for single particle analysis were collected by the impactor-sampling devices inside the fuselage on 2 May and 17 May, legs 6 and
5
10 of Table 3. These samples were taken in VA clouds of different eruption periods and different plume ages over the North Atlantic (7–12 h age) and over the North Sea (60–84 h). GPaC samples are available for 2 May. The particles were collected on TEM (transmission electron microscopy) grids covered with formvar foil and adhesiv carbon substrate for electron microscopy. In the post-flight analysis, several hundred particles
10
were investigated in a scanning electron microscope with an attached energy disper-sive X-ray (EDX) detector. This analysis yields particle size, aspect ratio, morphology, and the element chemical composition for each single particle. Based on morphology, chemical composition and beam stability, the particles are assigned to one of the follow-ing groups: silicates, quartz, oxides, chlorides, phosphates, carbonates, sulfates, soot,
15
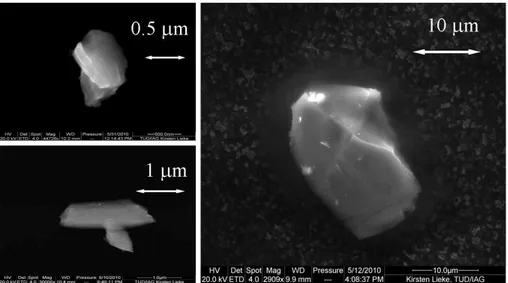
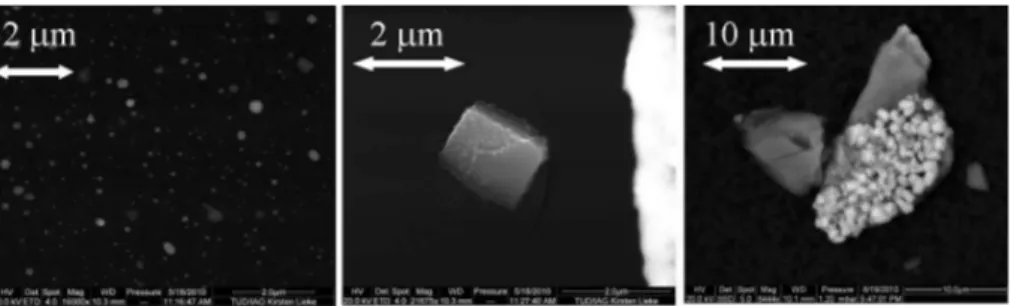
biological, secondary, and mixtures of these groups. The particles consist of a mixture of ash particles and sulfuric acid droplets or sulfate particles. Figure 4 shows typical ash particles, with maximum size of 20 µm. Figure 5 shows sulfuric acid droplets and aggregates. Based on TEM studies (selected area electron diffraction) of the sample of both days, most particles are crystalline, i.e. no glasses.
20
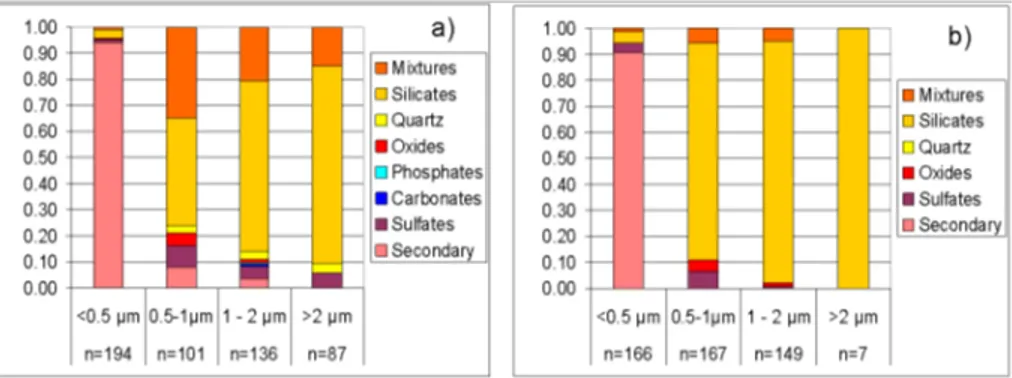
The particles collected on the TEM grids of the impactors operated downstream of the aerosol inlet have sizes up to about 3 µm (equivalent projected area diameter). The mean aspect ratio is about 1.8 for particles smaller 500 nm and 2.3 for larger particles. The relative number abundance of the different particle groups is shown for the two sampling days in Fig. 6 as function of size. Below 500 nm, the aerosol is
25
ACPD
10, 22131–22218, 2010Airborne observations of the Eyjafjalla volcano ash
U. Schumann et al.
Title Page
Abstract Introduction
Conclusions References
Tables Figures
◭ ◮
◭ ◮
Back Close
Full Screen / Esc
Printer-friendly Version Interactive Discussion
Discussion
P
a
per
|
Dis
cussion
P
a
per
|
Discussion
P
a
per
|
Discussio
n
P
a
per
In both samples, most silicate grains (more than 90%) are mixtures of various min-erals. Based on the chemical composition, the mixtures predominantly consist of feldspars, amphiboles/pyroxenes, and pure SiO2 minerals (most likely quartz) in
vari-able proportions. The composition of the silicates (external and within the mixtures) is different for the two sampling days (reflecting variable proportions of the different
5
silicate minerals). For example, the Si/Al atomic ratio (±one-sigma standard devia-tion) decreases from 3.6±2.8 on 2 May to 2.8±1.2 on 17 May indicating an increasing feldspar component. The iron content is higher on 2 May with an atomic Fe/Si ratio of 0.33 compared to Fe/Si=0.08 for 17 May. The lower iron contents will lead to less ab-sorption in the older plume. Furthermore, the sodium content is higher and the calcium
10
concentration lower on 17 May.
The element chemical composition of the particles can be used to infer the complex index of refraction with an effective medium mixing rule (Ouimette and Flagan, 1982). Applying this mixing rule, the real and imaginary part of the refractive index is calculated as a linear combination of the refractive indices of the individual components weighted
15
by their volume fraction. The refractive index of the individual components is taken from the literature, for details of the procedure refer to Kandler et al. (2009). As no further phase information on the specific iron minerals present in the volcanic dust is available, hematite is assumed to be the main absorbing component. The according refractive index data are taken from Sokolik and Toon (1999). The estimated uncertainties are
20
0.02 for the real part and possibly a factor of 3 for the imaginary part (Balkanski et al., 2007, estimate 0.04 and 50% for the real and imaginary part based on an extensive study for mineral dust).
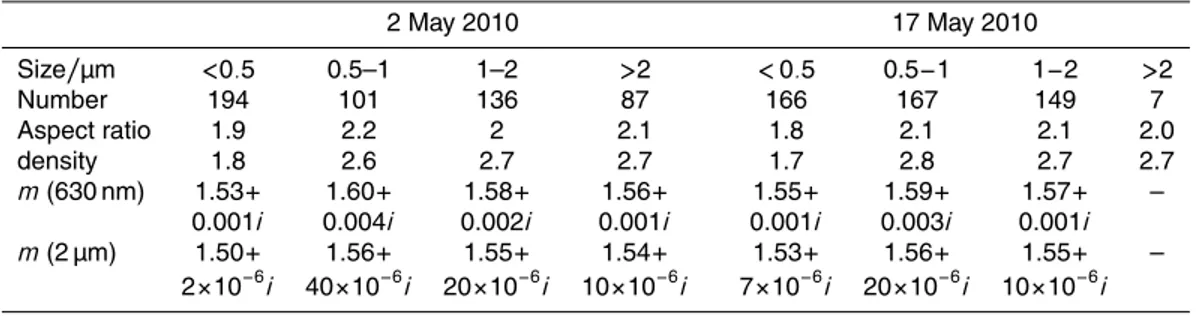
Table 4 shows the calculated refractive indices at 630 nm and 2 µm (wavelengths of the FSSP and Lidar lasers) for 2 May and 17 May. While there is no variation
25
ACPD
10, 22131–22218, 2010Airborne observations of the Eyjafjalla volcano ash
U. Schumann et al.
Title Page
Abstract Introduction
Conclusions References
Tables Figures
◭ ◮
◭ ◮
Back Close
Full Screen / Esc
Printer-friendly Version Interactive Discussion
Discussion
P
a
per
|
Dis
cussion
P
a
per
|
Discussion
P
a
per
|
Discussio
n
P
a
per
|
towards larger particles sizes in the volcanic mineral dust fraction. Particles larger than 2 µm and up to 20 µm collected with the GPaC instrument in the wing station showed imaginary refractive index values of 0.001i with low variation. While on 2 May 40% of the particles had imaginary refractive index values at 630 nm wavelength smaller than 0.0005i, 47% between 0.0005i and 0.002i and 13% of greater than 0.002i, on 17 May
5
64% were weakly light-absorbing (<0.0005i), 29% were between 0.0005i and 0.002i
and only 7% of the particles showed higher values of greater than 0.002i.
The mean particle densityρP derived from the relative number abundance of
parti-cle classes and published densities for the individual minerals (Tr ¨oger, 1982) is about 2.7 g cm−3. The smaller particles with large sulfate content probably have a density
10
similar to that of ammoniumsulfate (1.77 g cm−3). We assumedρP=2.6 g cm
−3
to hold for all VA layers investigated in this study.
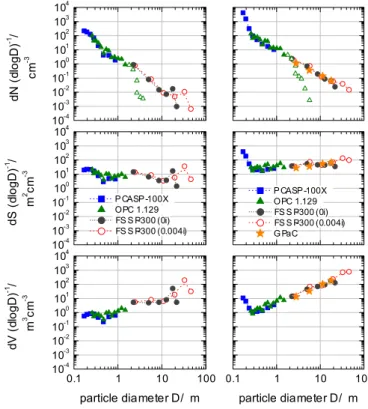
A particle size distribution is derived from the GPaC sample; see Fig. 7. For this purpose, all particles in an area of 0.14 mm2of the impaction plate were counted into size classes. From the cruise speed, sampling time and impaction area the sampling
15
volume was determined. The resulting number size distribution was weighted with the collection efficiency at the given speed, determined by computational fluid dynamics (Kandler et al., 2010). However, as the GPaC was not fully extended out of its con-tainer in this case, the collection efficiency was most probably significantly lower than calculated. Therefore, the size distributions can only be regarded relatively.
20
3.3 Volcanic particle size distributions and mass concentrations
The particle size distributions are computed from the data of the optical sensors assum-ing two different particle refractive index valuesm, and a density value,ρP=2.6 g cm−3. In this first analysis, we assume constant material properties (refractive index and den-sity) for the entire size distribution analysis. The OPC and PCASP results are analyzed
25
ACPD
10, 22131–22218, 2010Airborne observations of the Eyjafjalla volcano ash
U. Schumann et al.
Title Page
Abstract Introduction
Conclusions References
Tables Figures
◭ ◮
◭ ◮
Back Close
Full Screen / Esc
Printer-friendly Version Interactive Discussion
Discussion
P
a
per
|
Dis
cussion
P
a
per
|
Discussion
P
a
per
|
Discussio
n
P
a
per
Figure 7 shows exemplary size distributions of number, surface area and volume for 19 April and 2 May, i.e. for cases with relatively low and high ash concentration. The results of the PCASP and OPC agree very well in the overlapping size range below approximately 1.5 µm particle diameter. Above this size, the FSSP data are selected to define the size distribution, while the sharp decrease of the OPC data reflects the
5
decrease of particle penetration through the inlet with increasing particle sizes.
In case A, the particles controlling the total volume concentration and the integral over the volume size distribution occur in sizes of up to approx. 50 µm particle diame-ter (particles of 30 µm diamediame-ter contribute most to volume). As will be discussed further in Sect. 4.1, it appears unlikely that such large particles would survive long-range
trans-10
port due to sedimentation. Furthermore, the measurements with the 2D-C probe with a lower detection size of about 25 µm at a flight speed of 120 m s−1 have not shown a single particle count in any of the VA layers measured in-situ with the Falcon. There-fore, we deem the size distribution for case A to deliver only an upper estimate for the total particle volume concentration. The results for case N provide a lower estimate,
15
because the presence of at least some absorbing material follows from the chemical composition analysis and from the PSAP measurements for particles<2.5 µm. Larger particles appear to be less absorbing (Table 4).
We note that the total particle volume (mass) concentration is entirely dominated by the few largest size bins in the FSSP size range, no matter which refractive index is
20
used in the inversion of the aerosol spectrometer data. This is due to the volume being controlled by the third power of the particle diameter and the number size distribution tailing offtowards large particles remarkably slowly inside VA layers. This gives a vol-ume size distribution having its maximum close to the upper margin of the entire size range covered by the instruments. For 2 May, in the lower-estimate case N, 65% of
25
ACPD
10, 22131–22218, 2010Airborne observations of the Eyjafjalla volcano ash
U. Schumann et al.
Title Page
Abstract Introduction
Conclusions References
Tables Figures
◭ ◮
◭ ◮
Back Close
Full Screen / Esc
Printer-friendly Version Interactive Discussion
Discussion
P
a
per
|
Dis
cussion
P
a
per
|
Discussion
P
a
per
|
Discussio
n
P
a
per
|
In this respect it is very important to note that the derived decrease of number con-centrations and the increase in volume concentration with diameter is fully supported by the size distribution derived from the single particle analysis obtained with the GPaC on 2 May, see Fig. 7.
The largest uncertainty of the size spectra and mass concentration results comes
5
from the large impact of absorption of laser light by the ash particles on the measured signal. As can be seen from Table 3, an increase of the imaginary part of the refractive index of the particles from 0 to 0.004 increases the analyzed ash mass concentration by about a factor of 2 to 7 in the individual cases, factor of 4 on average. In view of the fact, that the imaginary part itself is uncertain to a factor of about 3, this is the
10
main uncertainty of this analysis. To estimate the impact of particle non-sphericity we assessed the instrument response of the FSSP by T-matrix calculations as explained above. Randomly oriented prolate spheroids provide the same amount of scattering for about 5–10% smaller area-equivalent diameter than spheres. However, for parti-cles larger than 7 µm, and aspect ratios between 1 and 2, the computed particle size
15
distribution was found to be far less sensitive to the particle shape than to the refractive index. An increase of the real part of the refractive index from 1.54 (as recommended for mineral dust, Balkanski et al., 2007) to 1.59 (a reasonable upper bound for VA according to Table 4) for non-absorbing particles, increases the derived mass concen-tration for selected legs (1, 6, and 10) by less than 15%. The sampling area of the
20
FSSP is known only within an estimated uncertainty of 50%. It is adjusted in this study according to the overlap with the OPC/PCASP data for the cases inside VA layers, with low relative humidity (below 40%). The impact of particle hydration at these humidities is small (Strapp et al., 1992). The resulting uncertainty for the particle mass is about 40%.