www.atmos-chem-phys.net/15/9217/2015/ doi:10.5194/acp-15-9217-2015
© Author(s) 2015. CC Attribution 3.0 License.
Microphysical processing of aerosol particles in orographic clouds
S. Pousse-Nottelmann1,3, E. M. Zubler2, and U. Lohmann1,3
1Institute for Atmospheric and Climate Science, ETH Zurich, 8092 Zurich, Switzerland
2Federal Office of Meteorology and Climatology MeteoSwiss, Operation Center 1, Zurich Airport, 8058 Zurich, Switzerland 3Center for Climate Systems Modeling, ETH Zurich, 8092 Zurich, Switzerland
Correspondence to:S. Pousse-Nottelmann ([email protected])
Received: 21 July 2014 – Published in Atmos. Chem. Phys. Discuss.: 27 January 2015 Revised: 14 June 2015 – Accepted: 21 July 2015 – Published: 20 August 2015
Abstract.An explicit and detailed treatment of cloud-borne particles allowing for the consideration of aerosol cycling in clouds has been implemented into COSMO-Model, the re-gional weather forecast and climate model of the Consortium for Small-scale Modeling (COSMO). The effects of aerosol scavenging, cloud microphysical processing and regenera-tion upon cloud evaporaregenera-tion on the aerosol popularegenera-tion and on subsequent cloud formation are investigated. For this, two-dimensional idealized simulations of moist flow over two bell-shaped mountains were carried out varying the treatment of aerosol scavenging and regeneration processes for a warm-phase and a mixed-warm-phase orographic cloud.
The results allowed us to identify different aerosol cycling mechanisms. In the simulated non-precipitating warm-phase cloud, aerosol mass is incorporated into cloud droplets by activation scavenging and released back to the atmosphere upon cloud droplet evaporation. In the mixed-phase cloud, a first cycle comprises cloud droplet activation and evapo-ration via the Wegener–Bergeron–Findeisen (WBF) process. A second cycle includes below-cloud scavenging by pre-cipitating snow particles and snow sublimation and is con-nected to the first cycle via the riming process which transfers aerosol mass from cloud droplets to snowflakes. In the sim-ulated mixed-phase cloud, only a negligible part of the total aerosol mass is incorporated into ice crystals. Sedimenting snowflakes reaching the surface remove aerosol mass from the atmosphere. The results show that aerosol processing and regeneration lead to a vertical redistribution of aerosol mass and number. Thereby, the processes impact the total aerosol number and mass and additionally alter the shape of the aerosol size distributions by enhancing the internally mixed/soluble Aitken and accumulation mode and generat-ing coarse-mode particles. Concerngenerat-ing subsequent cloud
for-mation at the second mountain, accounting for aerosol pro-cessing and regeneration increases the cloud droplet number concentration with possible implications for the ice crystal number concentration.
1 Introduction
Orography has an important influence on precipitation for-mation and can be a key factor in hydrology, ecology and climate on the local scale (Smith et al., 2005; Saleeby et al., 2009). When air rises over sloped terrain, it cools. Above the lifting condensation level, the air becomes supersaturated with respect to water allowing for the formation of cloud droplets by condensation of water vapor onto cloud conden-sation nuclei (CCN). In such a warm-phase cloud, precip-itation can form via condensational growth and collision– coalescence of cloud droplets. When temperatures fall be-low the freezing level, ice crystal formation is triggered by ice nuclei (IN), transforming the liquid cloud into a mixed-phase cloud. Due to the difference in saturation vapor pres-sure over ice and over water, ice crystals can grow rapidly at the expense of evaporating cloud droplets when the vapor pressure is below water saturation. This process, known as the Wegener–Bergeron–Findeisen (WBF) process (Wegener, 1911; Bergeron, 1935; Findeisen, 1938), can lead to a rapid glaciation of a mixed-phase cloud at temperatures between −38 and 0◦C. Below−38◦C the droplets start to freeze ho-mogeneously.
processes (Pujol et al., 2005), indicating the importance of the cold phase for precipitation formation.
Aerosol particles impact the cloud microphysical pro-cesses directly by serving as cloud condensation nuclei for the formation of cloud droplets and by initiating ice nucle-ation. They influence cloud development and properties and ultimately precipitation formation. However, the quantifica-tion of the aerosol effect on clouds remains challenging and represents one of the largest uncertainties in the climate sys-tem (Boucher et al., 2013).
Enhanced aerosol concentrations result in an increased number concentration of cloud droplets, shifting the droplet size spectrum towards smaller radii for a constant liquid wa-ter content (Twomey et al., 1974). Due to the reduced colli-sion efficiencies of smaller droplets, the formation of rain is delayed and the cloud may persist for a longer time period (Albrecht, 1989).
In idealized simulations of purely warm-phase orographic precipitation, Muhlbauer and Lohmann (2008) observed that increased atmospheric aerosol concentrations lead to more but smaller cloud droplets producing a shift in precipita-tion towards the leeward side of the mountain (spillover ef-fect). An investigation of orographic precipitation over the Sierra Nevada showed that polluted continental aerosol con-centrations in comparison to clean marine aerosol condi-tions lead to a precipitation reduction on the upslope side of the mountains, decreasing the overall precipitation by about 30 % (Lynn et al., 2007).
If ice processes are involved, the difference between clouds formed on marine vs. continental aerosol concentra-tions is even more pronounced (Lynn et al., 2007). Indeed, within mixed-phase cloud regimes, a decrease of the mean cloud droplet radius also implies a lessening of the riming efficiency between droplets and ice particles due to reduced collision efficiencies of smaller droplets (Lohmann, 2004). Saleeby et al. (2009) showed that in mixed-phase orographic clouds along the Park Range barrier in Colorado, enhanced CCN number concentrations modify the droplet distribution significantly, leading to a substantial inhibition of the riming process. At the same time, the WBF process is enhanced un-der polluted conditions because of the greater surface area exposure of more but smaller cloud droplets, largely com-pensating for the loss in snow growth by the reduced riming process (Saleeby et al., 2013).
Another important characteristic is the ice-nucleation abil-ity of certain aerosol types. Depending on the composition and mixing state, a part of the aerosol population may po-tentially serve as ice nuclei and trigger heterogeneous freez-ing. Depending on the temperature and supersaturation with respect to water, different freezing modes have been identi-fied (Vali, 1985). Zubler et al. (2011b) showed that the ef-fect of an increased aerosol number concentration on oro-graphic mixed-phase clouds strongly depends on the pres-ence of the ice phase and particularly the heterogeneous freezing of droplets. In cold simulations, with aerosol
parti-cles acting as CCN and as IN in the condensation/immersion freezing mode, the reduction of precipitation formation via the liquid phase due to smaller droplets is partly compen-sated by a glaciation of the clouds. The processes which are most affected by increased aerosol loadings are coalescence and riming (Muhlbauer and Lohmann, 2009), which are im-portant pathways for precipitation formation.
Muhlbauer and Lohmann (2009) investigated the impact of dust and anthropogenic black carbon anomalies as poten-tial ice nuclei on orographic mixed-phase clouds and pointed out the crucial role of the assumed aerosol properties. Due to the different onset temperatures and efficiencies of the differ-ent freezing modes, the ice phase may vary according to the dominant freezing process impacting riming rates and thus precipitation formation.
During their residence time in the atmosphere, aerosol par-ticles undergo various modifications which may affect their ability to serve as CCN and IN. Thereby, aerosol processing within clouds plays a crucial role, as the aerosol mass, com-position and mixing state can be altered. Due to activation, nucleation and collision–coalescence processes aerosol par-ticles are incorporated into hydrometeors. Processes like au-toconversion, accretion, aggregation, freezing, melting, rim-ing and self-collection transfer aerosol mass and number between the different hydrometeor classes. Aqueous-phase chemistry within droplets can lead to the formation of new aerosol mass. Finally, wet deposition, sedimentation and scavenging processes lead to a removal of aerosol mass from the atmosphere. However, a substantial fraction of hydrom-eteors evaporate/sublimate, releasing newly formed aerosol particles to the atmosphere with different size, composi-tion and mixing state compared to the original ones. Re-cent investigations concerning the impact of aerosol solubil-ity and recycled aerosol particles on orographic cloud forma-tion have been conducted by Xue et al. (2010, 2012). They explicitly account for the release of aerosol particles upon droplet and rain evaporation, replenishing between one-third and two-thirds of the scavenged aerosol particles. In their model configuration, the CCN number concentration explic-itly depends on the number concentration and properties of the background and regenerated aerosol particles. In ideal-ized 2-D simulations of warm-phase clouds over two bell-shaped mountains, recycled aerosol particles enhance the cloud droplet number concentration and thus reduce precipi-tation formation at the second mountain (Xue et al., 2010). In mixed-phase clouds, regenerated aerosol particles were found to inhibit the riming process by changing the droplet size distribution (Xue et al., 2012).
nucle-ating ability of certain aerosol particles and their release back into the atmosphere upon evaporation/sublimation.
To better understand the role of aerosol–cloud interac-tions and especially the role of regenerated aerosol particles, COSMO-Model, the regional weather forecast and climate model currently developed and maintained by the Consor-tium for Small-scale Modeling (COSMO), has been extended in a detailed treatment of hydrometeor-borne aerosol parti-cles following the approach by Hoose et al. (2008). The new scheme allows for the simulation of cloud cycling of aerosols by tracing them even when scavenged into hydrometeors.
The paper is structured as follows: in Sect. 2 we describe the employed cloud and aerosol microphysical parameteri-zations with a focus on aerosol–cloud interactions. In Sect. 3 we introduce the simulation setup before presenting the re-sults for warm-phase clouds in Sect. 4.1 and mixed-phase clouds in Sect. 4.2. In Sect. 5 we end with a summary of our results and conclusions.
2 Numerical model description
This study makes use of COSMO-Model (http://www. cosmo-model.org), a non-hydrostatic, fully compressible weather prediction and climate model. This limited-area mesoscale atmospheric prediction model integrates the elas-tic hydro-thermodynamical equations on a rotated Arakawa C-grid with a time-splitting approach following a split-explicit third-order Runge–Kutta scheme in combination with a fifth-order upstream horizontal advection scheme (Doms and Schättler, 2002; Steppeler et al., 2003). The aerosol and moisture variables are advected by the second-order positive-definite Bott scheme (Bott, 1989).
2.1 Cloud microphysics
Cloud microphysical processes are calculated within the two-moment bulk cloud microphysics scheme for water and ice clouds of Seifert and Beheng (2006). The scheme comprises prognostic equations for the mass and num-ber densities of five different hydrometeor classes: cloud droplets, ice crystals, raindrops, snowflakes and graupel. Warm-phase cloud processes include activation of cloud droplets, condensational growth and evaporation of cloud droplets, autoconversion (formation of rain by coagulating cloud droplets) and accretion (growth of raindrops by col-lection of cloud droplets), self-colcol-lection (mutual coagula-tion of cloud droplets/raindrops, remaining in the same drop category), evaporation of rain and collisional break-up of large raindrops. In colder regimes, the scheme also accounts for homogeneous and heterogeneous freezing, diffusional growth of ice crystals, aggregation (formation of snow by coagulating ice crystals), self-collection (mutual coagulation of ice/snow/graupel, remaining in the same hydrometeor cat-egory), riming (coagulation between the liquid and the ice
phase), melting and sublimation and related secondary pro-cesses. The Wegener–Bergeron–Findeisen process is repre-sented implicitly in the model because in an air parcel, which is supersaturated with respect to ice but subsaturated with re-spect to water, all condensate evaporates and the ice crystals grow by water diffusion. The parameterization of hydrome-teor sedimentation is based on mass- and number-weighted mean fall velocities.
2.2 Aerosol microphysics 2.2.1 The M7 aerosol module
The cloud microphysics scheme is coupled to the M7 aerosol module (Vignati et al., 2004; Muhlbauer and Lohmann, 2008, 2009; Zubler et al., 2011a) which is also used within the framework of the general circulation model system ECMWF Hamburg Model (ECHAM5-HAM) (Stier et al., 2005). The M7 aerosol module describes the aerosol population as a su-perposition of seven lognormal size distributions of the form N (lnr)=
7
X
k=1 Nk √
2πlnσk
exp
"
−
lnr−lnrk √
2 lnσk
2#
. (1)
Here,Nkrepresents the aerosol number concentration of the
kth aerosol mode withk∈ [1,7] andσk is the
correspond-ing geometric standard deviation. In M7, the aerosol number and mass concentrations are prognostic variables whereas the standard deviations are kept constant.
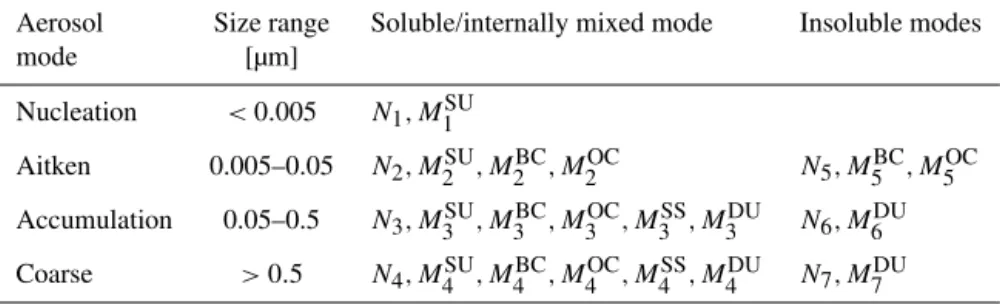
Table 1.Table of the different aerosol modes of the aerosol module M7. The size range of each mode is given for the count median radius
rk. Nk and MkX correspond to the aerosol number and mass density for the modek∈ [1,7] and compoundX∈ {SU,BC,OC,SS,DU}
respectively. Adapted from Vignati et al. (2004).
Aerosol Size range Soluble/internally mixed mode Insoluble modes mode [µm]
Nucleation <0.005 N1, M1SU
Aitken 0.005–0.05 N2, M2SU, M2BC, M2OC N5, M5BC, M5OC
Accumulation 0.05–0.5 N3, M3SU, M3BC, M3OC, M3SS, M3DU N6, M6DU
Coarse >0.5 N4, M4SU, M4BC, M4OC, M4SS, M4DU N7, M7DU
in a global 3-D model, Mann et al. (2012) found that dif-ferences between the two approaches were less than model– observation differences. However, they underlined that the size-resolved aerosol properties in modal schemes need to be benchmarked and improved against sectional schemes and observations. Applying a two-moment aerosol bulk micro-physics scheme with an explicit treatment of aerosol activa-tion and scaled rates for the other microphysical processes, Lebo and Morrison (2013) obtained similar results between the modal and the sectional approach. The explicit parame-terizations of aerosol activation and below-cloud scavenging processes in our model were evaluated against observations by Zubler et al. (2011a).
2.2.2 The aerosol processing scheme
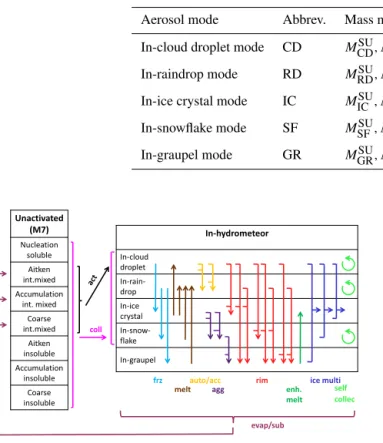
To simulate aerosol processing in clouds, five new aerosol modes corresponding to the five prognostic hydrometeor classes (cloud droplet (CD), ice crystal (IC), in-raindrop (RD), in-snowflake (SF) and in-graupel (GR) aerosol mode; Table 2) are introduced into the model. Fol-lowing the approach of Hoose et al. (2008), these new modes contain hydrometeor-borne aerosol mass, potentially consist-ing of a contribution of all five aerosol components (SU, BC, OC, SS, DU). The number densities of hydrometeor-borne aerosol particles are not prognostic variables, but diagnosed from the corresponding hydrometeor number density during evaporation and sublimation. The new modes are not limited by any specific size range. Their median radii are calculated directly upon evaporation/sublimation (Eq. 5). Aerosol ac-tivation scavenging, collision/impaction scavenging as well as sulfate production within droplets lead to an increase of the in-hydrometeor aerosol mass. In the standard version of the model as described by Muhlbauer and Lohmann (2008), the M7 aerosol module comprises the total aerosol popula-tion, including interstitial particles within the cloud, unacti-vated particles in cloud free air and actiunacti-vated in-hydrometeor aerosols. In the new model version presented here, only in-terstitial or unactivated aerosol particles are assigned to the M7 module. All material which is taken up by a hydrometeor is transferred to the new modes CD, IC, RD, SF and GR.
Aerosol particles are incorporated into hydrometeors due to the different scavenging processes, including activation of aerosol particles, in-cloud impaction scavenging and below-cloud scavenging by precipitating hydrometeors. Once inside a hydrometeor, the aerosol particles undergo the cloud micro-physical processes along with the hydrometeors. Upon evap-oration and sublimation, the in-hydrometeor aerosol mass is released to the atmosphere forming a newly generated aerosol particle. To allow for coagulation, sedimentation, ac-tivation and scavenging of the processed aerosol particles to-gether with the unactivated background aerosol, processed and background aerosol are summed up loosing valuable in-formation about their specific size distributions and com-position. When falling hydrometeors reach the ground, the hydrometeor-borne aerosol mass is directly removed from the system. These processes and the corresponding transfer of aerosol mass are illustrated in Fig. 1.
2.3 Aerosol–cloud interactions
In order to simulate aerosol–cloud interactions, the aerosol module has been coupled to the cloud microphysics scheme following the approach by Stier et al. (2005) as described in Muhlbauer and Lohmann (2008). In this standard version of the model, the aerosol number concentrations influence the cloud properties, but are not affected themselves by the clouds.
Table 2.Table of the five in-hydrometeor aerosol modes.MjX corresponds to the in-hydrometeor aerosol mass density for the modej∈ {CD,RD,IC,SF,GR}and compoundX∈ {SU,BC,OC,SS,DU}. The number modeNj withj∈ {CD,RD,IC,SF,GR}is not a prognostic
variable, but is diagnosed during evaporation and sublimation from the corresponding hydrometeor number density.
Aerosol mode Abbrev. Mass modes Number mode In-cloud droplet mode CD MCDSU, MCDBC, MCDOC, MCDSS, MCDDU NCD=Nc
In-raindrop mode RD MRDSU, MRDBC, MRDOC, MRDSS, MRDDU NRD=Nr
In-ice crystal mode IC MICSU, MICBC, MICOC, MICSS, MICDU NIC=Ni
In-snowflake mode SF MSFSU, MSFBC, MSFOC, MSFSS, MSFDU NSF=Ns
In-graupel mode GR MGRSU, MGRBC, MGROC, MGRSS, MGRDU NGR=Ng
In-hydrometeor
In-cloud droplet In-rain- drop In-ice crystal In-snow- flake
In-graupel Unactivated
(M7) Nucleation
soluble Aitken int.mixed Accumulation
int. mixed Coarse int.mixed
Aitken insoluble Accumulation
insoluble Coarse insoluble
evap/sub
coll
enh. melt
self collec frz
melt auto/acc
agg
rim ice multi
Figure 1. Microphysical transfer processes between the differ-ent aerosol modes (coll represdiffer-ents in-cloud and below-cloud colli-sion scavenging, act represents activation scavenging, frz represents freezing, melt represents melting, auto represents autoconversion, acc represents accretion, agg represents aggregation, rim represents riming, enh. melt represents enhanced melting, ice multi represents ice multiplication, self collec represents self-collection, evap repre-sents evaporation, sub reprerepre-sents sublimation).
2.3.1 Activation of cloud droplets
In the present model version the activation of cloud droplets is parameterized according to the approach by Lin and Leaitch (1997) following the works by Muhlbauer and Lohmann (2008) and Zubler et al. (2011a). The number of newly activated cloud droplets is based on the number concentration of soluble/mixed aerosol particles larger than 35 nm (N>35 nm) and the updraft vertical velocityw and is given by
∂Nc
∂t = (2)
max
(
1 1t
"
0.1
w Nt
>35 nm w+α N>t35 nm
1.27
−Nct−1
#
,0
)
,
with α=0.023 cm4s−1 and Nc the number of activated cloud droplets. The simulated vertical velocity may not reach
high enough values to realistically represent local updrafts when averaged over the entire grid box, especially in simula-tions with lower horizontal resolution. Therefore, the updraft velocitywis calculated as the sum of the grid-scale velocity wgand a subgrid-scale turbulent contribution. Following the approach of Lohmann (2002), the turbulent part depends on the turbulent kinetic energy (TKE) yielding for the updraft velocity
w=wg+cturb √
TKE, cturb=1.33. (3)
To be consistent with the standard parameterization of cloud droplet activation in the model we maintain this calculation of the updraft velocity in our simulations though not impera-tive at a horizontal resolution of 2 km.
N>35 nmis the number concentration of possible CCN par-ticles containing all soluble/mixed aerosols in the coarse (N4) and accumulation modes (N3) plus the number of mixed Aitken-mode particles (N2) with a wet radius larger than rcrit=35 nm such that
N>35 nm=N4+N3+ ∞
Z
ln(rcrit)
N2(lnr)d lnr. (4)
ap-plied, it transfers the scavenged aerosol mass from the un-activated aerosol modes in the M7 module to the in-cloud droplet aerosol mode. In the standard version of the model, no activation scavenging is considered.
2.3.2 Heterogeneous freezing processes
Regarding heterogeneous nucleation of ice crystals, the model accounts for freezing in condensation/immersion and in contact mode (Muhlbauer and Lohmann, 2009), neglect-ing deposition nucleation due to the prevailneglect-ing water sat-uration in mixed-phase clouds. The parameterization of immersion-mode freezing derived from Diehl and Wurzler (2004) and Lohmann and Diehl (2006) is based on the stochastic hypothesis considering that immersed aerosol par-ticles can enhance the efficiency of random ice nucleation in a droplet, but do not disturb its stochastic nature. For immer-sion freezing, we consider soluble mixed black carbon (BC) and mineral dust (DU) as efficient ice nuclei dependent on a material-specific, size-dependent freezing efficiency and on the surface area fraction (Muhlbauer and Lohmann, 2009). Heterogeneous freezing in the contact mode is parameterized following the approaches of Young (1974a), Cotton et al. (1986) and Lohmann and Diehl (2006). The freezing pro-cess is assumed to be induced by collisions between super-cooled water droplets and aerosol particles by Brownian dif-fusion (Muhlbauer and Lohmann, 2009). We consider insolu-ble (hydrophobic) black carbon (BC) and mineral dust (DU) as potential nuclei for contact freezing (Diehl et al., 2006). The Brownian diffusivity decreases with increasing particle size, leading to variations of the collision efficiency of several orders of magnitude between small and larger atmospheric aerosol particles.
2.3.3 Collision scavenging
The new model version further considers scavenging of aerosol particles by collision with hydrometeors. In-cloud collision scavenging refers to collision–coalescence of aerosol particles with cloud droplets or ice crystals. The pa-rameterization of the collision rate depends on prescribed collision kernels estimated by Young (1974b), the aerosol number concentration and the cloud droplet (ice crystal) number concentration. Collision scavenging by sediment-ing rain or snow is called below-cloud scavengsediment-ing. The parametrization is based on the scavenging coefficient fol-lowing the equations in Zhao and Zheng (2006) and Croft et al. (2009), as described by Zubler et al. (2011a). In order to consider only the final removal of aerosol par-ticles from the atmosphere by surface reaching hydrome-teors, Zubler et al. (2011a) multiplied the rate change of the tracer mass and number densities due to scavenging by rain (or snow) by the fraction of precipitating rain (or snow) reaching the surface. Scavenging by falling grau-pel is omitted. In the new aerosol processing scheme, all
precipitating raindrops and snowflakes, not only surface-reaching hydrometeors, may scavenge aerosol particles. In this scheme, the scavenging coefficients are thus indepen-dent from the fraction of surface reaching precipitation. The scavenged aerosol mass is attributed to the corresponding in-hydrometeor aerosol-modeMCDX or MICX for in-cloud colli-sion scavenging andMRDX orMSFX for below-cloud scaveng-ing withX∈ {SU,BC,OC,SS,DU}. The standard version of the model does not account for collision scavenging. 2.3.4 Evaporation/sublimation of hydrometeors During evaporation and sublimation of hydrometeors, aerosol particles are released back to the atmosphere. In-hydrometeor aerosol mass and the corresponding hydrome-teors are transported the same way. Within one model time step, hydrometeors may also fall through several vertical model layers as the sedimentation flux calculations are done on a smaller time step. We scale the in-hydrometeor sedimen-tation flux according to the sedimensedimen-tation flux of the corre-sponding hydrometeor. Therefore, the locations of evapora-tion/sublimation and the release of a new aerosol particles upon evaporation/sublimation coincide. The emitted aerosol particles are assumed to not break up (Mitra et al., 1992) and we presume that they contain a mixture of all foreign material in the hydrometeor as suggested by the homogeneous mixing assumption. Due to sulfate production in the aqueous phase, all processed particles contain some sulfate mass and there-fore are attributed to the unactivated internally mixed/soluble modes. Adopting lognormal size distributions for the newly formed aerosols, the dry median radius is calculated follow-ing Hoose et al. (2008) such that
rj= 3
v u u t
3 4π
Vjtot Nj
1 exp 1.5ln2σj
, (5)
j∈ {CD,IC,RD,SF,GR}
Nj denotes the number density of potentially released
aerosol particles (equal to the number density of the corre-sponding hydrometeors) andσjis the geometric standard
de-viation of the size distribution being fixed to the value of the corresponding unactivated aerosol mode.Vjtotrepresents the total in-hydrometeor volume of aerosol mass within the grid box as given by
Vjtot=X
l
MjX
ρX
, X∈ {SU,BC,OC,SS,DU}. (6)
3 Model setup
The present study focuses on the simulation of moist flow over two bell-shaped mountains in order to investigate the influence of processed aerosols on orographic cloud forma-tion. The setup is based on the works of Muhlbauer and Lohmann (2008) and Muhlbauer et al. (2010). The two-dimensional computational domain comprises 500 horizon-tal grid points with a grid spacing of 2 km yielding a do-main size of 1000 km. In the vertical, 50 levels follow hy-brid height-based Gal–Chen coordinates from the surface to the top of the computational domain at 22 km. The vertical grid spacing varies between 10 m for the lowest model level and 1000 m for the highest level. The model time step is 10 s. At the bottom of the domain we impose a free-slip boundary condition. To minimize the reflection of gravity waves from the upper model boundary, a Rayleigh damping sponge layer fills the upper part of the computational domain beginning at an altitude of 11 km. The idealized topography consists of two identical bell-shaped mountains, each following the form given by Kirshbaum and Durran (2004):
h(x)=
(h
0
16
1+cos πx−xi
4a
4
, |x−xi|<4a
0, |x−xi|>4a
(7)
with h0=800 m the mountain peak height, a=20 km the mountain half-width and xi the horizontal position of the
mountain peak withi∈ {1,2}. The two mountain peaks are located atx1=600 km andx2=800 km, implying a distance of 200 km between the two mountain peaks. In the present setup, aerosol particles may be processed by the cloud over the first mountain, and then advected towards the second mountain where the processed aerosol particles potentially influence further cloud formation.
3.1 Dynamical initialization
The temperature and humidity profiles are initialized fol-lowing the work of Muhlbauer and Lohmann (2008). The initial temperature profile is calculated analytically follow-ing Clark and Farley (1984) based on the sea-level pressure pSL, sea-level temperatureTSL and dry Brunt–Väisälä fre-quencyNd. The sea-level pressure is fixed topSL=1000 hPa and the dry Brunt–Väisälä frequency is prescribed verti-cally constant withNd=0.011 s−1(Muhlbauer et al., 2010). The sea-level temperature varies between TSL=280 K and TSL=270 K to allow for the formation of warm-phase and mixed-phase clouds. The relative humidity profile is calcu-lated using a modified Fermi function (Spichtinger, 2004) given by
RH(z)=a+ b−a 1+exp(−c(z−z0))
, (8)
with the parametersa=0.90,b=0.03,c=0.0015 m−1and z0=5000 m. At the surface, the prescribed relative humidity
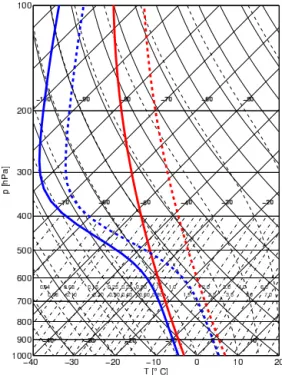
Figure 2.Skew-T–log-P diagram of the atmospheric soundings for the idealized 2-D simulations showing the temperature (red) and the dew point temperature (blue) with a surface relative humidity of 90 %. The warm sounding (dashed) with a surface temperature of 280 K is used for the simulation of a warm-phase cloud and the cold sounding (solid) with a surface temperature of 270 K is used for the simulation of a mixed-phase cloud.
profile has a value of RH=0.90 which smoothly decreases with height to a value of RH=0.03. The corresponding ver-tical profiles of temperature (red) and dew point tempera-ture (blue) are shown in Fig. 2. Solid lines indicate the cold profiles and dashed lines indicate the warm profiles. Follow-ing the setup of Muhlbauer et al. (2010) the horizontal wind speedU is vertically constant with 15 ms−1 up to an alti-tude of 10 km. It then increases linearly with height up to 40 ms−1 at the top of the model domain. The initial con-ditions as specified yield a dimensionless mountain height Ndh0/U=0.59. According to theoretical considerations of dry flow over topographies (e.g., Durran, 1990), one thus ex-pects an unblocked regime with flow over the ridge and asso-ciated formation of gravity waves. In our simulations, how-ever, the dynamics of the flow will be modified by latent heat release resulting from condensation. As we focus on micro-physical effects only, the complexity of this aerosol–cloud in-teraction study is reduced by turning off the radiation scheme and the convection parameterization.
3.2 Aerosol initialization
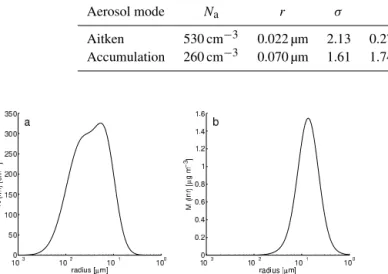
Table 3.Parameters of the initial aerosol size distributions (Muhlbauer and Lohmann, 2008) and mass fractional composition (Cozic et al., 2008) withNathe aerosol number density,rthe mode mean radius,σthe standard deviation andMathe aerosol mass density of the lognormal
distribution. Aerosol compounds include organic carbon (OC), black carbon (BC), sulfate (SU) and dust (DU).
Aerosol mode Na r σ Ma Mass fractional composition
Aitken 530 cm−3 0.022 µm 2.13 0.27 µg m−3 66 % OC, 30 % SU, 4 % BC Accumulation 260 cm−3 0.070 µm 1.61 1.74 µg m−3 60 % OC, 28 % SU, 9 % DU, 3 % BC
Figure 3.Initial aerosol (a)number density and(b)mass density size distributions for all simulations.
concentrations are compiled from measurement data col-lected by a scanning mobility particle sizer (SMPS) during a field campaign in 1999 at the high Alpine research station Jungfrauchjoch (Weingartner et al., 1999). Throughout this study we use the average summertime aerosol size distribu-tion as described by Muhlbauer and Lohmann (2008), which is representative of planetary boundary layer air in the Alpine region. During the summer months, convective processes and local circulations allow for the transport of boundary layer air including local anthropogenic emissions to the free tro-posphere (Weingartner et al., 1999). The initial aerosol com-position is based on observations of aerosol mass spectrom-etry at the same location (see Fig. 11 in Cozic et al., 2008). Aerosol particles are internal mixtures of black carbon (BC), organic carbon (OC), sulfate (SU) and dust (DU). The first three compounds are, besides nitrates, frequently observed in central Switzerland (Hueglin et al., 2005). Dust can be oc-casionally observed at the Jungfraujoch during intense Saha-ran dust events (Cozic et al., 2008; Chou et al., 2011). The aerosol number and mass concentrations are set as constant with height based on the parameters for the aerosol size dis-tributions given in Table 3.
Sulfate nucleation-mode particles are formed by gas-to-particle conversion from gas-phase sulfuric acid at low tem-peratures. Due to their small size, these particles cannot be measured by the SMPS. The vertical profiles of gaseous sulfate and the nucleation-mode aerosol particles are there-fore initialized with averaged pseudo-soundings taken from the global circulation model ECHAM5-HAM (Stier et al., 2005) for the nearest Jungfraujoch grid point as described by Muhlbauer and Lohmann (2008).
To investigate the impact of aerosol processing and re-generation on the aerosol size distribution and further cloud formation, we vary the complexity of the representation of aerosol processes within the model (Table 4). The control simulations, CTL-w and CTL-c, employ the standard version of the aerosol module M7 without any scavenging processes (Muhlbauer and Lohmann, 2008, 2009) for the warm (w) and cold (c) cases, respectively. The simulations SCAV-w and SCAV-c include aerosol activation scavenging and below-cloud scavenging as described by Zubler et al. (2011a). In the simulations AP-w and AP-c we explicitly account for the new aerosol processing scheme including detailed aerosol activation, in-cloud and below-cloud scavenging processes, aerosol processing in clouds and aerosol regeneration upon hydrometeor evaporation and sublimation as described in the model section of this paper. To isolate the effect of aerosol regeneration, we additionally conduct simulations with the same parameterizations of the scavenging processes as in simulation AP-w and AP-c, but without aerosol regeneration (SCAV-ALL-w and SCAV-ALL-c).
4 Results
The following analyses are conducted after 10 h of simula-tion time, when a steady flow has been established and pro-cessed air masses from the first mountain pass over the sec-ond mountain. After 10 h, a hydrostatic mountain wave has developed with upstream regions of flow deceleration and downstream regions of flow acceleration. The upstream re-gion is characterized by almost horizontal isentropes while the gravity wave generates foehn-like winds on the leeward side of the ridge.
4.1 Warm-phase cloud
pro-Table 4.Description of the conducted simulations.
Simulation Temperature Aerosol initialization Description
CTL-w 280 K all aerosols mixed standard simulation (Muhlbauer and Lohmann, 2008, 2009)
SCAV-w 280 K all aerosols mixed with aerosol activation and below-cloud scavenging (Zubler et al., 2011a)
SCAV-ALL-w 280 K all aerosols mixed with activation scavenging, the adapted below-cloud scavenging parameterization
and in-cloud collision scavenging
AP-w 280 K all aerosols mixed with aerosol processing (including all scavenging processes and aerosol regeneration)
CTL-c 270 K 50 % of DU is insoluble standard simulation
SCAV-c 270 K 50 % of DU is insoluble with aerosol activation and below-cloud scavenging
SCAV-ALL-c 270 K 50 % of DU is insoluble with activation scavenging, the adapted below-cloud scavenging parameterization
and in-cloud collision scavenging
AP-c 270 K 50 % of DU is insoluble with aerosol processing
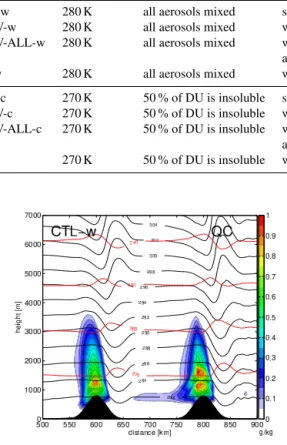
Figure 4.Vertical cross section of the cloud water mixing ratio (QC) for the simulation CTL-w after 10 h. Black lines indicate the poten-tial temperature (K) and red lines the temperature (K). Only part of the computational domain is shown.
duced at the first mountain. In a similar setup, Xue et al. (2010) obtained a maximum cloud water mixing ratio of more than 0.7 g kg−1and a maximum rainwater mixing ratio between 0.01 g kg−1for a dry and 0.12 g kg−1for a wet envi-ronment. The generated clouds are almost entirely composed of cloud droplets, producing only a negligible amount of rain. Newly formed raindrops subsequently evaporate within the same time step as no significant amount of precipitation re-mains in the atmosphere or falls to the surface. The four simulations differ regarding the treatment of aerosol scav-enging and regeneration processes which directly impacts the aerosol population. This becomes apparent in the num-ber concentration of internally mixed/soluble aerosol parti-cles larger than 35 nm N>35 nm (Fig. 5), which represents the number concentration of potential CCN in the model. In simulation CTL-w, where aerosol scavenging and regener-ation processes are neglected, the aerosol number concen-trationN>35 nmis only affected by the dynamical flow over the mountain leading to a minor variation between 325 and 400 particles per cm3. The impact of activation and below-cloud scavenging becomes apparent in simulation SCAV-w
whereN>35 nmis significantly reduced down to 200 particles per cm3 in air masses which have passed through a cloud. Cloud droplet formation and collisions between aerosol par-ticles and sedimenting hydrometeors reaching the surface efficiently scavenge aerosol particles in the region above the mountains. The corresponding air masses are then ad-vected downstream so that reduced aerosol concentrations can be observed in the entire lower part of the model do-main downstream of the first mountain. Simulation SCAV-ALL-w includes in-cloud collision scavenging and a more explicit treatment of below-cloud scavenging, as collisions with all sedimenting hydrometeors and not only with the ones reaching the surface are considered. In this simulation, N>35 nmshows a similar pattern. In-cloud collisions mainly involve Aitken-mode particles, which only represent a small subset ofN>35 nm. In simulation AP-w, some of the scav-enged aerosol particles are replenished by aerosol regenera-tion upon evaporaregenera-tion in the downdraft region at the downs-lope side of the mountains. Since the prevailing wind in the simulations is unidirectional, most of the regenerated aerosol particles released upon evaporation in the first cloud are di-rectly advected downstream towards the second mountain where they may impact further cloud formation.
Figure 5.Vertical cross section of the number concentration of aerosol particles larger than 35 nm (N>35 nm) which may potentially act as
CCN in the model for simulation CTL-w, SCAV-w, SCAV-ALL-w and AP-w after 10 h. Black lines indicate the potential temperature (K) and red lines the temperature (K). Only part of the computational domain is shown.
Figure 6.Vertically integrated aerosol mass transfer rates per sec-ond of different processes within the microphysical scheme along the flow direction after 10 h in simulation AP-w over the first moun-tain (mounmoun-tain peak represented by the triangle at 600 km). Only aerosol mass transfer rates larger than 0.2 µg m−2s−1are shown.
mass remain negligible. A large part of in-droplet aerosol mass is released back to the unactivated aerosol modes upon cloud droplet evaporation. Most of the aerosol re-emission occurs behind the mountain crest between 600 and 630 km on the downslope side of the mountain. The other microphysical processes generate insignificant transfer rates.
The recycled aerosol particles are re-attributed to the free aerosol modes changing the size distribution and total num-ber concentration of the interstitial or unactivated aerosol particles. Figure 7 depicts the vertical profile ofN>35 nm up-stream (left panel) and downup-stream (right panel) of the first cloud. Upstream of the first mountain, the four simulations exhibit the same constant vertical profile ofN>35 nmwith an
average value of 360 particles per cm3. After passage over the first mountain, the simulations show distinctly different vertical profiles. In simulation CTL-w the almost-constant vertical profile is conserved. The other simulations reveal a reduction inN>35 nmfrom the surface up to an altitude of 3700 m. Simulations SCAV-w and SCAV-ALL-w include an almost-constant reduction to around 220 particles per cm−3 with considerable variations in the lower 1000 m. The strong peak at about 600 m altitude corresponds to new droplet for-mation between the two mountains. As the differences be-tween these two simulations remain small, in-cloud scaveng-ing and the adapted below-cloud scavengscaveng-ing parameteriza-tion accounting for all aerosol–hydrometeor collisions have only a negligible impact onN>35 nmin the present setup. In simulation AP-w, the loss inN>35 nmis partly replenished, maintaining a similar pattern in the vertical profile to the sim-ulations SCAV-w and SCAV-ALL-w.
verti-Figure 7.Vertical profile of the number concentration of aerosol particles larger than 35 nm (N>35 nm) after 10 h(a)upstream
(aver-aged between 510 and 530 km) and(b)downstream (averaged be-tween 680 and 720 km) of the first mountain for the warm cloud cases. Dotted horizontal lines indicate altitudes at which cumula-tive aerosol size distributions are compiled.
cal profile follows the same pattern as in simulation SCAV-w and SCAV-ALL-w.
The mean cumulative aerosol number and mass concentra-tions of the Aitken, accumulation and coarse modes down-stream of the first orographic cloud at 300 and 2000 m alti-tude are depicted in Figs. 9 and 10. The size distributions are calculated from the simulated values for the number concen-trations and dry radii of the different aerosol modes. To ob-tain representative values for the processed air masses after passage over the mountain, the variables are averaged hor-izontally between 680 and 720 km. We adopt the standard deviation from the initial measurements for the nucleation (σ =2.13) and Aitken modes (σ=1.61) and the prescribed value in COSMO-Model for the coarse mode (σ=2.0). The number size distributions (Figs. 9a and 10a) are characterized by a bimodal shape of Aitken- and accumulation-mode par-ticles. Differences between the initial aerosol number con-centration and CTL-w are due to aerosol coagulation and sedimentation processes, as the corresponding air masses have been exposed to aerosol microphysical processes in the model domain for 10 h. After 10 h the bimodal shape of the aerosol number concentration becomes more pronounced and the number of aerosol particles in both modes is reduced. The aerosol mass distribution is dominated by accumulation-mode particles, as Aitken-accumulation-mode particles are too small to contribute significantly to the total aerosol mass. A slight re-duction of the aerosol mass distribution can be observed in CTL-w at 2000 m altitude (Fig. 10b). In simulation SCAV-w the scavenging processes SCAV-within the orographic cloud im-pact the aerosol size distribution by reducing the number and mass of unactivated aerosol particles. Due to activation scavenging, N>35 nm is removed from the atmosphere, re-ducing primarily the accumulation-mode number concentra-tion and shifting the mean size of the Aitken-mode towards
Figure 8.Vertical profile of the total aerosol mass density after 10 h
(a)upstream (averaged between 510 and 530 km) and (b) down-stream (averaged between 680 and 720 km) of the first mountain for the warm cloud cases. Dotted horizontal lines indicate altitudes at which cumulative aerosol size distributions are compiled.
smaller sizes. The two aerosol modes appear clearly sepa-rated and the bimodal shape of the aerosol number concen-tration becomes more distinct. The scavenging processes also cause a decrease in the aerosol mass distribution. In simula-tion SCAV-ALL-w the adapted parameterizasimula-tions for below-cloud scavenging and in-below-cloud collision scavenging between interstitial aerosol particles and cloud droplets induce an ad-ditional decrease in Aitken-mode particles compared to sim-ulation SCAV-w. A sensitivity test revealed that this reduc-tion is mainly due to in-cloud collision scavenging. No sig-nificant impact on the aerosol mass distribution can be ob-served as Aitken-mode particles account for only a negligible fraction of the aerosol mass due to their small size. In simu-lation AP-w, part of the processed aerosol particles is regen-erated upon evaporation, increasing the number concentra-tion and mass of aerosol particles compared to SCAV-ALL-w. The release of processed aerosol particles significantly in-creases the number concentration of the Aitken and accumu-lation modes along with a gain in the aerosol mass distribu-tion compared to SCAV-ALL-w. Regenerated Aitken-mode particles have an increased size and mass compared to the background Aitken-mode particles. Therefore, the average radius of the combined Aitken mode is increased shifting the lognormal size distribution towards larger sizes. The Aitken mode thus appears as a hump on the left-hand side of the accumulation-mode size distribution. At 2000 m altitude, the aerosol mass distribution reveals the formation of some large coarse-mode particles that impact the aerosol mass distribu-tion, but not the aerosol number concentration.
Figure 9.Cumulative aerosol(a)number and(b)mass size distri-bution after cloud passage after 10 h for the warm cloud cases. The values are averaged horizontally between 680 and 720 km at 300 m altitude.
concentration between simulations AP-w and SCAV-ALL-w are depicted in Fig. 11a and b. In simulation AP-w, signifi-cantly more cloud droplets are formed than in SCAV-ALL-w. As the liquid water content of the cloud is only marginally influenced by the modified aerosol concentrations, this trans-lates in a larger number of droplets, which are smaller sized. Changes in the droplet size distribution potentially affect rain formation. However, as the present cloud is characterized as non-precipitating with no measurable rainwater content, a potential reduction of rainwater content and raindrop num-ber concentration cannot be observed.
The difference in cloud droplet number concentrations over the second mountain between simulations AP-w and CTL-w is shown in Fig. 11c. As already seen earlier in this paper,N>35 nmis reduced in AP-w compared to CTL-w. This results in a strong diminution of the cloud droplet number concentration. Figure 11d illustrates the difference in cloud droplet number concentrations over the second mountain be-tween simulations AP-w and SCAV-w. The results are sim-ilar to Fig. 11b where the difference between simulations AP-w and SCAV-ALL-w is shown. Based on similar vertical profiles ofN>35 nmin simulation ALL-w and SCAV-w, comparable cloud droplet number concentrations are pro-duced in both simulations. This result illustrates that in-cloud collision scavenging impacts the aerosol size distributions, but has only marginal influence on cloud droplet formation. Obviously, the lowest cloud droplet number concentrations are observed in SCAV-w and SCAV-ALL-w. As no aerosol regeneration is taken into account, all newly formed clouds droplets at the second mountain activated from aerosol par-ticles that have not been activated at the first mountain. Xue et al. (2010) observed a similar relationship between aerosol regeneration and cloud droplet number concentration. Sensitivity tests
In order to evaluate the uncertainties of the presented results sensitivity studies are carried out. A first set of simulations is initialized with wintertime aerosol size distributions fol-lowing Muhlbauer et al. (2010) and Xue et al. (2010, 2012)
Figure 10.Cumulative aerosol(a)number and(b)mass size distri-bution after cloud passage after 10 h for the warm cloud cases. The values are averaged horizontally between 680 and 720 km at 2000 m altitude.
which represent a clean aerosol case. Accordingly, the num-ber concentrations of the Aitken and accumulation modes are reduced to 310 and 40 cm−3 respectively. The simulations generate precipitating warm-phase clouds with a maximum cloud liquid water mixing ratio of 0.76 g kg−1 and a maxi-mum rainwater mixing ratio of 0.10 g kg−1at the first moun-tain. As expected, the cloud water content is reduced and the rainwater content is increased in the clean simulations as compared to the more polluted warm case presented be-fore. Aerosol mass transfer rates for the corresponding sim-ulation with aerosol processing are depicted in Fig. 12. In this simulation, the aerosol mass transfer rates which are caused by activation scavenging and aerosol regeneration upon cloud droplet evaporation prevail. Aerosol mass trans-fer into raindrops caused by collisions and autoconversion, and the subsequent removal through precipitation or regen-eration through evaporating raindrops play a minor role. In a cloud with enhanced rainwater content, these rates might in-crease. The cumulative aerosol number and mass size distri-butions for the different clean case simulations averaged be-tween 680 and 720 km at an altitude of 300 m are displayed in Fig. 13. Aerosol scavenging in simulation SCAV and SCAV-ALL reduces the number of aerosol particles in the Aitken and accumulation mode, and it shifts the Aitken mode to-wards smaller radii. The impact of aerosol regeneration can be identified as a small increase in the number concentra-tions of both aerosol modes and a shift of the Aitken mode towards larger radii. These findings agree with the results of the polluted warm case.
Figure 11.Number concentration of cloud droplets in(a)simulation AP-w and difference in cloud droplet number concentration between simulations(b)AP-w and SCAV-ALL-w,(c)AP-w and CTL-w and(d)AP-w and SCAV-w after 10 h over the second mountain. Black lines indicate the potential temperature (K) and red lines the temperature (K). Only part of the computational domain is shown.
Figure 12.Vertically integrated aerosol mass transfer rates per sec-ond of different processes within the microphysical scheme along the flow direction after 10 h in the simulation with aerosol process-ing for the clean aerosol initialization over the first mountain (moun-tain peak represented by the triangle at 600 km). Only aerosol mass transfer rates larger than 0.02 µg m−2s−1are shown.
model. Further sensitivity experiments include simulations with a reduced surface relative humidity of 85 and 80 %.
In order to evaluate the impact of aerosol processing and regeneration on the aerosol population and on the number concentration of possible CCN in the model, the aerosol pop-ulation in a sample domain downstream of the first mountain between 680 and 720 km is analyzed. The results at 300 and 2000 m altitude are summarized in Table 5.Nregdenotes the difference in the total aerosol particles number concentration averaged over the sample area between simulations AP and SCAV-ALL and thus represents the additional particles due to aerosol processing and regeneration. This number
concen-tration is compared to the total aerosol number concenconcen-tration Ntotal(Aitken, accumulation and coarse mode) in the sample area in simulation AP. A similar approach is applied for CCN by comparing the difference in the CCN number concentra-tion between simulaconcentra-tion AP and SCAV-ALL (NregCCN) to the CCN number concentration in simulation AP (NtotalCCN). In the aerosol polluted experiments, regenerated aerosol particles account for 23–39 % of the total aerosol particles and for 33–47 % of the CCN particles at 300 m altitude. Their con-tributions are slightly reduced to 18–23 % of the total aerosol particles and to 32–30 % of the possible CCN at 2000 m al-titude. In the two clean cases, regenerated particles repre-sent less than 10 % of the total aerosol particles. However, they account for 35–46 % of the CCN particles. In the clean experiments, the aerosol population is mainly composed of Aitken-mode particles as can be seen in Fig. 13.
regener-Table 5. Ratios of the aerosol number concentration of “regenerated” particles (Nreg, difference between AP and SCAV-ALL), the total
aerosol number concentration in simulation AP (Ntotal), the number concentration of “regenerated” particles potentially acting as CCN
(NregCCN, difference between AP and SCAV-ALL), the number concentration of CCN in simulation AP (NtotalCCN) and the number concentration of “missing particles due to scavenging” (Nscav, difference between SCAV-ALL and CTL) of the sensitivity studies of the warm case. The
values are averaged horizontally between 680 and 720 km at 300 and 2000 m altitude.σ∗denotes the simulations with the M7 standard deviations. The first two lines describe the analyzed warm case.
RHsurface Altitude Aerosol initialization Nreg/Ntotal NregCCN/NtotalCCN Nreg/Nscav
90 % 300 m polluted summer 0.23 0.33 0.24 2000 m polluted summer 0.18 0.32 0.24 85 % 300 m polluted summer 0.39 0.47 0.36 2000 m polluted summer 0.18 0.35 0.25 80 % 300 m polluted summer 0.31 0.43 0.26 2000 m polluted summer 0.23 0.39 0.39 90 %,σ∗ 300 m polluted summer 0.23 0.33 0.24 2000 m polluted summer 0.18 0.32 0.24 90 % 300 m clean winter 0.04 0.35 0.12 2000 m clean winter 0.08 0.44 0.27 80 % 300 m clean winter 0.05 0.46 0.19 2000 m clean winter 0.03 0.38 0.12
Figure 13.Cumulative aerosol(a)number and(b)mass size distri-bution after cloud passage after 10 h for the warm simulations with clean aerosol initialization. The values are averaged horizontally be-tween 680 and 720 km at 300 m altitude.
ated particles replenish one-third to two-thirds of the missing particles.
The presented sensitivity experiments show that the im-pact of regenerated aerosol particles on the aerosol and CCN number concentrations depends on the cloud regime and the aerosol population. Variations in the relative humidity and the standard deviation are shown to have a smaller influence. 4.2 Mixed-phase cloud
We employ the cold temperature profile with a surface tem-perature of 270 K to generate mixed-phase orographic clouds over the two mountains. The ascent over the bell-shaped mountains results in the formation of liquid cloud droplets on the upslope side of the mountain. After 10 h, liquid droplets only persist at cloud base (Fig. 14). Advected aloft, they may undergo heterogeneous freezing processes to form ice crys-tals which constitute the upper part of the cloud. Due to the
difference in saturation vapor pressure over ice and over liq-uid, cloud droplets may also evaporate in the presence of ice crystals allowing for the enhanced condensation of wa-ter vapor on preexisting ice crystals (Wegener–Bergeron– Findeisen process). The cloud over the first mountain con-sists mainly of cloud ice and snow with little cloud liquid wa-ter. In this first cloud, collision processes between ice crys-tals lead to the aggregation of snowflakes which sediment to the surface. A large part of the cloud water is removed from the atmosphere by sedimenting snow, reducing the available water vapor in the atmosphere. Therefore, the environment downstream of the first cloud is drier than in front of the first cloud. The cloud over the second mountain developing in this drier environment has much less cloud ice and the snow for-mation processes are suppressed.
evapora-Figure 14.Vertical cross section of the cloud water mixing ratio (QC), ice water mixing ratio (QI) and snow water mixing ratio (QS) in sim-ulation CTL-c after 10 h. Black lines indicate the potential temperature (K) and red lines the temperature (K). Only part of the computational domain is shown.
Figure 15.Vertically integrated aerosol mass transfer rates of differ-ent processes within the microphysical scheme along the flow direc-tion after 10 h in simuladirec-tion AP-c over the first mountain (mountain peak represented by the triangle at 600 km). Only part is of com-putational domain is shown. Only aerosol mass transfer rates larger than 0.2 µg m−2s−1are shown.
tion take place at the same horizontal location but at different altitudes. These two processes form a first aerosol process-ing cycle which acts via the liquid phase. The ice crystals grow and aggregate to form snowflakes which efficiently take up aerosol mass by riming with cloud droplets and below-cloud scavenging of interstitial aerosol particles. Sediment-ing snowflakes remove aerosol mass from the atmosphere. Downstream of the cloud, some snowflakes sublimate re-leasing aerosol mass back to the interstitial mode (peak at 630 km). The second aerosol processing cycle therefore cov-ers the interactions with snowflakes. A connection between the two cycles represents the riming process which transfers aerosol mass from cloud droplets to snowflakes. The other microphysical processes within the model are negligible for the transfer of aerosol mass in the present case study.
The described processes within the first cloud have an im-portant influence on the vertical distribution of aerosol parti-cles. Figure 16 shows the vertical profile of the total aerosol mass for the different simulations upstream (left panel) and downstream (right panel) of the first cloud. All simulations show the same vertical profile upstream of the first moun-tain. In simulation CTL-c, the vertical profile remains con-stant after passage over the mountain. Simulation SCAV-c includes a reduction of aerosol mass in the lower 3700 m
where the cloud forms. This reduction is due to activation and below-cloud scavenging. The modified scavenging param-eterizations in simulation SCAV-ALL-c generate a signifi-cantly larger diminution of the aerosol mass concentration in the lower part of the atmosphere. In simulation SCAV-ALL-c, below-cloud scavenging is treated differently, as all aerosol particles colliding with sedimenting rain or snow are re-moved from the unactivated aerosol modes, whereas in simu-lation SCAV-c only the fraction corresponding to the fraction of precipitation reaching the surface is removed. Therefore, below-cloud scavenging is far more efficient in simulation SCAV-ALL-c, as apparent in the amplified reduction of the vertical profile below 2000 m altitude. Additionally, SCAV-ALL-c accounts for in-cloud collision scavenging and scav-enging of aerosol particles acting as contact IN. In simulation AP-c, evaporation processes lead to the release of additional aerosol particles, increasing the aerosol mass compared to SCAV-ALL-c. Above about 2200 m almost all of the scav-enged aerosol mass is replenished by aerosol regeneration upon evaporation.
num-Table 6. Ratios of the aerosol number concentration of “regenerated” particles (Nreg, difference between AP and SCAV-ALL), the total
aerosol number concentration in simulation AP (Ntotal), the number concentration of “regenerated” particles potentially acting as CCN
(NregCCN, difference between AP and SCAV-ALL), the number concentration of CCN in simulation AP (NtotalCCN) and the number concentration of “missing particles due to scavenging” (Nscav, difference between SCAV-ALL and CTL) of the sensitivity studies of the cold case. The
values are averaged horizontally between 680 and 720 km at 300 and 2000 m altitude.σ∗denotes the simulations with the M7 standard deviations. The first two lines describe the analyzed cold case.
RHsurface Altitude Aerosol initialization Nreg/Ntotal NregCCN/NtotalCCN Nreg/Nscav
90 % 300 m polluted summer 0.21 0.57 0.04 2000 m polluted summer 0.18 0.38 0.36 85 % 300 m polluted summer 0.17 0.36 0.04 2000 m polluted summer 0.24 0.48 0.49 80 % 300 m polluted summer 0.19 0.47 0.07 2000 m polluted summer 0.28 0.49 0.57 90 %,σ∗ 300 m polluted summer 0.21 0.57 0.04 2000 m polluted summer 0.18 0.38 0.36 90 % 300 m clean winter 0.03 0.55 0.03 2000 m clean winter 0.02 0.31 0.09 80 % 300 m clean winter 0.01 0.26 0.05 2000 m clean winter 0.05 0.43 0.27
Figure 16. Vertical profile of the total aerosol mass density af-ter 10 h (a) upstream (averaged between 510 and 530 km) and
(b) downstream (averaged between 680 and 720 km) of the first mountain for the cold cloud cases. Dotted horizontal lines indicate altitudes at which cumulative aerosol size distributions are com-piled.
ber at 300 m altitude is even more pronounced in simula-tion SCAV-ALL-c where the modified below-cloud scav-enging parameterization, in-cloud collision scavscav-enging and scavenging of contact IN remove the major part of unac-tivated aerosol particles from the atmosphere. A compari-son with the non-precipitating warm-phase cloud suggests that an important part of the scavenging is due to the more detailed below-cloud scavenging by sedimenting snow par-ticles. At an altitude of 2000 m, below-cloud scavenging and activation scavenging become less important. The dif-ferences between AP and SCAV-ALL illustrate the impact of regenerated aerosol particles on the background aerosol
Figure 17.Cumulative aerosol(a)number and(b)mass size distri-bution after cloud passage after 10 h for the cold cloud cases. The values are averaged horizontally between 680 and 720 km at 300 m altitude.
Figure 18.Cumulative aerosol(a)number and(b)mass size distri-bution after cloud passage after 10 h for the cold cloud cases. The values are averaged horizontally between 680 and 720 km at 2000 m altitude.
Figure 19.Number concentration of(a)cloud droplets and(b)ice crystals in simulation AP-c and difference between simulation AP-c and SCAV-ALL-c in(c)cloud droplet number concentration and(d)ice crystal number concentration after 10 h over the second mountain. Black lines indicate the potential temperature (K) and red lines the temperature (K). Only part of the computational domain is shown.
that large Aitken- and accumulation-mode particles are re-leased to the atmosphere. Newly formed Aitken-mode par-ticles have an increased size and mass as compared to the background Aitken-mode particles. The log-normal distribu-tion of the Aitken mode is shifted towards larger size and appears as a bump on the left-hand side of the accumulation-mode size distribution. At 300 m altitude few coarse-accumulation-mode particles are formed which appear in the aerosol mass distri-bution.
As aerosol particles serve as CCN and/or IN, changes in the aerosol number and mass size distribution may impact the number concentration of cloud droplets and ice crystals as shown in Fig. 19. The cloud droplet number and ice crys-tal number concentrations over the second mountain in sim-ulation AP-c are displayed in Fig. 19a and b, differences between simulations AP-c and SCAV-ALL-c are shown in Fig. 19c and d. The released aerosol particles in AP-c lead to an increase in cloud droplet number concentration as com-pared to SCAV-ALL-c. The ice crystal number concentration reveals a comparable increase as more cloud droplets and also more aerosol particles are available for heterogeneous freezing processes. However, these changes in the number concentrations do not impact the cloud liquid and ice water content noticeably.
Sensitivity tests
Several sensitivity test were carried out in order to evalu-ate the uncertainties of the results. We conducted simulations
The results show that the cloud and the aerosol regime play an important role for aerosol regeneration and its impact on the background aerosol population. For precipitating clouds, the analyzed altitude is a determining factor.
5 Summary and conclusions
The effects of warm-phase and mixed-phase orographic clouds on the aerosol population have been evaluated by sim-ulating orographic cloud formation over a 2-D double-bell-shaped topography with the regional weather forecast and climate model COSMO-Model. An explicit treatment of in-hydrometeor aerosol mass allowing for the consideration of aerosol processing in clouds has been implemented in the model. Aerosol scavenging processes and aerosol processing in clouds including aerosol regeneration upon evaporation or sublimation affect the aerosol population greatly. In this pa-per, different aerosol cycles have been identified. In the sim-ulated non-precipitating warm-phase cloud, aerosol mass is incorporated in cloud droplets by activation scavenging and released back to the atmosphere upon cloud droplet evap-oration. In the simulated precipitating mixed-phase cloud, a significant amount of aerosol mass can be found in cloud droplets and snowflakes, but less in ice crystals. Activation and below-cloud scavenging efficiently transfer aerosol mass into the cloud droplets and snowflakes, while ice crystals are formed heterogeneously from a few cloud droplets allowing for only a limited transfer of aerosol mass. In the mixed-phase clouds, two aerosol cycles were identified. A first cycle includes activation scavenging and cloud droplet evaporation due to the WBF process. A second cycle includes the inter-actions with snowflakes and is connected to the first cycle via the riming process which transfers aerosol from cloud droplets to snowflakes. As aerosol particles are transported together with the sedimenting hydrometeors, a vertical redis-tribution of the aerosol number and mass concentration oc-curs with aerosol mass being transported towards lower alti-tudes or even being removed from the atmosphere. Precipi-tating snow in the lower atmosphere very efficiently removes aerosol number and mass from the atmosphere.
The present study shows that the different scavenging pa-rameterizations and the consideration of aerosol regenera-tion modify the total aerosol number and mass and also the shape of the aerosol size distributions. Accounting for aerosol processing in clouds, the scavenged aerosol particles are partly replenished by the release of aerosol particles upon hydrometeor evaporation/sublimation. The released aerosol particles mainly add to the Aitken and accumulation mode. Depending on the simulated cloud, the formation of coarse-mode aerosol particles can be observed at specific altitudes. The newly generated large coarse-mode particles are possi-ble candidates for giant cloud condensation nuclei (GCCN) which may lead to rapid rain formation in warm-phase clouds (Saleeby et al., 2009; Posselt and Lohmann, 2008). This in
turn would impact the precipitation rate and the longevity of the cloud. However, the current model does not include any specific treatment of GCCN which would allow one to study the impact of these particles in more detail. The re-lease of internally mixed aerosol particles in the accumula-tion and coarse modes increases the number concentraaccumula-tion of possible CCN in the model impacting further cloud for-mation. The simulations show that aerosol regeneration in-creases the cloud droplet number concentration at the sec-ond mountain with possible implications for the ice crystal number concentration. In comparison to the standard model version, the aerosol activation and below-cloud scavenging processes revealed to be most important reducing the aerosol number concentration and in turn the cloud droplet number concentration at the second mountain. An influence on the ice crystal number concentration is observable via the changes in cloud droplet number concentration. In-cloud collision scav-enging mainly affects the Aitken mode without any impor-tant implications for cloud droplet formation in warm-phase clouds. Due to collision processes, insoluble aerosol parti-cles, which potentially may act as ice nuclei in the contact mode, are removed from the free atmosphere limiting the ef-ficiency of contact freezing. However, in the present mixed-phase clouds this effect remains negligible.
Changes in the cloud droplet and ice crystal number con-centration potentially affect the formation of precipitation in the model. However, in the present setup of non-precipitating warm-phase clouds, the increase in cloud droplet number concentration does not imply any important changes for the rain formation over the second mountain. In a precipitat-ing cloud however, the formation of a greater number but smaller-sized cloud droplets may impede rain formation, as autoconversion and collision efficiencies may be reduced. The influence of the variations in cloud droplet and ice crys-tal number concentration on the ice water content in the sim-ulated mixed-phase clouds remains negligible. Most of the ice is formed via the Wegener–Bergeron–Findeisen process which effectively adds water vapor to the ice crystals. Due to the high efficiency of this process in the present setup, the number of preexisting ice particles appears to be non-relevant for the total ice water content.
The present study focuses on the influence of aerosol processing in warm-phase and mixed-phase clouds on the aerosol population over two idealized 2-D bell-shaped moun-tains. A subsequent study should investigate the implications of the modified aerosol spectrum on further cloud formation in a 3-D regional study. Special emphasis should be placed on precipitation formation and the governing cloud micro-physical processes.
Acknowledgements. We thank the reviewers for valuable