IMPACT OF INFORMATION
TECHNOLOGY (IT) INVESTMENTS ON
THE COST EFFICIENCY OF INDIAN
BANKING SECTOR - A STOCHASTIC
FRONTIER APPROACH (SFA)
S. T. Surulivel 1, B. Charumathi 21
Senior Asst. Professor, School of Management SASTRA University, Thanjavur, Tamilnadu, India
E-mail: surulivel_st@yahoo.com
2
Associate Professor, Department of Management Studies (DMS) School of Management, Pondicherry University
Pondicherry, Tamilnadu, India
Abstract
This research study explores the Cost efficiency of Indian banking sector by employing Stochastic Frontier Approach (SFA). This paper empirically evaluated the impact of Information Technology (IT) on the Cost efficiency of the Indian banks .The present study is based on panel data over the period of 2009-2013. For this paper 77 banks of India are being considered. This paper identifies the average cost efficiency of Indian banks found to be 61 percent over the entire period of study.
The findings of this paper suggest that to some extent IT impact the cost efficiency of Indian banks. There is significant difference among Indian banks on their cost inefficiency in bank-wise. There is no significant difference among Indian banks on their cost inefficiency in year-wise. The difference in cost inefficiency between the best and worst performance banks is significantly reduced by 78.8% for the study period by Information technology investments. Thus, Information Technology contributes to cost efficiency to Indian banking industry.
Keywords: Information Technology (IT), Indian Banks, Cost efficiency, Stochastic Frontier Approach (SFA), cost efficiency.
JEL Classification: M15, L25 AND G21. INTRODUCTION
Banking system is the backbone of any economy. The growth of various banking technologies changed the nature and functioning of commercial banks all over the world.
Banking technology is defined as the information and communication technologies used by banks to provide various services to its customers in a secure and reliable way in an electronic platform. In India, the IT has brought uprising in the functioning of the banks. The level and utilization of IT depends upon the investment in technology.
Banks in India have been investing and continued to invest enormous amount of funds on computer and related technologies expecting substantial payoff. In the present day rigorous banking environment, a cost benefit analysis of the investments in IT is bound to be a difficult exercise.
It has been a question whether investments in IT provides efficiency in banking performance. Many scholars failed to identify the relationship between higher IT Investment by banks and their efficiency. So they coined the term “IT Productivity Paradox”.
Frontier efficiency is tool to measure the performance of the banks. If a bank capable of producing a same level output with minimizing the inputs, achieve the cost advantage. It is known as cost efficiency. Cost efficiency is a measurement indicates how efficiently a bank can reduce its cost. Sometimes, IT provides cost efficiency to the banks because it can reduce the operating expenses in the long run.
This research paper explores the cost efficiency of Indian banking sector using a Stochastic Frontier Approach (SFA). This paper empirically evaluated the impact of Information Technology (IT) on the cost efficiency of the Indian banking sector .The present study is based on panel data over the period of 2009-2013.
OBJECTIVES OF THE STUDY
This paper consists of the following objectives:
1. To identify the variables influencing cost efficiency of Indian banks. 2. To measure the cost efficiency of various banks in India.
3. To compare the cost efficiency of banks in bank-wise and year-wise.
HYPOTHESIS
H01: Among the bank groups operating in India, there is no significant difference in the H01a : bank-wisecost efficiency
H01b : year-wisecost efficiency LITERATURE REVIEW
Rai et al. (1997) identified that IT investments influence the business performance positively.
Lee and Menon (2000) found that higher investment in IT contribute higher efficiency. They employed non parametric approach to analyze the performance of hospitals.
Shao and Lin (2001) identified IT had impact on efficiency. The authors investigated the impact of IT investments to the performance of 370 firms and concluded that there is a impact of IT towards the performance of the firms.
Simon H. Kwan (2004) identified cost efficiency of banks in Hong Kong. He used the SFA and found that the efficiency of banks was in between 16 percent to 30 percent.
Namchul Shin (2006) identified the importance of business value of IT in relation to strategic firm performance to reduce the cost of coordinating business resources across multiple markets.
William et al. (1991) examined technological changes and its impact on output for U.S. commercia1 banks. They suggested that technological change can lower the real costs by 1% per year.
Costas Lapavitsas and Paulo L. Dos Santos (2008) identified the money transaction cost reduced due to investment in IT.
Shirley J. Ho and Sushanta K. Mallick (2008) examinedthat IT can improve efficiency of banks in two ways. The two ways are known as cost effect and network effect. Baker and Berenblum (1996), identified IT is one of the important factor decides the success or failure of organizations.
Morrison and Berndt (1990) identified marginal IT investments provided negative impact to efficiency . They also found that compared to cost, the benefit is lesser and thus provided negative contribution to efficiency.
Kaparakis et al(1994) found the significant negative correlation between cost efficiency and size of the bank and significant positive correlation between efficiency and the ratio of capital to total assets.
Meeusen and vanden Broeck (1977) and Aigner, Lovell and Schmidt (1977) provided the fundamental model of stochastic frontier approach. They applied SFA in many studies related to cost efficiency in the banks
Jeffrey et al. (2007) recommended to include off-balance-sheet (OBS) activities in the cost efficiency measurement. Altinkemer, Kemal, Ozdemir, Zafer (2006) investigate the reengineering of companies by Information Technology (IT) in their business processes improved their productivity .
Claudia Girardone et al(2004) analyzed the cost efficiency of banks in Italy. They used a Fourier-flexible(FF)model of stochastic cost function to estimate the cost efficiency. They found cost inefficiency decreased over the study period.
Laurent Weill (2009) employed three efficiency approaches SFA, DFA and DEA. The authors measured the cost efficiency of banks and found some similarities exist between the approaches.
Sealey and Lindley (1977) introduced variables (Input and Output) for intermediation approach. The output variables are Y1 = loans, Y2 = investment. The inputs are prices of labor, physical capital and borrowed funds.
RESEARCH METHODOLOGY
This study is an empirical study to identify the Information Technology (IT) impact to cost efficiency of Indian banks. Cost efficiency is measured using the translog cost function and employed stochastic cost frontier approach. A panel data were used and the sample includes 77 banks in India.
Cost inefficiency was estimated by using Frontier 4.1. To estimate the cost function the Maximum Likelihood (ML) estimator is used. The likelihood ratio test is used to identify the suitability of a cost function.
For the estimation of the cost function and thus measuring the cost efficiency of banks, the below relationship has to be assumed.
ln Cit = f(yit,, wit,; β )+ eit --- (1)
where
Cit = Total cost of bank i,
yit,= Natural logarithm of the output, wit= Natural logarithm of input prices,
β = The unknown parameter to be estimated.
eit is a one-sided error term . The error term is used to measure effects of inefficiency. The general assumption is, eit is half normally distributed.
Translog cost function is used for efficiency estimation in many studies. The translog cost function was first introduced by Cristensen et al. (1971). Hence, this study used translog cost function in the place of standard production model.
For the definition of input and output variables ,this study use intermediation approach consider three inputs (labour, deposits and physical capital) and two outputs (loans and Investments).
This study used three basic inputs for the banking sector . The input prices are defined as
P1= Input Price of labour (Salaries and employee benefits/ the total number of the employees)
P2 = Input Price of deposit (Total interest expenses of deposits/ saving deposits+ other deposits) and
P3 = Input Price of Physical capital (Physical capital expenses/Physical capital)
The outputs used include loans & advances and investment. Where Y1 = Loans and Advances; Y2 =
Investment.
The stochastic translog cost model is expressed as follows:
it it N 1 n M 1 m m n pm yn N 1 n N 1 l M 1 m M 1 k k m pk pm l n yl yn M 1 m m pm N 1 n n yn 0
U
V
p
y
p
p
y
y
2
1
p
y
C
+
+
β
+
β
+
β
+
β
+
β
+
β
=
= = = = = = = =---(2)
Whereyn = N outputs in logs
pm= Prices of the M inputs in logs.
Standard symmetry and linear homogeneity conditions are imposed. For simplicity notations ‘i’(for bank) and‘t’ (for time) have been omitted in the model.
Uit is the cost inefficiency measures indicates how the costs of a bank ‘i’ at time‘t’ are to the banks on
the cost efficient frontier, producing the same output. Vit stands for the usual error term.
The variables for analyzing the If U
it = zero,
Ci*(Frontier Cost Function) = f (yi, xi, β) and () of bank CE (Cost efficiency)= CE = C
i/ Ci* = f (yi, xi, β) exp (Uit)/ f (yi, xi, β) CE = exp (U
Cost inefficiency estimation from OLS, is then regressed with Information Technology (IT) investment by maximum likelihood model.(Technical efficiency) is as:
U
it = Δ0 + Δ1 Z it + e it (4)
Here
Δ0 =Intercept;
Δ
1 =maximum likelihood regression Coefficient;
Z it =IT investment by the bank i and the year t; and
e
it is a error term.
TABLE – 1 Input and Output Variables
Variable Variable name Definition
C Total costs Interest expenses and operating expenses
Π Pretax Profit Income before taxation
OUTPUT VARIABLES
Y1 Loans and Advances Loan
Y2 Investments Investments
PRICES OF INPUT OF VARIABLES
P1 Input Price of labour
Salaries and employee benefits/ the total number of the employees
P2 Input Price of deposit
Total interest expenses of deposits/ saving deposits+ other deposits
P3 Input Price of Physical capital Physical capital expenses/Physical capital REGRESSION VARIABLE(ML estimation)
Z Information Technology Investment in ITVarious Expenses involved Note : Variables identified and grouped by the researchers.
Frontier efficiency is tool to measure the performance of the banks. If a bank capable of producing a same level output with minimizing the inputs, achieve the cost advantage. It is known as cost efficiency. Cost efficiency is a measurement indicates how efficiently a bank can reduce its cost. Sometimes, IT provides cost efficiency to the banks because it reduces the operating expenses in the long run.
COST EFFICIENCY OF TOTAL INDIAN BANKING INDUSTRY
Table 2 provides SFA -Cost Translog Estimatesfor totalBanking Industry. For total banking industry, 77 banks are considered. The negative sign in the significant coefficients indicate that, the respective variables try to reduce the cost inefficiency. So, the respective variables increase the cost efficiency of banks.
The Input and Output variables which increased the cost efficiency of banks are:
Loans and Advances [-6.332 (-2.155)** significant at 5 %] indicate that banks are effectively handling their loan portfolio for the period 2009-2013, Deposits [-5.15(-3.724)* significant at 1 %]indicate the Interest expenses are reduced significantly even though there is an increase in deposits of banks for the period 2009-2013. The Deposit is increased by 117.749 %. This reduction is due to interest rate reduction.
The Input and Out put variables which reduced the cost efficiency of Indian banks are:
Labour [5.358 (2.049) ** significant at 5 %] indicate the labour expenses are increased significantly which leads to cost inefficiency in banks for the study period. This is due to the increase in the Number of Employee. For total banking industry , Number of Employees is increased by 9.88 % for the study period.
Physical capital [6.796(6.636)* significant at 1 %] indicate the rent, insurance and maintenance expenses are increased significantly which leads to cost inefficiency in banks for the period.
Table 2
SFA -COST TRANSLOG ESTIMATES -TOTAL BANKING INDUSTRY
VARIABLES VARIABLES
OLS CORRECTED OLS COEFFICIENT
ML
COEFFICIENT t
VALUE COEFFICIENT t VALUE
beta0 Intercept 0 0.004 -0.196 -0.162 -3.635*
beta1 Y1 -2.601 -0.552 -2.601 -6.332 -2.155**
beta2 Y2 -1.832 -0.378 -1.832 -2.444 -1.345
beta3 P1 10.542 2.301** 10.542 5.358 2.049**
beta4 P2 -3.562 -1.578 -3.562 -5.15 -3.724*
beta5 P3 11.068 2.287** 11.068 6.796 3.636*
beta6 Y1*Y1 4.781 1.541 4.781 4.581 3.469*
beta7 Y1*Y2 1.212 0.356 1.212 -0.967 -0.951
beta8 Y2*Y2 0.429 0.124 0.429 1.575 2.38**
beta9 P1*P1 -2.236 -0.628 -2.236 -2.518 -2.52**
beta10 P1*P2 -0.088 -0.952 -0.088 -0.045 -0.602
beta11 P1*P3 -4.567 -1.003 -4.567 -0.067 -0.044
beta12 P2*P2 1.908 1.573 1.908 2.686 3.643*
beta13 P2*P3 -0.234 -1.086 -0.234 -0.291 -2.173*
beta14 P3*P3 -0.073 -0.028 -0.073 -2.956 -2.759*
beta15 Y1*P1 -4.824 -1.503 -4.824 -0.36 -0.247
beta16 Y1*P2 -0.086 -0.351 -0.086 0 -0.002
beta17 Y1*P3 -3.14 -1.042 -3.14 -1.221 -1.248
beta18 Y2*P1 3.341 0.952 3.341 0.113 0.088
beta19 Y2*P2 0.088 0.35 0.088 0.046 0.22
beta20 Y2*P3 -2.86 -0.694 -2.86 0.807 0.582
delta0 -4.282 -4.985*
delta1 -0.788 -13.003*
sigma-squared 0.085 0.119 1.766 7.54*
Gamma 0.51 0.987 347.614*
log likelihood function
-60.49 -23.64
LR test of the one-sided error
73.7
Note : Computed using FRONTIER 4.1
* 1% significance level, ** 5 % significance level, *** 10% significance level
The log –likelihood function for full stochastic model where inefficiency is assumed to be half-normal is calculated to be -23.64 and the value for OLS function is -60.49, which is less than the full frontier model. LR test statistics for testing the absence of the technical inefficiency effect from the frontier is calculated to be 73.7. This value is significantly higher than the critical value (2.706 at 5% level of significance, Kodde and Palm (1986) for df equal to 1).
The sigma-square is 1.766 and significant at 1% level, indicating the correctness of the specified assumptions of the distribution of the composite error term. The gamma value is 0.987 and significant at the 1% level. It is an indication that 98.7 % variation in output is attributed to bank specific technical inefficiency and remaining 1.3 % variation in out put is attributed to noise.
The variation in cost efficiency seems to have narrowed over time, as represented by the delta values. The difference in cost inefficiency between the best and worst performance banks is significantly reduced by 78.8% for the study by Information technology investments. This result may be due may be a result of more emphasis being placed on cost efficiency and the effective deployment of technology in banking such as ATMs in place of the more expensive brick and mortar structures.
it should be. For natural log, the most cost efficient firm will have a value of 1, the farther the value from 1, the most cost inefficient the firm is.
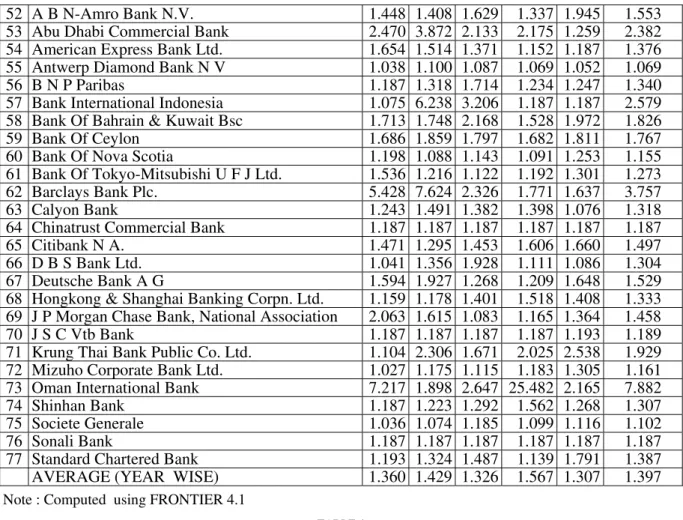
TABLE 3
COST INEFFICIENCY ESTIMATE OF TOTAL BANKING INDUSTRY
SL. NO
NAME OF THE BANK
COST INEFFICIENCY ESTIMATE AVERAGE (BANK
WISE) 2005 2006 2007 2008 2009 1 Allahabad Bank 1.070 1.078 1.128 1.117 1.186 1.116 2 Andhra Bank 1.129 1.101 1.127 1.172 1.229 1.152 3 Bank of Baroda 1.124 1.133 1.155 1.196 1.246 1.171 4 Bank of India 1.079 1.098 1.129 1.169 1.168 1.129 5 Bank of Maharashtra 1.125 1.120 1.126 1.136 1.143 1.130 6 Canara Bank 1.108 1.145 1.156 1.197 1.163 1.154 7 Central Bank of India 1.128 1.107 1.111 1.145 1.130 1.124 8 Corporation Bank 1.129 1.118 1.135 1.142 1.142 1.133 9 Dena Bank 1.102 1.167 1.168 1.165 1.166 1.154 10 Indian Bank 1.079 1.080 1.116 1.122 1.177 1.115 11 Indian Overseas Bank 1.104 1.101 1.125 1.178 1.250 1.152 12 Oriental Bank of Commerce 1.077 1.107 1.165 1.249 1.206 1.161 13 Punjab and Sind Bank 1.192 1.112 1.137 1.144 1.137 1.145 14 Punjab National Bank 1.086 1.132 1.248 1.122 1.194 1.156 15 Syndicate Bank 1.101 1.110 1.134 1.190 1.271 1.161 16 UCO Bank 1.091 1.120 1.148 1.194 1.219 1.154 17 Union Bank of India 1.088 1.116 1.154 1.121 1.142 1.124 18 United Bank of India 1.099 1.082 1.087 1.082 1.110 1.092 19 Vijaya Bank 1.068 1.129 1.122 1.123 1.276 1.144
20 State Bank Of Bikaner & Jaipur 1.175 1.162 1.190 1.207 1.312 1.209 21 State Bank Of Hyderabad 1.092 1.088 1.135 1.132 1.126 1.114 22 State Bank Of India 1.112 1.166 1.180 1.129 1.147 1.147
23 State Bank Of Indore 1.076 1.206 1.187 1.173 1.274 1.183
24 State Bank Of Mysore 1.134 1.176 1.146 1.193 1.154 1.160
52 A B N-Amro Bank N.V. 1.448 1.408 1.629 1.337 1.945 1.553 53 Abu Dhabi Commercial Bank 2.470 3.872 2.133 2.175 1.259 2.382 54 American Express Bank Ltd. 1.654 1.514 1.371 1.152 1.187 1.376 55 Antwerp Diamond Bank N V 1.038 1.100 1.087 1.069 1.052 1.069 56 B N P Paribas 1.187 1.318 1.714 1.234 1.247 1.340 57 Bank International Indonesia 1.075 6.238 3.206 1.187 1.187 2.579 58 Bank Of Bahrain & Kuwait Bsc 1.713 1.748 2.168 1.528 1.972 1.826
59 Bank Of Ceylon 1.686 1.859 1.797 1.682 1.811 1.767
60 Bank Of Nova Scotia 1.198 1.088 1.143 1.091 1.253 1.155 61 Bank Of Tokyo-Mitsubishi U F J Ltd. 1.536 1.216 1.122 1.192 1.301 1.273 62 Barclays Bank Plc. 5.428 7.624 2.326 1.771 1.637 3.757
63 Calyon Bank 1.243 1.491 1.382 1.398 1.076 1.318
64 Chinatrust Commercial Bank 1.187 1.187 1.187 1.187 1.187 1.187 65 Citibank N A. 1.471 1.295 1.453 1.606 1.660 1.497 66 D B S Bank Ltd. 1.041 1.356 1.928 1.111 1.086 1.304 67 Deutsche Bank A G 1.594 1.927 1.268 1.209 1.648 1.529 68 Hongkong & Shanghai Banking Corpn. Ltd. 1.159 1.178 1.401 1.518 1.408 1.333 69 J P Morgan Chase Bank, National Association 2.063 1.615 1.083 1.165 1.364 1.458 70 J S C Vtb Bank 1.187 1.187 1.187 1.187 1.193 1.189 71 Krung Thai Bank Public Co. Ltd. 1.104 2.306 1.671 2.025 2.538 1.929 72 Mizuho Corporate Bank Ltd. 1.027 1.175 1.115 1.183 1.305 1.161 73 Oman International Bank 7.217 1.898 2.647 25.482 2.165 7.882
74 Shinhan Bank 1.187 1.223 1.292 1.562 1.268 1.307
75 Societe Generale 1.036 1.074 1.185 1.099 1.116 1.102
76 Sonali Bank 1.187 1.187 1.187 1.187 1.187 1.187
77 Standard Chartered Bank 1.193 1.324 1.487 1.139 1.791 1.387
AVERAGE (YEAR WISE) 1.360 1.429 1.326 1.567 1.307 1.397
Note : Computed using FRONTIER 4.1
TABLE 4
Analysis of Variance (Bank-wise)
Source of
Variation SS Df MS F F crit
Between banks
276.6131 76
3.63964644 2.4187 1.328
Within banks463.469513 308 1.50477114
Total
740.0826429
384
Note : Computed using SPSS 16.0
Table 4, gives the results based on ANOVA test. As the calculated value is (2.4187) higher than that the table value (1.328), the null hypothesis (H01a) is rejected. Thus, , there is significant difference among
Indian banks on their cost inefficiency in bank-wise.
TABLE – 5
Analysis of Variance (Year -wise)
Source of Variation SS Df MS F F crit
Between the Year
3.45863
4
0.8646
0.4518 2.3951
Within the Year
736.6684 385
1.91342
Total
740.127 389
Note : Computed using SPSS 16.0
Table 5 gives the results based on ANOVA test. As the calculated value is (0.45189) lesser than the table value (2.3951), the null hypothesis (H01b) is accepted. Thus, there is no significant difference among
RESULT AND DISCUSSION
This paper identifies the average cost efficiency of Indian banks found to be 61 percent over the entire period of study. The findings of this paper suggest that to some extent IT impact the cost efficiency of Indian public sector banks.
Loans and Advances [-6.332 (-2.155)** significant at 5 %] indicate that banks are effectively handling their loan portfolio for the period 2009-2013.
Deposits [-5.15(-3.724)* significant at 1 %]indicate the Interest expenses are reduced significantly even though there is an increase in deposits of banks for the period 2009-2013.
The Deposit is increased by 117.749 %. This reduction is due to interest rate reduction.
Labour [5.358 (2.049) ** significant at 5 %] indicate the labour expenses are increased significantly which leads to cost inefficiency in banks for the study period. This is due to the increase in the Number of Employee. For total banking industry , Number of Employees is increased by 9.88 % for the study period.
Physical capital [6.796(6.636)* significant at 1 %] indicate the rent, insurance and maintenance expenses are increased significantly which leads to cost inefficiency in banks for the period.
There is significant difference among Indian banks on their cost inefficiency in bank-wise. There is no significant difference among Indian banks on their cost inefficiency in year-wise
The difference in cost inefficiency between the best and worst performance banks is significantly reduced by 78.8% for the study period by Information technology investments. Thus, Information Technology contributes to cost efficiency to Indian banking industry.
BIBLIOGRAPHY
[1] Aigner, D. J., Lovell, C. A. K. and Schmidt, P. (1977), “Formulation and Estimation of Stochastic Frontier Production Function Models,”Journal of Econometrics, 6(1), July, 21-37.
[2] Allen N. Berger (2003), “The Economic Effects of Technological Progress: Evidence from the Banking Industry “ Journal of Money, Credit and Banking, Vol. 35, No. 2 (Apr., 2003), pp.141-176
[3] Altinkemer, Kemal; De, Prabuddha; and Ozdemir, Zafer (2006) "Information Systems and Health Care XII: Toward a Consumer-to-Healthcare Provider (C2H) Electronic Marketplace," Communications of the Association for Information Systems: Vol. 18, Article 19. Available at: http://aisel.aisnet.org/cais/vol18/iss1/19
[4] Altunbas Y., Liu M.H., Molyneux P. and Seth R. (2000). "Efficiency and Risk in Japanese Banking", Journal of Banking and Finance 24, 1605--1628.
[5] Barbara Casu & Claudia Girardone, (2005). "An analysis of the relevance of off-balance sheet items in explaining productivity change in European banking," Applied Financial Economics, Taylor and Francis Journals, vol. 15(15), pages 1053-1061, October.
[6] Jeffrey A. Clark; Thomas F. Siems, "X-Efficiency in Banking: Looking beyond the Balance Sheet”,Journal of Money, Credit and Banking, Vol. 34, No. 4. (Nov., 2002), pp. 987-1013.
[7] Kaparakis, E., S. Miller and A. Noulas (1994): “Short-Run cost Inefficiency of Commercial Banks: A Flexible Stochastic Frontier Approach”, Journal of Money, Credit and Banking 26, 875-893.
[8] Lapavitsas, Costas and Dos Santos, Paulo L, Globalization and Contemporary Banking: On the Impact of New Technology (2008). Contributions to Political Economy, Vol. 27, Issue 1, pp. 31-56, 2008. Available at SSRN: http://ssrn.com/abstract=1153220 or doi:bzn005
[9] Lee, B., and Menon, N. M. “Information Technology Value through Different Normative Lenses,” Journal of Management Information Systems (16:4), 2000, pp. 99-119.
[10] Meeusen, W. and van den Broeck, J. (1977), “Efficiency Estimation from Cobb-Douglas Production Functions with Composed Error,” International Economics Review, 18 (2), June, 435-444.
[11] Morrison, C., and E. Berndt. 1990. "Assessing the Productivity of Information Technology Equipment in the US Manufacturing Industries." Working Paper No. 3582 (January). Cambridge, MA: National Bureau of Economic Research.
[12] Namchul Shin ,”The impact of information technology on the financial performance of diversified firms”, Decision Support Systems 41 (2006) 698– 70.
[13] Rai, A., Patnayakuni, R., and Patnayakuni, N. (1997), “Technology Investment and Business Performance,” Communications of the ACM, 40 (7), 89-97.
[14] Sealey C. and Lindley J. (1977). "Inputs, Outputs, and a Theory of Production and Cost at Depository Financial Institutions", Journal of Finance 32, 1251—1266.
[15] Shao, B. B. M. and Lin, W. T (2001), “Measuring the Value of Information Technology in Technical Efficiency with Stochastic Production Frontiers,” Information and Software Technology, 43, 447-456.
[16] Shirley J. Ho and Sushanta K. Mallick ,”The Impact of Information Technology on the Banking Industry: Theory and Empirics” Queen Mary, University of London, UK
[17] Simon H. Kwan, 2001. "The X-efficiency of commercial banks in Hong Kong," Working Papers in Applied Economic Theory 2002-14, Federal Reserve Bank of San Francisco.
[18] Simon H. Kwan, 2001. "The X-efficiency of commercial banks in Hong Kong," Working Papers in Applied Economic Theory 2002-14, Federal Reserve Bank of San Francisco.
[19] Sushanta K. Mallick & Shirley J. Ho, 2008. "On Network Competition And The Solow Paradox: Evidence From Us Banks," Manchester School, University of Manchester, vol. 76(s1), pages 37-57, 09.
[20] Weill, Laurent, (2009). "Convergence in banking efficiency across European countries," Journal of International Financial Markets, Institutions and Money, Elsevier, vol. 19(5), pages 818-833, December
[21] William C. Hunter; Stephen G. Timme”Technological Change in Large U.S.Commercial Banks”,The Journal of Business, Vol. 64, No. 3. (Jul., 1991), pp.339-362.