*UFRJ, Rio de Janeiro, RJ, Brasil Recebido 07/06/2011; Aceito 19/10/2011
Evaluating efficiency in the Brazilian
trucking industry
Peter Fernandes Wankea*
a*[email protected], UFRJ, Brasil
Abstract
The purpose of this study is to investigate the issue of efficiency in the Brazilian motor carrier industry using both DEA (Data Envelopment Analysis) and SFA (Stochastic Frontier Analysis) in a complimentary fashion. The study is based on secondary data collected from Transporte Moderno/Maiores e Melhores, a specialized magazine that annually reports statistics on the largest Brazilian trucking companies. Results corroborate not only that increasing returns to scale prevail within this industry, but also provide support for a moderate impact of economies of scope on efficiency levels. Implications in terms of mergers and acquisitions and the impact of cargo diversity and the geographical scope of the operation on virtual efficiency levels are also addressed.
Keywords
Trucking industry. Data envelopment analysis. Three-stage modeling. Stochastic frontier analysis. Mergers.
1. Introduction
The motor carrier industry occupies an important position in the movement of goods and services. Given its advantages in the areas of accessibility to points of origin and final destination, and the relatively low capital requirements for industry entry, motor carriers have overshadowed other transportation modes in terms of market share, employment, and the number of firms (ALLEN; SHAIK; ESTRADA, 2005).
Bolstered by the Plano Real economic plan and post-1994 economic stability (FLEURY; RIBEIRO, 2003), the trucking industry began to garner more attention in Brazil, one of the so-called “emerging countries” or “BRICs” (WILSON; PURUSHOTHAMAN, 2003), an acronym for Brazil, Russia, India, and China. Although Brazil has experienced significant changes in terms of market competitiveness since 1994, it is still a country strongly dependent on its motor carriers. Approximately two thirds of Brazilian firms’ transport-related expenditure is spent on trucking services (CENTRO..., 2009).
Historically, the integration of the country was based on the construction of highways, while the construction of railroads and development of
waterways was instead aimed at meeting specific projects for out flowing cargo, particularly exports from the ports. Currently, the paved highway network is around five times larger than the railroad network. When considering all types of highways, the size is over 50 times as large as the rail system. The waterway system, on the other hand, is underused due to a lack of needed investment to improve navigability (FIGUEIREDO; FLEURY; WANKE, 2003).
However, since 2008, this landscape of high supply and low prices in roadway transportation has been changing in Brazil. Economic growth has boosted the demand for transportation services, thus increasing upward pressure on roadway freight prices, and, in order to keep up with customer demands, trucking companies are starting to experience a capacity shortfall (FLEURY; HIJJAR, 2008). Brazilian trucking companies must seek alternative ways to deal with this issue, with efficiency evaluation techniques serving a fundamental role in this quest.
This paper focuses the issue of efficiency in the Brazilian motor carrier industry using both DEA (Data Envelopment Analysis) and SFA (Stochastic Frontier Analysis), the two dominant approaches to modern benchmarking (BOGETOFT; OTTO, 2010). Moving from DEA to SFA, there are some main distinguishing features. In terms of methods, the DEA approach has its roots in mathematical programming, whereas the SFA approach is much more directly linked to econometric theory. Given that, while the slack analysis of DEA provides insight for increasing or reducing input resources to improve efficiency scores, the SFA method focuses on the economic justification of a given production function and subjecting it to further hypothesis testing (LIN; TSENG, 2005). Besides, SFA is a parametric approach, thus implying some advantages and disadvantages over DEA, mainly related to the assumption of a stochastic relationship between the inputs used and the output produced.
Specifically, DEA, developed over 30 years ago (COOK; SEIFORD, 2009), is considered to be a powerful tool for measuring efficiency, above all for its capacity to simultaneously process multiple inputs and outputs, thereby aiding managers in decision-making. In conjunction with multivariate data analysis techniques, DEA enables the impact of contextual variables on efficiency levels to be measured (COOPER; SEIFORD; TONE, 2007). On the other hand, although SFA handles only one output each time, it is possible to adapt the techniques developed for the estimation of a stochastic production frontier in the single-output case to the estimation of a stochastic output distance function in the multiple-output case. One possibility is to consider the dependent variable y as the reciprocal of the norm of the output vector.
Nevertheless, it is worth taking note of the increasing use of SFA in conjunction with DEA in order to gain additional insights regarding the randomness of the deviations of efficiency scores. Although some authors, like Schmidt (1985), consider DEA and SFA to be mutually exclusive techniques, other authors, like Ferrier and Lovell (1990), Fried et al. (2002), and Cooper, Seiford and Tone (2007), suggest they can be used in complementary fashion. This is
particularly useful when one wants to avoid what Charnes, Cooper and Sueyoshi (1988) referred to as methodological bias. In other words, DEA and SFA can be used to cross-check each other under an analytical procedure that may encompass two or three stages (COOPER; SEIFORD; ZHU, 2004; YANG, 2006). In this research, DEA is used in three stages. In stage one, to calculate efficiency scores. Stage two incorporates DEA results in the form of dependent variables into the corresponding regression. In conjunction with multivariate data analysis techniques, DEA enables the impact of contextual variables on efficiency scores. In stage three, some analytics derived in stages one and two are carried over the SFA modelling.
As previously mentioned, the Brazilian trucking industry is the focus of this paper. Its objectives are twofold. First, to establish a diagnostic on its (managerial) efficiency levels and returns-to-scale conditions, accounting for the effects of size and scope. Second, to evaluate the mergers and acquisitions potential, identifying the scope drivers for higher levels of efficeincy. To this end, a review of the literature was carried out, both to characterize the sector, and to support the three-stage modelling adopted. The rest of the paper is organized as follows: Section 2 presents the DEA and SFA methodologies and summarizes the scant previous studies that applied both techniques to the trucking industry in other countries/contexts. Section 3 addresses the research questions and methodology that pertain to this paper. Section 4 presents the data analyses and the discussion of the results. Finally, Section 5 summarizes the research conclusions.
2. Literature review
2.1.
Data envelopment analysis: concepts
and applications in the trucking industry
Assume s =1..S production units, with inputs = 1
T
s s sm
x ( x ,.., x ) and outputs yTs =( y ,.., y )s1 sn .
Column vectors Xs and Ys form the sth columns of matrices X and Y. Assume further that λ = λT ( 1,..,λs)
is a non-negative vector and eT =( ,.., ) R1 1 ∈ S is
a vector of unit values. The DEA-CCR (CHARNES; COOPER; RHODES, 1978) and the DEA-BCC (BANKER; CHARNES; COOPER, 1984) are shown in Equations 1-3:
DEA-CCR Input Oriented
θ λθ
θ − λ ≥ λ ≥
λ ≥
s.t. 0
0
,
s
s min
x X
Y y (1)
DEA-BCC Input Oriented
θ λθ
θ − λ ≥ λ ≥
λ =
s.t. 0
1
,
s
s min
x X
Y y
e
(2)
DEA-BCC Output Oriented
η λη
η − λ ≤ λ ≤
λ =
s.t. 0
1
,
s
s max
y Y
X x
e
(3)
Given a set of DMU inputs and outputs under the CCR model, DEA determines for each DMU a measure of efficiency obtained as a ratio of weighted outputs to weighted inputs. Compared with the stochastic parametric frontier approach, DEA imposes neither a specific functional relationship between production outputs and inputs, nor any assumptions on the specific statistical distribution of the error terms (CULLINANE et al., 2006). An efficient frontier is on the boundary of a convex polytope created in the space of inputs and outputs, and in which each vertex is an efficient DMU (DULÁ; HELGASON, 1996). Another feature of DEA is that the relative weights of the inputs and the outputs do not need to be known a priori; that is, these weights are determined as part of the solution of the linear problem (ZHU, 2003).
Because of the efficient frontier’s geometry, DEA results rely heavily on the set of inputs and outputs used. The greater the number of variables (inputs and
outputs) in the DEA, the less discerning the analysis is (JENKINS; ANDERSON, 2003). This fact means that the variable selection process is highly constrained.
Given the large number of initial potential variables to be considered for DEA, a number of methods have been proposed that suggest limiting the number of variables relative to the number of DMUs (WAGNER; SHIMSHAK, 2007). Techniques proposed include i) judgmental screening by experts, in order to indicate the most relevant variables for the DEA model (GOLANY; ROLL, 1989); ii) regression analysis, in order to indicate highly correlated variables as redundant (LEWIN; MOREY; COOK, 1982); iii) the application of DEA to reduced models, in order to rank the effect of variables on efficiency scores (WAGNER; SHIMSHAK, 2007); iv) the use of multi-criteria approaches for weighting variables (MIRANDA; ALMEIDA, 2004); and v) the addition of a virtual target into the sample to identify changes in the adherence of a given DMU to the frontier (BERECHMAN; ADLER, 1999).
Of particular relevance in this respect are data reduction techniques. Specifically, Adler and Golany (2001) and Adler and Berechman (2001) employed principal component analysis to reduce the number of inputs and outputs prior to implementing DEA. The use of factor analysis was proposed by Vargas and Bricker (2000) and implemented in Jenkins and Anderson (2003) and Nadimi and Jolai (2008).
Besides estimating efficiency scores, DEA also provides other information relevant to the inefficient DMUs. DEA identifies the efficient facet being used for comparison, the combination of the inputs that are being inefficiently used, and the deviation of specific outputs from the efficient level. It should be noted that efficient DMUs tend not to present any slack, such information being available only to inefficient DMUs (GREEN; DOYLE; COOK, 1996; LIN; TSENG, 2007).
Scale inefficiency is due to increasing or decreasing returns to scale, which can be computed by inspecting the sum of the weights under the CCR model specification. If the sum is equal to one, the law of constant returns to scale prevails; however, if the sum is less than one or more than one, increasing returns to scale and decreasing returns to scale prevail, respectively, assuming an input-oriented model. Also according to Cooper, Seiford and Tone (2007), in order to identify the degree to which the inefficiency of a DMU is due to inefficient operations or to its scale efficiency, scale efficiency is computed using the ratio
The approaches to the statistical treatment of the variations in the scores produced using DEA have evolved over the course of the years - see, for example Banker (1993) and Simar and Wilson (2007). As a depiction of this evolution, Cooper, Seiford and Tone (2007) point to the growing number of studies that combine the results of DEA, in a first stage, with regression analysis, in a second stage. According to Fried et al. (2002), such two-stage DEA approaches are the fruit of recognition, on the part of researchers, that environmental factors or contextual variables can significantly influence efficiency scores. For example, according to those authors, managerial competence (or incompetence) is insufficient to explain individual variations in efficiency, given that environmental factors, contextual variables, or even statistical noise could influence measured performance. The adequate control for these impacts might suggest possible paths for a DMU to become more efficient (see, for example, SOUZA et al., 2007).
The examination of the roots of inefficiency based on DEA scores may be conducted by means of Tobit regression or cluster analysis.
In the first case, Gillen and Lall (1997) and Turner, Windle and Dressner (2004), for example, used Tobit regression as a means of examining productivity in airports and seaports, respectively. When attempting to explain differences in DEA scores through regression analysis, the dependent variable is continuous, but truncated at 1. As a result, OLS regression is not appropriate, as its use will lead to inconsistent estimates. In such situations, a Tobit regression is suggested as an appropriate approach (MADDALA, 1983).
More recently, as a methodological note regarding inferences drawn from DEA scores, it should be mentioned that Souza and Staub (2007) extended the results of Banker (1993), showing that inference problems with the two-stage DEA approach, as raised by Simar and Wilson (2007), are not general. In fact, DEA-based procedures using Tobit regression in the second stage perform as well as the best of the parametric methods in the estimation of the impact of contextual variables on productivity (BANKER; NATARAJAN, 2008). It should also be noted that the use of non-parametric tests, such as those presented in Banker and Natarajan (2004) and Gomes et al. (2009), constitute an alternative used just as commonly as Tobit regressions in similar situations.
With respect to cluster analysis, different clustering approaches are found in the literature. For example, Sarkis and Talluri (2004) present a clustering procedure based on the results of DEA solutions. On the other hand, Sharma and Yu (2008) cluster input variables based on the Kohonen Self-Organizing Map
(KOHONEN, 1982). Clustering efficiency measures can help in identifying patterns of similar units for a better understanding of the relative efficiency analysis in specific DMU subsets. This approach can be used to confirm possible sources of inefficiencies under a broader perspective (SARKIS; TALLURI, 2004).
Although DEA has already been satisfactorily employed in other segments that are logistics-related – such as third-party logistics (MIN; JOO, 2006; HAMDAN; ROGERS, 2007; SENRA et al., 2007; ZHOU et al., 2008; WANKE; AFFONSO, 2011), airline industry (SCHEFCZYK, 1993), airports (MELLO, 2003; PACHECO; FERNANDES, 2003; BARROS et al., 2010; FONSECA et al., 2010; SILVEIRA; MEZA; MELLO, 2011), road passenger transport (ODECK; ALKADI, 2001; NOVAES; SILVEIRA; MEDEIROS, 2010), container terminals (WANG; SONG; CULLINANE, 2002; TURNER; WINDLE; DRESSNER, 2004; MIN; PARK, 2005) - studies that discuss the application of DEA in the trucking industry are scarce. Some logistics-related segments are given next.
Specifically concerning the trucking industry, Odeck and Hjalmarsson (1996) and Hjalmarsson and Odeck (1996) initially demonstrated the usefulness of DEA as a tool for evaluating the efficiency of trucks involved in road construction and maintenance production processes in Norway. Meja and Corsi (1999) conducted DEA analysis to assess a motor carrier’s safety process, showing how this technique might be useful to carriers, regulators, and shippers. Poli and Scheraga (2001) ran DEA models to identify the causes of inefficiencies in maintenance strategies. Their impact on firms’ quality rating performance was also analyzed. More recently, Weber and Weber (2004) used DEA to estimate efficiency and productivity measures in the US trucking and warehousing industry during the years 1994-2000, accounting for both desirable and undesirable outputs (fatalities). The authors found that traditional techniques of estimating efficiency that ignore traffic fatalities bias estimates of efficiency and total factor productivity growth.
2.2.
Stochastic frontier analysis: concepts
and applications in the trucking industry
of n inputs used by the producer, TEi denotes the technical efficiency, defined as the ratio of observed output to maximum feasible output, and Vi is a stochastic component.
The production technology transforming the input vector x into an output denoted by y can be either represented by the log-linear Cobb-Douglas and the Translog (transcendental logarithmic) stochastic functions, respectively given by (ALLEN; SHAIK; ESTRADA, 2005; LIN; TSENG, 2005):
0 1 n
i i i
i
ln( y ) ln( x )
=
= β +∑β ⋅ (4)
0
1 1 2 1 1
n n n
i i i i , j i j
i i j
ln( y ) ln( x ) ln( x ) ln( x )
= = =
= β +∑β ⋅ + ⋅∑ ∑β ⋅ ⋅ (5)
It is possible to adapt the techniques developed for the estimation of a stochastic production frontier in the single-output case to the estimation of a stochastic output distance function in the multiple-output case. One possibility is to consider the dependent variable y as the reciprocal of the norm of the output vector (KUMBHAKAR; LOVELL, 2003).
A frequent assumption with respect to the production function in SFA is the appropriateness of the log-linear Cobb-Douglas case, since it is the most fundamental production frontier function used in several deterministic and stochastic models (see, for instance, Kumbhakar and Lovell (2003): pages 66, 72, and 77). The log-linear Cobb-Douglas function was also considered as a basic assumption by other authors, such as Cullinane and Song (2003) and Cullinane et al. (2006), when studying the technical efficiency of containerports, and Allen, Shaik and Estrada (2005), when assessing the efficiency of agribusiness trucking companies.
The log-linear Cobb-Douglas is, in point of fact, a special case of the Translog function when
βi,j=0 (ASLAM, 2000). Also, a generalization of the Cobb-Douglas function is the so-called CES (Constant Elasticity of Substitution) production function (NICOLA, 2008). Although there is one additional and very common production function in literature, the Leontief (fixed coefficients) function, it should be pointed out that this production function is only of historical interest, since in real world economies, every commodity can be produced at least by a finite set of production techniques (NICOLA, 2008).
Cullinane and Song (2003, 2006) suggest that SFA would have a strong policy and economic orientation, especially in terms of assessing alternative industrial organizations and in evaluating the efficiency of government and other public agencies. On the other
hand, mathematical programming approaches such as DEA would have a much greater managerial decision-making orientation, since the analysis of the slacks reveals the next steps to be taken in order to increase efficiency, as suggested by Green, Doyle and Cook (1996) and Lin and Tseng (2007).
In addition, SFA has been used to cross-check with DEA results, which is particularly useful when one wants to avoid what Charnes, Cooper and Sueyoshi (1988) referred to as methodological bias. In such cases, the use of SFA is motivated by the idea that the deviations from the production function may not be simply random noise. This means that the productive inefficiency may make a more important contribution to the variability of the total error in the model than the random noise component (KUMBHAKAR; LOVELL, 2003). Although SFA can show that deviations in efficiency are not purely random, it does not indicate whether these deviations occur due to an uncontrollable exogenous component or due to contextual variables. Therefore, additional testing on its efficiency scores is required.
Other authors have made attempts to combine SFA and DEA. Bhattacharyya, Lovell and Sahay (1997) use SFA to explain variations in calculated DEA efficiencies in order to analyze relative efficiencies of Indian commercial banks. Fried et al. (2002) and Avkiran and Rowlands (2008) use SFA to decompose each variable of the DEA model according to managerial efficiency, environmental effects, and statistical noise.
Before proceeding, it is worth commenting that international, peer-reviewed papers dealing with the application of SFA in the trucking industry are even scarcer. This shortcoming, however, suggests a void to be filled. A search at Proquest Database with the terms “trucking industry” or “motor carrier” and “stochastic frontier” returned only one paper (McMULLEN; LEE, 1999). This paper compared cost efficiency in the US motor carrier industry, both before and after deregulation in 1980. Unionization was found to be the most important determinant of inefficiency in both periods, with its negative impact being stronger in the deregulated industry.
3. Research questions and methodology
Considering the picture presented in Section 1 as a whole, the current status of the Brazilian trucking industry raises three major research questions. They are as follows:
• Is there any potential for improvement in the
efficiency of the Brazilian trucking industry?
• Are the efficiency levels within different trucking
as economies of scale (size) and economies of scope (diversity of cargo and geographic scope of operations)?
• What are the implications of both research questions
in terms of mergers and acquisitions for the Brazilian trucking industry, and how do economies of scope impact on the efficiency levels of possible mergers?
First, DEA was performed assuming constant and variable returns to scale, under both input and output orientations, in order to allow an initial comparison of efficiency scores. Then, subsequent analyses were focused on input-oriented BCC scores. An input-orientation was preferred here since the output-increasing potential, unlike the input-saving potential, should be interpreted with more care, unless there is demand for it (ODECK; ALKADI, 2001). In addition to this, Cullinane, Song and Wang (2005) point out that the productive output of a given logistics system tends to be fairly predictable in the short and medium terms, favoring, thus, the adoption of input-oriented measures.
Given the scalable nature of the inputs considered in this research – number of branches, employees, fleet size, and fuel consumption, all of them further detailed next section – it was assumed that they can be varied at the discretion of management, that is, managers can exert control over them during the course of time. So, traditional DEA models – previously presented in Equations 1-3 were used. The use of BCC input-oriented scores allowed the determination of three clusters from original trucking companies: efficient/constant returns to scale; inefficient/decreasing returns to scale; and inefficient/increasing returns to scale. In sequence, a slack analysis was conducted in order to map opportunities to improve efficiency in these three clusters, either by increasing outputs or by reducing inputs.
Effects of economies of scale and economies of scope on efficiency levels were tested by means of multivariate data analysis. In particular, factor analysis was conducted to determine a capacity index (as a proxy for size) for each company, based on their inputs. This capacity index was used as a regressor in order to determine whether or not economies of scale are present up to a certain production level in the Brazilian trucking industry. Then, factor analysis was conducted again to determine a cargo scope index and a geographic scope index, in order to account, respectively, for the type of cargo diversity and the geographical scope of the transport operation of each company. These indices were also used as regressors to measure the impact of economies of scope on efficiency scores, that is, to evaluate whether diversification is superior to specialization in the Brazilian trucking industry.
Input and output variables were further tested by means of SFA in order to cross-check with DEA results. SFA was also used as a cornerstone tool to assess the impact of possible mergers and acquisitions on efficiency scores. Mergers have always been thought of as a powerful tool for restructuring in competitive survival situations. In light of the returns to scale characteristic of the Brazilian trucking industry, we will hypothetically merge two original companies into a virtual one and evaluate changes in efficiency based upon the original SFA function. Although we are assuming that the efficient frontiers of generated virtual companies will not fluctuate sharply because of outliers, we decided to generate as many virtual companies as possible from the original sample, following Grosskopf and Yaisawarang (1990).
In light of the foregoing, an exhaustive analysis testing all 2 by 2 possible merger combinations from original companies led to the determination of three major clusters of virtual companies: those where the new efficiency scores ranged below the minimal scores determined from each pair of original companies; those where the new efficiency scores ranged above the maximal scores; those where the new efficiency scores ranged in between minimal and maximal original scores. These three clusters of virtual companies were reexamined by means of multinomial logistics regression, where possible sources of inefficiency were tested in order to discriminate them.
4. Data analysis and discussion of results
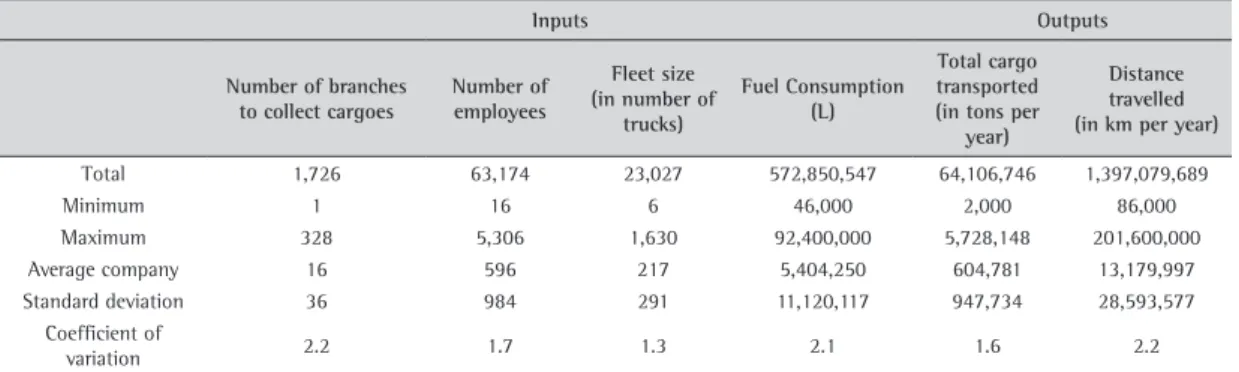
The data used in this research was obtained from the ranking of the 121 largest Brazilian trucking companies listed in Transporte Moderno/Maiores e Melhores (July, 2009), a specialized Brazilian magazine focused on the motor carrier industry. All data relate to the year 2008 and provide information on different inputs (fleet size, number of employees, fuel consumption, and number of branches to collect cargoes) and outputs (total cargo transported [in tons per year] and distance travelled [in kilometers per year]).
Although the data set provided by Transporte Moderno/Maiores e Melhores might not have been collected in the context of a theoretical model, a theoretical model can still be identified and applied to the research process and data that are theoretically consistent can be identified (ZILL; DALY, 1993; MORIARTY et al., 1999). The importance of this step in secondary analysis cannot be underestimated (SHEPARD et al., 1999). As with any quantitative method of research, selection of the variables to be studied must first involve combining through the model to identify critical concepts. The theoretical concepts are then matched with appropriate variables form the data set.
So, correlation analyses were performed, indicating significant positive relationships between the four inputs and the two outputs variables, which are, therefore, isotonic and justified to be included in the model (WANG; LU; TSAI, 2011). Similarly, in order to check on the possibility of reducing the number of outputs to be considered into the analysis, a correlation analysis was performed again, testing upon the output pair. Since the serial correlation is relatively low (0.37), both outputs were kept into the analysis.
Beginning with 121 companies in the Transporte Moderno/Maiores e Melhores database, we wound up with 106 comparable trucking companies – all of them with more than 20 employees – after excluding those with incomplete or inaccurate information. According to Wanke and Fleury (2006), since there are 2,926 registered motor carrier companies with more than 20 employees operating in Brazil, it is possible to say that this final sample corresponds to a share of 3.6% of this specific stratum. If alternative criteria were used to evaluate this sample size of 106 companies, results of similar magnitude would be obtained. Along with CNT (National Transport Confederation – www.cnt.org.br), the total amount of cargo transported by trucks in Brazil during 2008 was 1,174 billion tons, implying a share of 5.5% for these 106 major companies. CNT also provides data
regarding the total number of trucks operating in Brazil (339,865 in 2008). Compared with the total fleet size of these 106 companies on that date (23,027), it follows that they owned 6.8% of the national truck fleet. Lastly, data provided by ANTT with respect to total fuel consumption by motor carrier transportation (approximately 8.7 billion liters in 2008) suggest that these 106 companies represent 6.6% of this total amount.
The list of variables used in this study and relevant descriptive statistics are given in Table 1.
The ranking also provided information on contextual variables for each company, such as cargo diversity (liquid, chemical and petrochemical, container, refrigerated, fragile, large, live animals, expedited, etc.) and the geographical scope of the transport operation (geographic Brazilian regions [South, Southeast, North, Northeast, and Central-West] and different South-American countries [Argentina, Paraguay, Uruguay, Chile, Bolivia, Peru, Venezuela, and Colombia]). All of these variables were coded as dummies. It should be noted that expedited cargo is seminally related to expedited shipping, which is, by definition, the process of shipping at a faster rate than normal.
As regards the analysis conducted, the four inputs and two outputs collected were simultaneously analyzed and compared via the traditional CCR (CHARNES; COOPER; RHODES, 1978) and BCC (BANKER; CHARNES; COOPER, 1984) models. The computation of the scale efficiency for each company enabled the identification of three major clusters: efficient/constant returns to scale, inefficient/decreasing returns to scale, and inefficient/increasing returns to scale. However, with respect to the determination of the returns to scale condition for each DMU, readers should be aware of the fact that scale inefficiency at a given DMU can be assessed under both constant and varying returns-to-scale models. According to Cooper, Seiford and Tone (2007), while the constant returns-to-scale model simultaneously evaluates returns to scale and
Table 1. Sample descriptive statistics (N = 106).
Inputs Outputs
Number of branches to collect cargoes
Number of employees
Fleet size (in number of
trucks)
Fuel Consumption (L)
Total cargo transported (in tons per
year)
Distance travelled (in km per year)
Total 1,726 63,174 23,027 572,850,547 64,106,746 1,397,079,689
Minimum 1 16 6 46,000 2,000 86,000
Maximum 328 5,306 1,630 92,400,000 5,728,148 201,600,000
Average company 16 596 217 5,404,250 604,781 13,179,997
Standard deviation 36 984 291 11,120,117 947,734 28,593,577
Coefficient of
technical inefficiency, the varying returns-to-scale model separately evaluates technical efficiency and returns to scale. The fact that different frontier assumptions may lead to different returns-to-scale conclusions, is well-discussed in literature (see, for instance, ZAREPISHEH; KHORRAM; JAHANSHAHLOO, 2010; RAY, 2010; BANKER; NATARAJAN, 2004). This happens due to different projections of a given DMU on different return-to-scale regions at each efficient frontier assumption.
4.1.
Efficiency results derived from DEA
models
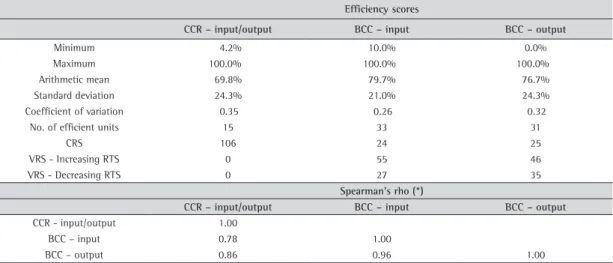
Without precise information on the returns to scale of the production function, two sets of results (one for the CCR and one for the BCC model) are presented in order to analyze the efficiency of Brazilian trucking industry. The software Banxia Frontier Analyst 4 was employed for solving these DEA models. The summary results of the input and output-oriented efficiency measures for both CCR and BCC models, as well as the Spearmans’ rank correlation between them, are presented in Table 2.
As one would expect, the CCR model yields lower average efficiency estimates than the BCC models. In other words, the CCR model identifies fewer efficient trucking companies (15 out of 106) than do the BCC models (33 for the input-oriented and 31 for the output-oriented model). This result is not surprising: the CCR model fits a linear, or constant returns to scale, production technology, whereas the BCC models feature variable returns to scale, which, besides purely technical limits, are more flexible and reflect technical efficiency. Note that the Spearman’s
rank order correlations are high, thus indicating that the performance measure does not vary significantly by model orientation or returns-to-scale assumption. In other words, from an efficiency perspective, these specifications produce approximately the same results in the Brazilian trucking industry. However, the BCC input-oriented scores were chosen as analytical cornerstones, instead of the CCR ones, so as to further cross-check them with the SFA scores. These models both rely upon some common assumptions: varying returns-to-scale and existence of managerial inefficiency (BOGETOFT; OTTO, 2010).
Considering the results for the BCC input-oriented model, the majority (55 out of 106) of the Brazilian trucking companies analyzed seem to be experiencing increasing returns to scale, 27 decreasing returns to scale, and the other 24, constant returns to scale. Increasing returns to scale indicates that trucking company capacity is too small in relation to the tasks it performs. This implies that the trucking company would be more efficient had capacity been greater.
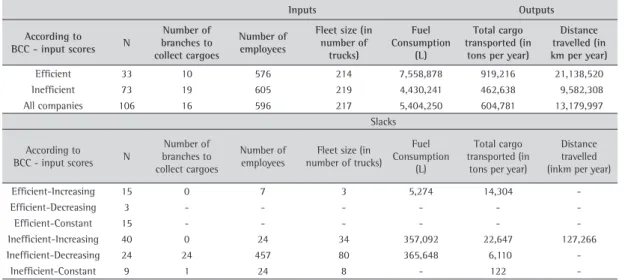
Table 3 depicts the average efficient and inefficient trucking company and presents a slack analysis based on Green, Doyle and Cook (1996) and Lin and Tseng (2007). According to the BCC-input scores, one can easily see that the average inefficient company produces proportionally less and, therefore, consumes less fuel, than the average efficient company. The slacks reveal a great potential for efficiency improvement in the Brazilian trucking industry, particularly regarding the number of employees and the fleet size. As expected, this potential tends to be larger in inefficient companies (where decreasing returns to scale prevail) and smaller in weakly efficient companies (where increasing or decreasing returns to scale prevail). The average trucking company, however, as indicated in
Table 2. Model comparison.
Efficiency scores
CCR – input/output BCC – input BCC – output
Minimum 4.2% 10.0% 0.0%
Maximum 100.0% 100.0% 100.0%
Arithmetic mean 69.8% 79.7% 76.7%
Standard deviation 24.3% 21.0% 24.3%
Coefficient of variation 0.35 0.26 0.32
No. of efficient units 15 33 31
CRS 106 24 25
VRS - Increasing RTS 0 55 46
VRS - Decreasing RTS 0 27 35
Spearman’s rho (*)
CCR – input/output BCC – input BCC – output
CCR - input/output 1.00
BCC – input 0.78 1.00
BCC – output 0.86 0.96 1.00
Table 4, presents decreasing returns to scale (scale index = 1.5), thus indicating that the distribution of the scale indicator is skewed to the right, since its median is equal to 0.86.
4.2.
Economies of scale
Another research question is related to the impact of economies of scale in the Brazilian trucking industry. In order to make the concept of size operational, a capacity index was developed based on the three inputs most clearly related to the size of the firm: number of branches, number of employees, and fleet size. First, factor analysis with Varimax standardized rotation was conducted in order to reduce these three inputs into a single capacity index. Specifically, factor analysis is an appropriate procedure to build indices based on observed variables and an existing theoretical construct (HAIR; ANDERSON; TATHAM, 1998). In this case, the theoretical construct is the size of the trucking company, as captured by the capacity index.
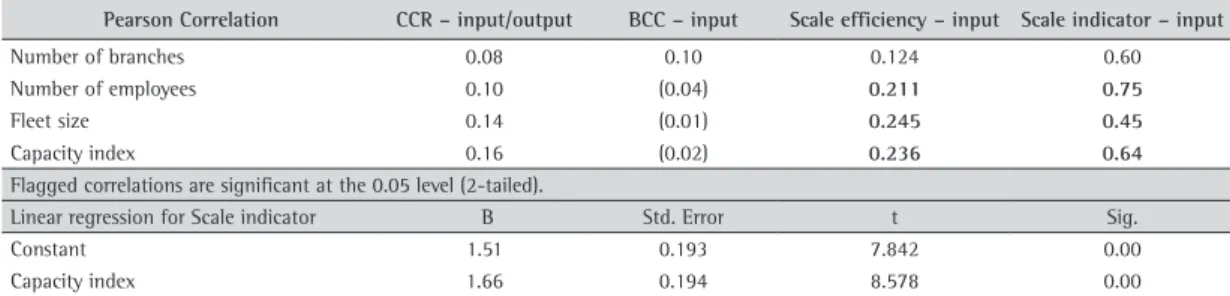
The results for the factor analysis are presented in Table 5, and all factor loads are greater than 0.50. The capacity index, calculated from the standardized inputs, varies from 0.70 to 4.90, with zero mean and standard deviation equal to one. Strong evidence of increasing returns to scale for smaller companies is presented in Table 6. The coefficient of correlation between the scale indicator and the capacity index is high (0.64) and significant at the 0.01 level. The estimated trend line using a linear specification produced significant results with an R-squared value of 0.409. Increasing returns to scale prevails in companies with a capacity index smaller than -0.31
(-0.51/1.68). The conclusions confirm the findings of previous studies, such as Odeck and Alkadi (2001), that economies of scale are present up to a certain production level.
4.3.
Economies of scope
In this section, we use the scores obtained for the BCC-input model to determine whether diversification is superior to specialization within the Brazilian trucking industry. In other words, DEA results are used to determine whether type of cargo diversity is
Table 3. Average efficient and inefficient company and slack analysis.
Inputs Outputs
According to BCC - input scores N
Number of branches to collect cargoes
Number of employees
Fleet size (in number of
trucks)
Fuel Consumption
(L)
Total cargo transported (in
tons per year)
Distance travelled (in km per year)
Efficient 33 10 576 214 7,558,878 919,216 21,138,520
Inefficient 73 19 605 219 4,430,241 462,638 9,582,308
All companies 106 16 596 217 5,404,250 604,781 13,179,997
Slacks
According to
BCC - input scores N
Number of branches to collect cargoes
Number of
employees number of trucks)Fleet size (in
Fuel Consumption
(L)
Total cargo transported (in
tons per year)
Distance travelled (inkm per year)
Efficient-Increasing 15 0 7 3 5,274 14,304
-Efficient-Decreasing 3 - - -
-Efficient-Constant 15 - - -
-Inefficient-Increasing 40 0 24 34 357,092 22,647 127,266
Inefficient-Decreasing 24 24 457 80 365,648 6,110
-Inefficient-Constant 9 1 24 8 - 122
-Table 4. Scale efficiency and scale indicator.
Scale efficiency Scale indicator
Input Output Input Output
Minimum 11% 18.8% 0.01 0.03
Maximum 100% 100% 18.5 42.2
Arithmetic mean 86% 91% 1.5 2.3
Standard deviation 20% 13% 2.6 4.8
No. of efficient units 15 15 24 25
Table 5. Capacity índex.
Factor loads
Number of branches 0.60
Number of employees 0.92
Fleet size 0.86
Descriptives (N = 106)
Minimum (0.7)
Maximum 4.9
Average company 0.0
Arithmetic mean 0.0
Standard deviation 1.0
related to higher levels of efficiency. To make the type of cargo diversity an operational concept, a cargo scope index was developed, based on nine contextual variables obtained from the Transporte Moderno database. These are binary variables (1 = yes; 0 = no) that indicate the type of cargo diversity for each company: (1) liquid, (2) chemical and petrochemical, (3) container, (4) refrigerated, (5) fragile, (6) large, (7) live animals, (8) expedited and (9) other.
An extraction of factors from these nine variables related to scope was, once again, conducted by means of exploratory factor analysis with Varimax standardized rotation. Results presented in Table 7 are only for load factors greater than 0.50 and eigenvalues greater than 1. According to Tabachnik and Fidell (2001, p. 645), only factor loads greater than 0.50 merit analysis, and in such cases, the variable is said to represent a good factor measure.
Thus, four main factors represent the type of cargo diversity, interpreted as follows:
• Variables liquid, chemical and petrochemical, and
container make up factor 1, simply interpreted as containerized or bulk cargo;
• Variables refrigerated and fragile make up factor 2,
simply interpreted as refrigerated or fragile cargo;
• Variables large and live animals make up factor 3,
which was interpreted similarly to the previous two factors; and
• Lastly, variables expedited or other types of cargo
make up factor 4.
The cargo scope index, used as a regressor for the BCC-input scores, was calculated as a simple linear combination of these four factors and varies from -2.5 to 5.8. According to Table 8, the results for the Tobit regression between the efficiency scores and the cargo scope index indicate modest evidence in favor of economies of scope in the Brazilian trucking industry. Although results were significant, economies of scope derived from the transportation of different types of cargo explained only 11% of total variation in efficiency scores.
As regards the impact of geographical scope on efficiency, the same approach was conducted with different geographic Brazilian regions (South, Southeast, Northeast, Central-West, and North) and different South-American countries (Argentina, Paraguay, Uruguay, Chile, Bolivia, Peru, Venezuela,
Table 6. Effect of size (economies of scale).
Pearson Correlation CCR – input/output BCC – input Scale efficiency – input Scale indicator – input
Number of branches 0.08 0.10 0.124 0.60
Number of employees 0.10 (0.04) 0.211 0.75
Fleet size 0.14 (0.01) 0.245 0.45
Capacity index 0.16 (0.02) 0.236 0.64
Flagged correlations are significant at the 0.05 level (2-tailed).
Linear regression for Scale indicator B Std. Error t Sig.
Constant 1.51 0.193 7.842 0.00
Capacity index 1.66 0.194 8.578 0.00
F = 73.59/Sig. < 0.0001. Adjusted R Squared = 0.409.
Table 7. Factor loads for cargo scope.
Factor 1 - Containerized or bulk cargo
Factor 2 - Refrigerated or fragile cargo
Factor 3 - Large or live animals
Factor 4 - Expedited or other types of cargo
Liquid 0.72 Refrigerated 0.81 Large 0.75 Expedited 0.78
Chemical and
petrochemical 0.61 Fragile 0.72
Live
animals 0.66 Other 0.77
Container 0.59
Scope índex
Minimum 5.8
Maximum (2.5)
Arithmetic mean
-Standard deviation 2.0
Extraction method: Principal Component Analysis with Varimax Rotation. Total variance explained = 64.55%. KMO = 0.65/Chi-squared = 217.7/Sig < 0.0001.
Table 8. Effect of scope on efficiency (economies of scope).
Tobit regression for BCC – input scores B Std. Error B/Std. Error Sig.
(Constant) 0.850 0.03 30.133 0.00
ScopeIndex 0.045 0.01 3.148 0.00
and Colombia) served by these trucking companies. Similarly, all of these are binary variables, available, for each company, at the Transporte Moderno database. They represent the geographical scope of the transport operation. Three factors were extracted with Varimax rotation (KMO = 0.662/Chi-Squared = 527.3/Sig. < 0.0001/Total variance explained = 65.6%). Only load factors above 0.50 were considered for interpretation: (1) Mercosur countries plus Chile and Bolivia; (2) All Brazilian regions, except for Southeast, where 65% of the GDP is concentrated; (3) Venezuela, Peru, and Colombia (Amazonian countries). The use of a geographic scope index as a regressor for efficiency, however, did not produce significant results.
4.4.
Efficiency results derived from SFA
models
We now use stochastic frontier regressions to cross-check with DEA-BCC results. Inspired by the two-stage approach described in Arnold, Bardhan and Cooper (1996), we first use DEA to identify the technically efficient and inefficient DMUs, as well as their scale efficiency condition, mapping all possible combinations. Then, we incorporate these results in the form of dummy variables in the corresponding OLS and MLE regressions. This is accomplished as follows:
• Technical Efficiency = 1, if a DMU is identified as
100% technically efficient in stage one, 0, otherwise.
• Scale Efficiency = 1, if a DMU is identified as 100%
scale efficient in stage one, 0, otherwise.
Thus, if these variables are equal to zero, there is no effect on the calculated efficiency scores. On the contrary, however, they are augmented.
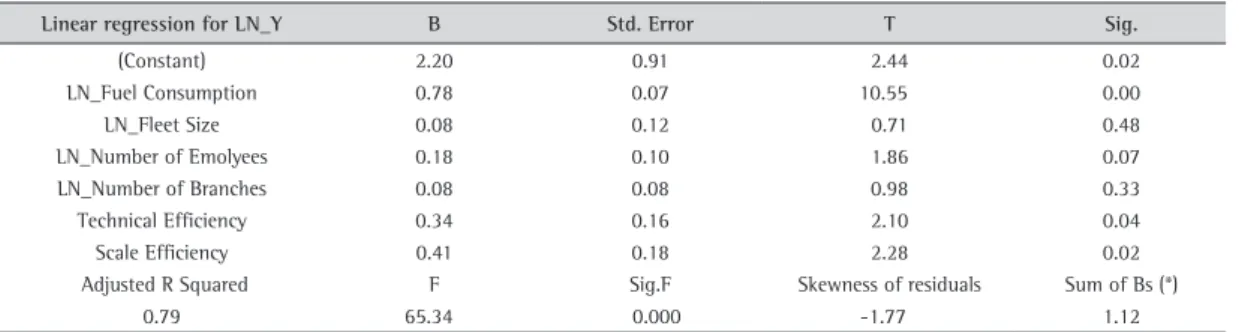
For the application of the stochastic frontier regressions, the appropriateness of the log-linear Cobb-Douglas and Translog cases is assumed. The latter, however, did not produce significant results, and is omitted. The estimation of the OLS regression was conducted using the SPSS 15.0 statistical package. Considering y - the reciprocal of the norm of the output
vector - as the dependent variable, results presented in Table 9 indicate not only good explanatory power, but also the correct skewness of the residuals for the implementation of the MLE procedure.
The estimated OLS coefficients provide a starting point for the MLE process. A quick inspection of Table 9 indicates that: (a) increasing returns to scale prevails within this production function, as the sum of the coefficients of the independent variables is greater than 1; (b) scale efficiency makes a more important contribution to the efficiency scores than technical efficiency, after submitting data to an initial treatment by DEA.
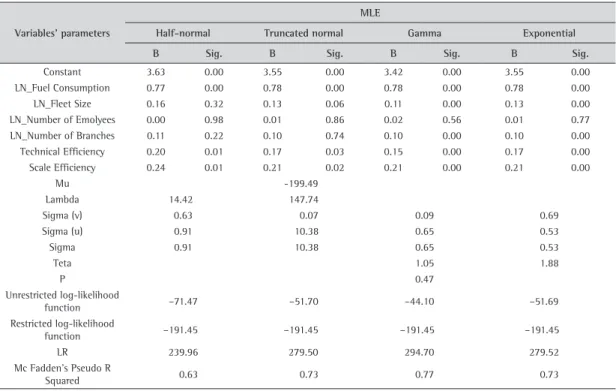
Without the possibility of any a priori justification of a specific assumption vis-à-vis the inefficiency component, all four of the assumptions allowed by LIMDEP 9.0 (GREENE, 2007) are examined: half-normal, truncated normal, exponential, and gamma distributions. Their results are presented in Table 10. In most cases, the MLEs under the four alternative inefficiency distributions yielded parameters that are close to one another. If a strong rank correlation between the pairs of efficiency estimates under these assumptions is true, Ritter and Simar (1997) argue for the use of a relatively simple distribution, such as half-normal, rather than a more flexible distribution, such as truncated normal or gamma. However, because this is not the case, we advocate in favor of the gamma premise since the rank correlation coefficient between its scores and the original DEA-BCC scores is maximal (0.60) when compared to the other three assumptions.
Under the gamma assumption, the sum of the coefficients of the independent variables is slightly greater than one, thus suggesting increasing returns to scale. Overall model fit was good (Mc Fadden’s Pseudo R-Squared = 0.77), and scale efficiency consistently produced a more significant impact than technical efficiency on SFA scores. The stochastic regression under gamma assumption has, therefore, successfully cross-checked the results obtained from DEA analysis.
Table 9. Ordinary least squares.
Linear regression for LN_Y B Std. Error T Sig.
(Constant) 2.20 0.91 2.44 0.02
LN_Fuel Consumption 0.78 0.07 10.55 0.00
LN_Fleet Size 0.08 0.12 0.71 0.48
LN_Number of Emolyees 0.18 0.10 1.86 0.07
LN_Number of Branches 0.08 0.08 0.98 0.33
Technical Efficiency 0.34 0.16 2.10 0.04
Scale Efficiency 0.41 0.18 2.28 0.02
Adjusted R Squared F Sig.F Skewness of residuals Sum of Bs (*)
0.79 65.34 0.000 -1.77 1.12
It is worth noting the relative variance of the two types of errors that constitute the total variation in the disturbance term. The inefficiency component u varies more widely than the uncontrollable random exogenous component v. This means that the productive inefficiency in the Brazilian trucking industry makes a more important contribution to the variability of the total error than does the random noise component within the three groups of companies.
While frontier analyses do not identify the specific causes of why inefficiency should exist, the results they provide do form the basis for an analysis of relationships between efficiency, returns to scale, and other contextual, business-related, characteristics. The type of cargo handled and the geographic regions served may individually affect the efficiency levels of the trucking companies. These variables are tested in next section, and SFA is used to assess the impact of potential mergers and acquisitions on efficiency scores.
4.5.
Assessing the impact of mergers and
acquisitions
In order to explain the three different clusters that emerged after evaluating the 5,565 possible mergers by taking the original companies 2 by 2, descriptive and multinomial logistics regression analyses were performed with SPSS 15.0. The histogram of the new efficiency scores for the 5,565 virtual companies is presented in Figure 1. One can easily perceive, as expected, their asymptotic behavior towards 1.
The purpose of the latter analysis was to assess the accurate prediction of membership in one of three categories of outcome, based on the type of cargo handled and the geographic regions served: those where the new efficiency scores ranged below the minimal scores determined from each pair of original companies; those where the new efficiency scores ranged above the maximal scores; and those where the new efficiency scores ranged in between both minimal and maximal original scores. There was a good model fit (discrimination among trucking clusters) and the comparison of log-likelihood ratios showed improvement with the addition of these independent variables.
Table 10. Frontier analysis.
Variables’ parameters
MLE
Half-normal Truncated normal Gamma Exponential
B Sig. B Sig. B Sig. B Sig.
Constant 3.63 0.00 3.55 0.00 3.42 0.00 3.55 0.00
LN_Fuel Consumption 0.77 0.00 0.78 0.00 0.78 0.00 0.78 0.00
LN_Fleet Size 0.16 0.32 0.13 0.06 0.11 0.00 0.13 0.00
LN_Number of Emolyees 0.00 0.98 0.01 0.86 0.02 0.56 0.01 0.77
LN_Number of Branches 0.11 0.22 0.10 0.74 0.10 0.00 0.10 0.00
Technical Efficiency 0.20 0.01 0.17 0.03 0.15 0.00 0.17 0.00
Scale Efficiency 0.24 0.01 0.21 0.02 0.21 0.00 0.21 0.00
Mu -199.49
Lambda 14.42 147.74
Sigma (v) 0.63 0.07 0.09 0.69
Sigma (u) 0.91 10.38 0.65 0.53
Sigma 0.91 10.38 0.65 0.53
Teta 1.05 1.88
P 0.47
Unrestricted log-likelihood
function –71.47 –51.70 –44.10 –51.69
Restricted log-likelihood
function –191.45 –191.45 –191.45 –191.45
LR 239.96 279.50 294.70 279.52
Mc Fadden’s Pseudo R
Squared 0.63 0.73 0.77 0.73
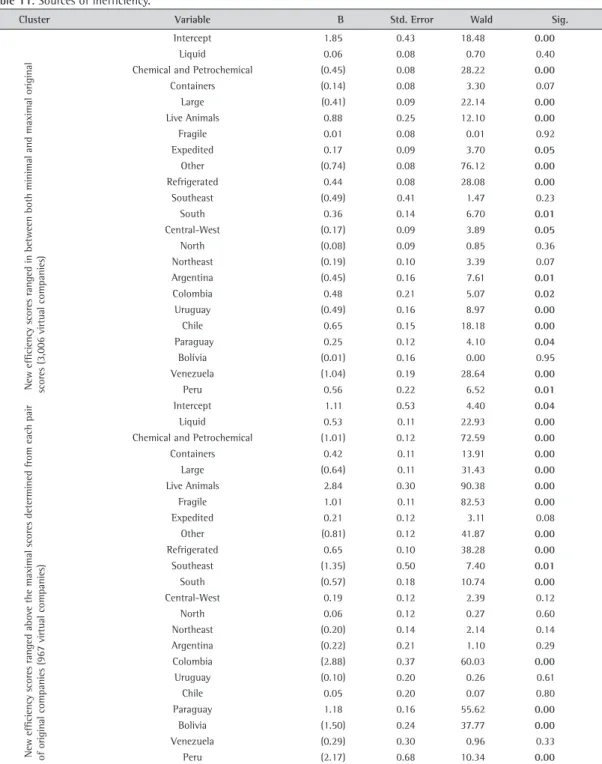
Table 11 presents the results of the multinomial logistics regression: regression coefficients, Wald statistics, and significance levels. The signs of the predictor groups indicate that virtual trucking companies, which are more efficient than their original pairs, do not carry chemical and petrochemical or large cargoes. These types of cargoes are more likely to be found within the group where virtual
efficiencies decreased below the minimal original scores. As regards the geographic regions served, virtual trucking companies that operate along routes within the Southern regions are more likely to be inefficient. Curiously, the Paraguayan route is more likely to be operated by virtual efficient companies - probably due to the well-known lack of controls and product smuggling along the border.
Table 11. Sources of inefficiency.
Cluster Variable B Std. Error Wald Sig.
New efficiency scores ranged in between both minimal and maximal original scores (3,006 virtual companies)
Intercept 1.85 0.43 18.48 0.00
Liquid 0.06 0.08 0.70 0.40
Chemical and Petrochemical (0.45) 0.08 28.22 0.00
Containers (0.14) 0.08 3.30 0.07
Large (0.41) 0.09 22.14 0.00
Live Animals 0.88 0.25 12.10 0.00
Fragile 0.01 0.08 0.01 0.92
Expedited 0.17 0.09 3.70 0.05
Other (0.74) 0.08 76.12 0.00
Refrigerated 0.44 0.08 28.08 0.00
Southeast (0.49) 0.41 1.47 0.23
South 0.36 0.14 6.70 0.01
Central-West (0.17) 0.09 3.89 0.05
North (0.08) 0.09 0.85 0.36
Northeast (0.19) 0.10 3.39 0.07
Argentina (0.45) 0.16 7.61 0.01
Colombia 0.48 0.21 5.07 0.02
Uruguay (0.49) 0.16 8.97 0.00
Chile 0.65 0.15 18.18 0.00
Paraguay 0.25 0.12 4.10 0.04
Bolívia (0.01) 0.16 0.00 0.95
Venezuela (1.04) 0.19 28.64 0.00
Peru 0.56 0.22 6.52 0.01
New efficiency scores ranged abo
ve the maximal scores determined from each pair
of original companies (967 virtual companies)
Intercept 1.11 0.53 4.40 0.04
Liquid 0.53 0.11 22.93 0.00
Chemical and Petrochemical (1.01) 0.12 72.59 0.00
Containers 0.42 0.11 13.91 0.00
Large (0.64) 0.11 31.43 0.00
Live Animals 2.84 0.30 90.38 0.00
Fragile 1.01 0.11 82.53 0.00
Expedited 0.21 0.12 3.11 0.08
Other (0.81) 0.12 41.87 0.00
Refrigerated 0.65 0.10 38.28 0.00
Southeast (1.35) 0.50 7.40 0.01
South (0.57) 0.18 10.74 0.00
Central-West 0.19 0.12 2.39 0.12
North 0.06 0.12 0.27 0.60
Northeast (0.20) 0.14 2.14 0.14
Argentina (0.22) 0.21 1.10 0.29
Colombia (2.88) 0.37 60.03 0.00
Uruguay (0.10) 0.20 0.26 0.61
Chile 0.05 0.20 0.07 0.80
Paraguay 1.18 0.16 55.62 0.00
Bolivia (1.50) 0.24 37.77 0.00
Venezuela (0.29) 0.30 0.96 0.33
Peru (2.17) 0.68 10.34 0.00
Journal of Econometrics, v. 6, n. 1, p. 21-37, 1977. http://dx.doi.org/10.1016/0304-4076(77)90052-5 ALLEN, A. J.; SHAIK, S.; ESTRADA, J. K. An assessment of
the efficiency of agribusiness trucking companies: a Data Envelopment Analysis Approach. In: SOUTHERN AGRICULTURAL ECONOMICS ASSOCIATION ANNUAL MEETINGS, 2005, Little Rock. Proceedings... Little Rock, 2005.
ARNOLD, V.; BARDHAN, I.; COOPER, W. W. New uses of DEA and statistical regressions for efficiency evaluation and estimation with an illustrative application to public secondary schools in Texas. Annals of Operations Research, v. 66, p. 255-278, 1996.
ASLAM, M. An economic analysis of the high-technology sector in the Pakistan economy: a translog cost model approach. 2000. Thesis (Doctorate)-Department of Business Administration, Bahauddin Zakariya University, Multan, Pakistan, 2000.
AVKIRAN, N. K.; ROWLANDS, T. How to better identify the true managerial performance: state of the art using DEA. Omega, v. 36, n. 2, p. 317-324, 2008. http://dx.doi. org/10.1016/j.omega.2006.01.002
BANKER, R. D. Maximum likelihood, consistency and DEA: a statistical foundation. Management Science, v. 39, p. 1265-1273, 1993.
BANKER, R. D.; CHARNES, A.; COOPER, W. W. Some models for estimating technical scale inefficiencies in Data Envelopment Analysis. Management Science, v. 30, p. 1078-1092, 1984. http://dx.doi.org/10.1287/ mnsc.30.9.1078
BANKER, R. D.; NATARAJAN, R. Statistical tests based on DEA efficiency scores. In: COOPER, W. W.; SEIFORD, L. M.; ZHU, J. (Eds.). Handbook on Data Envelopment Analysis. Boston: Kluwer International Series, 2004. p. 299-321. BANKER, R. D.; NATARAJAN, R. Evaluating contextual
variables affecting productivity using data envelopment analysis. Operations Research, v. 56, p. 48-58, 2008. http://dx.doi.org/10.1287/opre.1070.0460
BARROS, T. D. et al. Avaliação dos atrasos em transporte aéreo com um modelo DEA. Produção, v. 20, n. 4, p. 601-611, 2010. http://dx.doi.org/10.1590/S0103-65132010005000047
BERECHMAN, J.; ADLER, N. Methodology and Measurement of Airport Quality from the Airlines Viewpoint and its Effects on an Airline’s Choice of a West-European Hub Airport. The Netherlands Ministry of Transportation, Directorate General Aviation, 1999. Final Report. BHATTACHARYYA, A.; LOVELL, C.; SAHAY, P. The impact
of liberalization on the productive efficiency of Indian commercial banks. European Journal of Operational Research, v. 98, p. 332-345, 1997. http://dx.doi. org/10.1016/S0377-2217(96)00351-7
BOGETOFT, P.; OTTO, L. Benchmarking with DEA, SFA, and R. New York: Springer, 2010.
CENTRO DE ESTUDOS EM LOGÍSTICA - CEL. Panorama Logístico CEL/COPPEAD – Terceirização Logística no Brasil. Rio de Janeiro: COPPEAD/UFRJ, 2009.
CHARNES, A.; COOPER, W. W.; RHODES, E. Measuring efficiency of decision making units. European Journal of Operational Research, v. 2, p. 429-444, 1978.
CHARNES, A.; COOPER, W. W.; SUEYOSHI, T. A goal programming/constrained regression review of the Bell system breakup. Management Science, v. 34, p. 1-26, 1988.
5. Conclusions
This research used three-stage DEA models and SFA to analyze the efficiency of the largest trucking companies in Brazil. The results produced here have a number of policy implications for an industry still very fragmented among several companies, despite the economic growth witnessed in recent years and pressures for higher quality services.
Since the majority of trucking companies experience increasing returns to scale, indicating that they would be more efficient were capacity larger, consolidation of operations appears to be the natural path to achieve gains in productivity. It follows, then, that mergers and acquisitions in the Brazilian trucking industry will increase in the near future, accelerating a trend that began over a decade ago. This period of consolidation will probably be followed by higher levels of professionalization to accommodate clients’ increasingly sophisticated demands.
The fact that the positive impact of economies of scale on efficiency levels are present up to a certain size in the Brazilian trucking industry certainly suggests the need to seek additional ways to increase productivity. The exploitation of economies of scope, based on cargo diversity, has shown a significant – albeit moderate – effect on efficiency scores. This fact may guide trucking companies during the process of mergers and acquisitions, helping them to focus on supplementary transportation niches.
However, caution is still in order, as the operation at the most productive scale size strongly depends on variables related to the type of cargo diversity and to the geographical scope of operations. The match between resources and demands should be construed carefully, since different transport operations may lead to different patterns of resource allocation among activities, potentially making adjustments of the scale of operation more feasible. As expected, containerized cargo exerts a positive impact on scale efficiency. This type of cargo may be the key variable in guiding companies during the consolidation process.
References
ADLER, N.; BERECHMAN, J. Measuring airport quality from the airlines’ viewpoint: an application of data envelopment analysis. Transport Policy, v. 8, p. 171-181, 2001. http:// dx.doi.org/10.1016/S0967-070X(01)00011-7
ADLER, N.; GOLANY, B. Evaluation of deregulated airline networks using data envelopment analysis combined with principal component analysis with an application to Western Europe. European Journal of Operations Research, v. 132, p. 260-273, 2001. http://dx.doi. org/10.1016/S0377-2217(00)00150-8
GOMES, E. G. et al. Efficiency and sustainability assessment for a group of farmers in the Brazilian Amazon. Annals of Operations Research, v. 69, p. 167-182, 2009. http:// dx.doi.org/10.1007/s10479-008-390-6
GREEN, R.; DOYLE, J.; COOK, W. D. Efficiency bounds in data envelopment analysis. European Journal of Operational Research, v. 89, n. 3, p. 482-490, 1996.
GREENE, W. H. LIMDEP version 9.0 – Econometric modeling guide. New York: Econometric Software, 2007.
GROSSKOPF, S.; YAISAWARANG, S. Economies of scope in the provision of local public services. National tax Journal, v. 43, p. 61-74, 1990.
HAMDAN, A.; ROGERS, K. J. Evaluating the efficiency of 3PL logistics operations. International Journal of Production Economics, v. 113, p. 235-244, 2007. http://dx.doi. org/10.1016/j.ijpe.2007.05.019
HAIR, J. F.; ANDERSON, R. E.; TATHAM, R. L. Multivariate data analysis. New York: Prentice Hall, 1998.
HJALMARSSON, L.; ODECK, J. Efficiency of trucks in road construction and maintenance: an evaluation with data envelopment analysis. Computers & Operations Research,
v. 23 n. 4, p. 393-404, 1996.
JENKINS, L.; ANDERSON, L. A multivariate statistical approach to reducing the number of variables in data envelopment analysis. European Journal of Operational Research, v. 147, p. 51-61, 2003. http://dx.doi.org/10.1016/ S0377-2217(02)00243-6
KOHONEN, T. Self-organized formation of topologically correct feature maps. Biological Cybernetics, v. 43, p. 59-69, 1982.
KUMBHAKAR, S. C.; LOVELL, C. A. Stochastic Frontier Analysis. Cambridge: Cambridge University Press, 2003. LEWIN, A.; MOREY, R.; COOK, T. Evaluating the administrative
efficiency of courts. Omega, v. 10, p. 401-411, 1982. LIN, L. C.; TSENG, L. A. Application of DEA and SFA on
the measurement of operating efficiencies for 27 international container ports. Proceedings of the Eastern Asia Society for Transportation Studies, v. 5, p. 592-607, 2005.
LIN, L. C.; TSENG, C. C. Operational performance evaluation of major container ports in the Asia-Pacific region. Maritime Policy & Management, v. 34, n. 6, p. 535-551, 2007. MADDALA, G. Limited-dependent and Qualitative Variables
in Econometrics. Cambridge: Cambridge University Press, 1983.
McMULLEN, B. S.; LEE, M. K. Cost efficiency in the US motor carrier industry before and after deregulation: a stochastic frontier approach. Journal of Transport Economics and Policy, v. 33, n. 3, p. 303-317, 1999. MEEUSEN, W.; VAN DEN BROECK, J. Efficiency estimation
from Cobb-Douglas production function with composed error. International Economic Review, v. 8, p. 435-444, 1977.
MEJA, M. M.; CORSI, T. M. Assessing motor carrier potential for improving safety process. Transportation Journal, v. 38, n. 4, p. 36-50, 1999.
MELLO, J. C. Análise de envoltória de dados no estudo da eficiência e dos benchmarks para companhias aéreas brasileiras. Pesquisa Operacional, v. 23, n. 2, p. 325-345, 2003.
COOK, W. D.; SEIFORD, L. M. Data envelopment analysis (DEA) – thirty years on. European Journal of Operational Research, v. 192, n. 1, p. 1-17, 2009. http://dx.doi. org/10.1016/j.ejor.2008.01.032
COOPER, W. W.; SEIFORD, L. M.; ZHU, J. Handbook on Data Envelopment Analysis. Boston: Kluwer Academic Publishers, 2004.
COOPER, W. W.; SEIFORD, L. M.; TONE, K. Data Envelopment Analysis: A Comprehensive Text with Models, Applications, References and DEA-solver Software. New York: Springer, 2007.
CULLINANE, K.; SONG, D. A stochastic frontier model of the productive efficiency of Korean terminals. Applied Economics, v. 35, p. 251-267, 2003. http://dx.doi. org/10.1080/00036840210139355
CULLINANE, K.; SONG, D. Estimating the relative efficiency of European container ports: a stochastic frontier analysis. Research in Transportation Economics, v. 16, p. 85-115, 2006. http://dx.doi.org/10.1016/S0739-8859(06)16005-9
CULLINANE, K.; SONG, D.; WANG, T. The application of mathematical programming approaches to estimating container port production efficiency. Journal of Productivity Analysis, v. 24, p. 73-92, 2005. http:// dx.doi.org/10.1007/s11123-005-3041-9
CULLINANE, K. et al. The technical efficiency of container ports: comparing data envelopment analysis and stochastic frontier analysis. Transportation Research Part A, v. 40, p. 354-374, 2006. http://dx.doi.org/10.1016/j. tra.2005.07.003
DULÁ, J. H.; HELGASON, R. V. A new procedure for identifying the frame of the convex hull of a finite collection of points in multidimensional space. European Journal of Operational Research, v. 92, p. 352-367, 1996.
FERRIER, G. D.; LOVELL, C. A. K. Measuring cost efficiency in banking – econometric and linear programming evidence. Journal of Econometrics, v. 6, p. 229-245, 1990. FIGUEIREDO, K. F.; FLEURY, P. F.; WANKE, P. Logística e
Gerenciamento da Cadeia de Suprimentos: Planejamento do Fluxo e dos Recursos. São Paulo: Atlas, 2003. FLEURY, P. F.; HIJJAR, M. F. Logistics overview in Brazil 2008.
Instituto ILOS, 2008. Disponível em: <http://www.ilos. com.br/index2.php?option=com_docman&task=doc_ view&gid=31&Itemid=44>.
FLEURY, P. F.; RIBEIRO, A. F. M. A indústria de provedores de serviços logísticos no Brasil. In: FIGUEIREDO, K. F.; FLEURY, P. F.; WANKE, P. Logística e Gerenciamento da Cadeia de Suprimentos: Planejamento do Fluxo e dos Recursos. São Paulo: Atlas, 2003. p. 302-312.
FONSECA, A. B. M. et al. Uniformization of frontiers in non-radial ZSG-DEA models: an application to airport revenues. Pesquisa Operacional, v. 30, n. 1, p. 175-193, 2010.
FRIED, H. O. et al. Accounting for environmental effects and statistical noise in data envelopment analysis. Journal of Productivity Analysis, v. 17, p. 157-174, 2002.
GILLEN, D.; LALL, A. Developing measures of airport productivity and performance: an application of Data Envelopment Analysis. Transportation Research Part E: Logistic and Transportation Review, v. 33 n. 4, p. 261-273. 1997.
SENRA, L. F. et al. Estudo sobre métodos de seleção de variáveis em DEA. Pesquisa Operacional, v. 27, n. 2, p. 191-207, 2007. http://dx.doi.org/10.1590/S0101-74382007000200001
SHARMA, M. J.; YU, S. J. Performance based stratification and clustering for benchmarking of container terminals. Expert Systems with Applications, v. 36, n. 3, p. 5016-5022, 2008. http://dx.doi.org/10.1016/j. eswa.2008.06.010
SHEPARD, M. P. et al. Conceptual and pragmatic considerations in conducting a secondary analysis – an example from research of families. Western Journal of Nursing Research, v. 21, n. 2, p. 154-167, 1999. PMid:11512174.
SIMAR, L.; WILSON, P. W. Estimation and inference in two-stage, semiparametric models of production processes. Journal of Econometrics, v. 136, n. 1, p. 31-64, 2007. http://dx.doi.org/10.1016/j.jeconom.2005.07.009 SILVEIRA, J. Q.; MEZA, L. A.; MELLO, J. C. Identificação
de benchmarks e anti-benchmarks para companhias aéreas usando modelos DEA e fronteira invertida. Produção, 2011. Ahead of print. http://dx.doi. org/10.1590/S0103-65132011005000004
SOUZA, G. S. et al. Economic efficiency of Embrapa’s research centers and the influence of contextual variables. Pesquisa Operacional, v. 27, p. 15-26, 2007. http:// dx.doi.org/10.1590/S0101-74382007000100002 SOUZA, G. S.; STAUB, R. B. Two-stage inference using
data envelopment analysis efficiency measurements in univariate production models. International Transactions in Operational Research, v. 14, p. 245-258, 2007. TABACHNICK, B. G.; FIDELL, L. S. Using multivariate statistics.
Boston: Allyn and Bacon, 2001.
TURNER, H.; WINDLE, R.; DRESSNER, M. North American containerport productivity: 1984-1997. Transportation Research Part E, v. 40, p. 339-356, 2004. http://dx.doi. org/10.1016/j.tre.2003.06.001
VARGAS, C.; BRICKER, D. Combining DEA and factor analysis to improve evaluation of academic departments given uncertainty about the output constructs. Iowa City: Department of Industrial Engineering, University of Iowa, 2000. Working Paper.
WAGNER, J. M.; SHIMSHAK, D. G. Stepwise selection of variables in data envelopment analysis: procedures and managerial perspectives. European Journal of Operational Research, v. 180, n. 1, p. 57-67, 2007. http://dx.doi. org/10.1016/j.ejor.2006.02.048
WANG, T. F.; SONG, D. W.; CULLINANE, K. The applicability of data envelopment analysis to efficiency measurement of container ports. In: IAME PANAMA INTERNATIONAL STEERING COMITEE, 2002, Panamá. Proceedings... Panamá, 2002.
WANG, W.-K.; LU, W.-M.; TSAI, C.-J. The relationship between airline performance and corporate governance amongst US Listed companies. Journal of Air Transport Management, v 17, n. 2, p. 148-152, 2011.
WANKE, P. F.; FLEURY, P. F. Transporte de Cargas no Brasil: Estudo Exploratório das Principais Variáveis Relacionadas aos Diferentes Modais e às suas Estruturas de Custos. In: NEGRI, J. A.; KUBOTA, L. C. (Orgs.). Estrutura e Dinâmica do Setor de Serviços no Brasil. Brasília: IPEA, 2006. WANKE, P. F.; AFFONSO, C. R. Determinantes da eficiência
de escala no setor brasileiro de operadores logísticos. MIN, H.; JOO, S. J. Benchmarking the operational efficiency
of third party logistics providers using data envelopment analysis. Supply Chain Management: An International Journal, v. 11, p. 259-265, 2006. http://dx.doi. org/10.1108/13598540610662167
MIN, H.; PARK, B.-I. Evaluating the inter-temporal efficiency trends of international container terminals using data envelopment analysis. International Journal of Integrated Supply Management, v. 1, n. 3, p. 258-277, 2005. MIRANDA, C. M. G.; ALMEIDA, A. T. Visão multicritério
da avaliação de programas de pós-graduação pela CAPES - o caso da área Engenharias III baseado nos métodos ELECTRE II e MAUT. Gestão & Produção, v. 11, n. 1, p. 51-64, 2004. http://dx.doi.org/10.1590/ S0104-530X2004000100005
MORIARTY, H. J. et al. Issues to consider when choosing and using large national databases for research of families. Western Journal of Nursing Research, v. 21, n. 2, p. 143-153, 1999.
NADIMI, R.; JOLAI, F. Joint use of Factor Analysis (FA) and Data Envelopment Analysis (DEA) for ranking of Data Envelopment Analysis. International Journal of Mathematical, Physical and Engineeiring Sciences, v. 2, n. 4, p. 218-222, 2008.
NICOLA, P. C. Experimenting with Dynamic Macromodels Growth and Cycles. Berlin: Springer, 2008.
NOVAES, A. G. N.; SILVEIRA, S. F.; MEDEIROS, H. C. Efficiency and productivity analysis of the interstate bus transportation industry in Brazil. Pesquisa Operacional, v. 30, n. 2, p. 465-485, 2010.
ODECK, J.; ALKADI, A. Evaluating efficiency of the Norwegian bus industry using data envelopment analysis. Transportation, v. 28, p. 211-232, 2001.
ODECK, J.; HJALMARSSON, L. The performance of trucks – an evaluation using data envelopment analysis. Transportation Planning and Technology, v. 20, n. 1, p. 49-66, 1996.
PACHECO, R. R.; FERNANDES, E. Managerial efficiency of Brazilian airports. Transportation Research Part A, v. 37, p. 667-680, 2003. http://dx.doi.org/10.1016/S0965-8564(03)00013-2
POLI, P. M.; SCHERAGA, C. A. A quality assessment of motor carrier maintenance strategies: an application of data envelopment analysis. Quarterly Journal of Business and Economics, v. 40, n. 1, p. 25-43, 2001.
RAY, S. C. A one-step procedure for returns to scale classification of decision making units in data envelopment analysis. University of Connecticut, 2010. Disponível em: <http://www.econ.uconn.edu>.
RITTER, C.; SIMAR, L. Pitfalls of normal-gamma stochastic frontier models. Journal of Productivity Analysis, v. 8, n. 2, p. 167-182, 1997.
SARKIS, J.; TALLURI, S. Performance based clustering for benchmarking of US airports. Transportation Research Part A, v. 38, p. 329-346, 2004. http://dx.doi. org/10.1016/j.tra.2003.11.001
SCHEFCZYK, M. Operational performance of airlines: an extension of traditional measurement paradigms. Strategic Management Journal, v. 14, p. 301-317, 1993. SCHMIDT, P. Frontier production functions. Econometric
Produção, v. 21, n. 1, p. 53-63, 2011. http://dx.doi. org/10.1590/S0103-65132010005000045
WEBER, M. M.; WEBER, W. L. Productivity and efficiency in the trucking industry: accounting for traffic fatalities. International Journal of Physical Distribution & Logistics
Management, v. 34, n. 1-2, p. 39-61, 2004. http://dx.doi. org/10.1108/09600030410515673
WILSON, D.; PURUSHOTHAMAN, R. Dreaming with BRICs: The path to 2050. Global Economic Paper, 2003. n. 99. Disponível em: <http://www.gs.com>.
YANG, Z. A two-stage DEA model to evaluate the overall performance of Canadian life and health insurance companies. Mathematical and Computer Modelling, v. 43, n. 7-8, p. 910-919, 2006. http://dx.doi.org/10.1016/j. mcm.2005.12.011
YOUNGBLUT, J. M.; CASPER, G. R. Focus on psychometrics: single-item indicators in nursing research. Research on Nursing in Health, v. 16, p. 459-465, 1993.
ZAREPISHEH, M.; KHORRAM, E.; JAHANSHAHLOO, G. R. Returns to scale in multiplicative models in data envelopment analysis. Annals of Operations Research, v. 173, p. 195-206, 2010. http://dx.doi.org/10.1007/ s10479-009-0537-0
ZHOU, G. et al. Evaluating the comparative efficiency of Chinese third-party logistics providers using data envelopment analysis. International Journal of Physical Distribution
& Logistics Management, v. 38, n. 4, p. 262-279, 2008.
http://dx.doi.org/10.1108/09600030810875373 ZHU, J. Quantitative Models for Performance Evaluation
and Benchmarking: Data Envelopment Analysis with Spreadsheets and DEA Excel Solver. New York: Springer, 2003.
ZILL, N.; DALY, M. Researching the family: A guide to survey and statistical data in US families. Washington: U.S. Department of Health and Human Services, 1993.
Acknowledgments